![[OLD FALL 2019] 15-104 • Introduction to Computing for Creative Practice](https://courses.ideate.cmu.edu/15-104/f2019/wp-content/uploads/2020/08/stop-banner.png)
//Mihika Bansal
//mbansal@andrew.cmu.edu
//Section E
//Project 5


function setup() {
    createCanvas(480, 480);
}


function draw() {

    var mx = constrain(mouseX, 0, 480); //constraining variables
    var my = constrain(mouseY, 0, 480);

    background(0, 0, 0, 75);

    drawHypotrochoid(); //color one
    drawBlackHypotrochoid(); //black one
    drawBlackHypotrochoid2(); //black one
    drawCenter(); //center flower ellipse
    frameRate(500);

}

function drawHypotrochoid(){

    push();
    translate(width / 2, height / 2);
    var mx = constrain(mouseX, 0, 480); //constraining variables
    var my = constrain(mouseY, 0, 480);

    var rad1 = 230; //radius and parameters

    var r = my * 0.4; //color variables
    var g = 100;
    var b = mx * 0.4;

    noFill();
    stroke(r, g, b);
    strokeWeight(4);

    var a1 = map(mx, 0, width, 0, 20);
    var b1 = map(my, 0, height, 0, 1);

    beginShape();
    rotate(radians(angle));

    for(var i = 0; i < 360; i += 5){
        var angle = map(i, 0, 360, 0, 360);

        var x = (a1 - b1) * cos(angle) + rad1 * cos((a1 - b1 * angle)); //equations of math functions
        var y = (a1 - b1) * sin(angle) - rad1 * sin((a1 - b1 * angle));

        curveVertex(x, y); //drawing points

    }

    endShape();
    pop();

}

function drawBlackHypotrochoid(){

    push();
    translate(width / 2, height / 2);
    var mx = constrain(mouseX, 0, 480); //constraining variables
    var my = constrain(mouseY, 0, 480);

    var rad1 = 380; //radius and parameters


    noFill();
    stroke("black"); //overlapping the first function with a black one so that it cuts through it
    strokeWeight(10);

    var a1 = map(mx, 0, width, 0, 25);
    var b1 = map(my, 0, height, 0, 5);

    beginShape();
    rotate(radians(angle));

    for(var i = 0; i < 360; i += 5){ //determines numnber of times loop runs
        var angle = map(i, 0, 360, 0, 360);

        var x = (a1 - b1) * cos(angle) + rad1 * cos((a1 - b1 * angle)); //equations of math functions
        var y = (a1 - b1) * sin(angle) - rad1 * sin((a1 - b1 * angle));

        curveVertex(x, y); //drawing points

    }

    endShape();
    pop();

}
function drawBlackHypotrochoid2(){

    push();
    translate(width / 2, height / 2);
    var mx = constrain(mouseX, 0, 480); //constraining variables
    var my = constrain(mouseY, 0, 480);

    var rad1 = 300; //radius and parameters


    noFill();
    stroke("black"); //overlapping the first function with a black one so that it cuts through it
    strokeWeight(10);

    var a1 = map(my, 0, width, 0, 30);
    var b1 = map(mx, 0, height, 0, 2);

    beginShape();
    rotate(radians(angle));

    for(var i = 0; i < 360; i += 5){ //determines numnber of times loop runs
        var angle = map(i, 0, 360, 0, 360);

        var x = (a1 - b1) * cos(angle) + rad1 * cos((a1 - b1 * angle)); //equations of math functions
        var y = (a1 - b1) * sin(angle) - rad1 * sin((a1 - b1 * angle));

        curveVertex(x, y); //drawing points

    }

    endShape();
    pop();

}

function drawCenter(){
    translate(width / 2, height / 2);
    noFill();

    var mx = constrain(mouseX, 0, 480); // define constrain variables
    var my = constrain(mouseY, 0, 480);

    var angle = map(mx, 0, width, 0, 360);// define draw parameters
    var a2 = 70 + (.3 * mx);
    var b2 = 70 + (.3 * mx);

    var r = my * 0.5; //color variables
    var g = 50;
    var b = mx * 0.5;

    // define stroke
    strokeWeight(1);
    stroke(r, g, b);
    // define shape parameters
    beginShape();
    rotate(radians(angle));
    for (var t = 0; t < 160; t += 2.5){

        var x = a2 * (cos(t)); //equation function
        var y = b2 * (sin(t));
        curveVertex(x,y);
        }
    endShape();
}
This project was quite confusing to grasp at first, but once I had an idea of what I wanted to do, I was able to explore the functions in an interesting manner. I spent a good amount of time playing around with my numbers in my code to get interesting interactions with the way that the curve moves, and forms. I was also able to layer curves in a way that created fun patterns. Here are some screen shots from the project at different states of the mouse location.
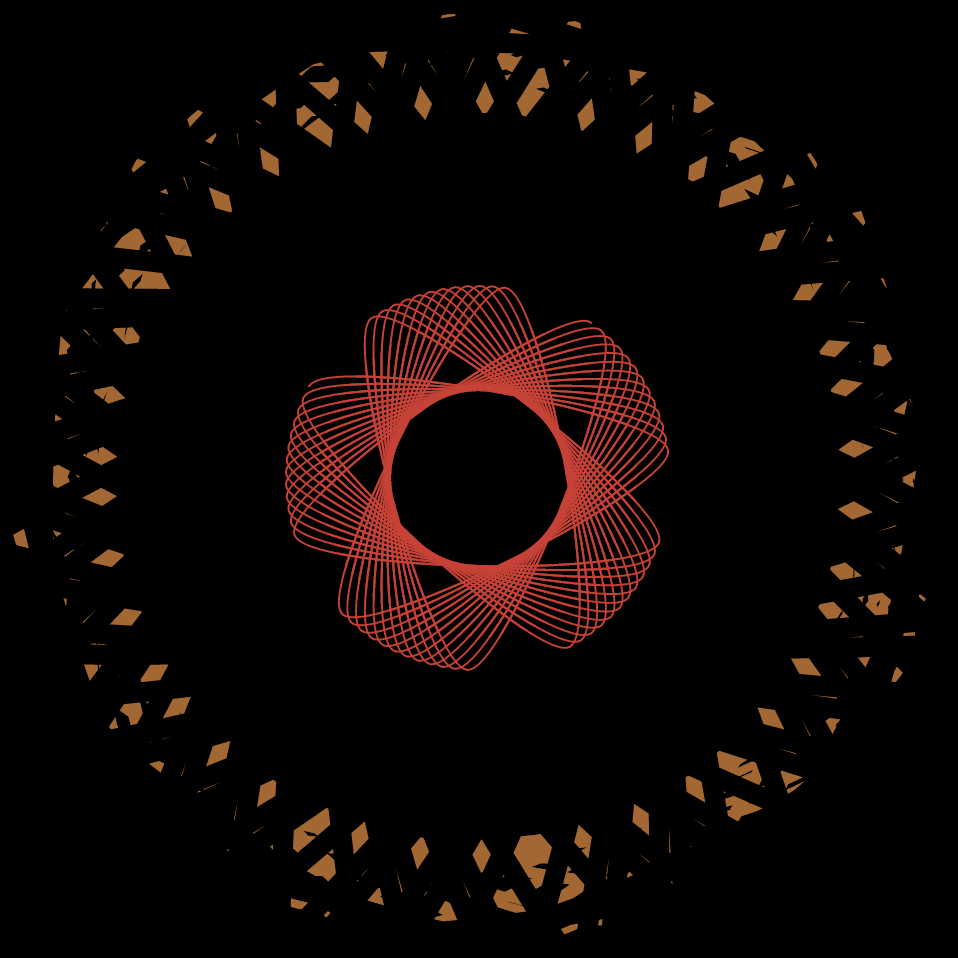
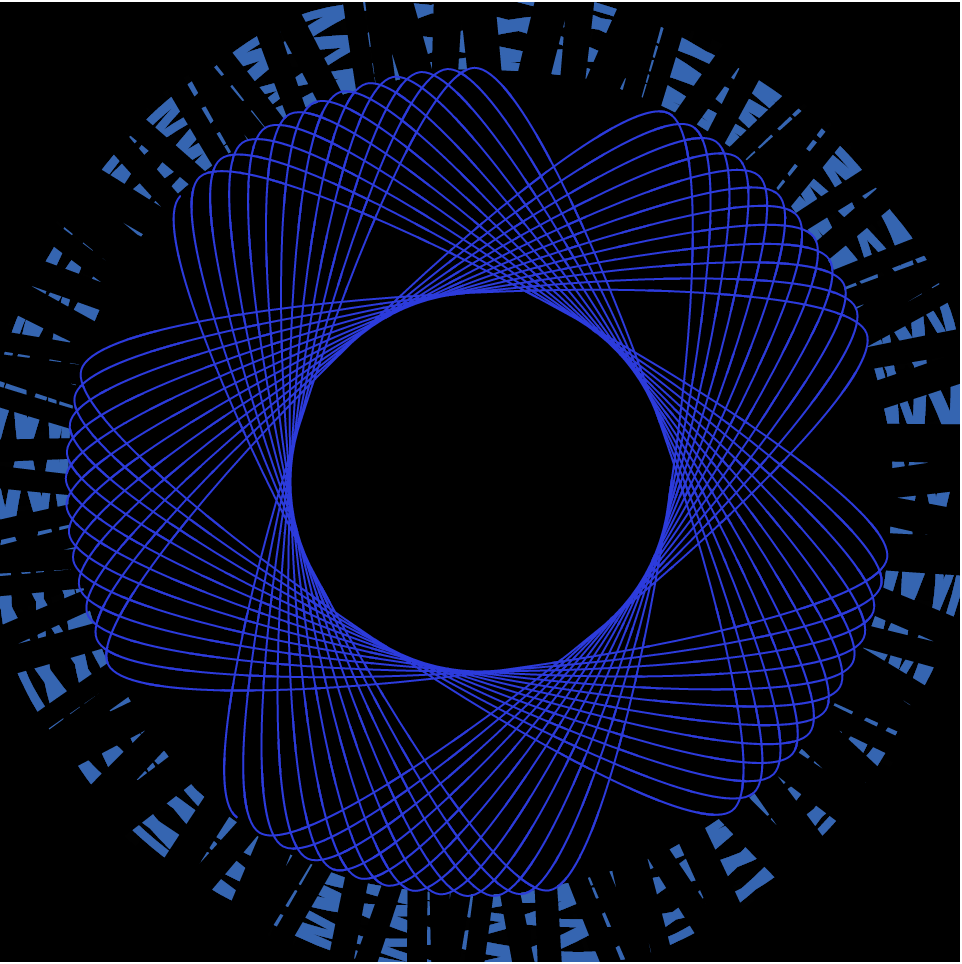
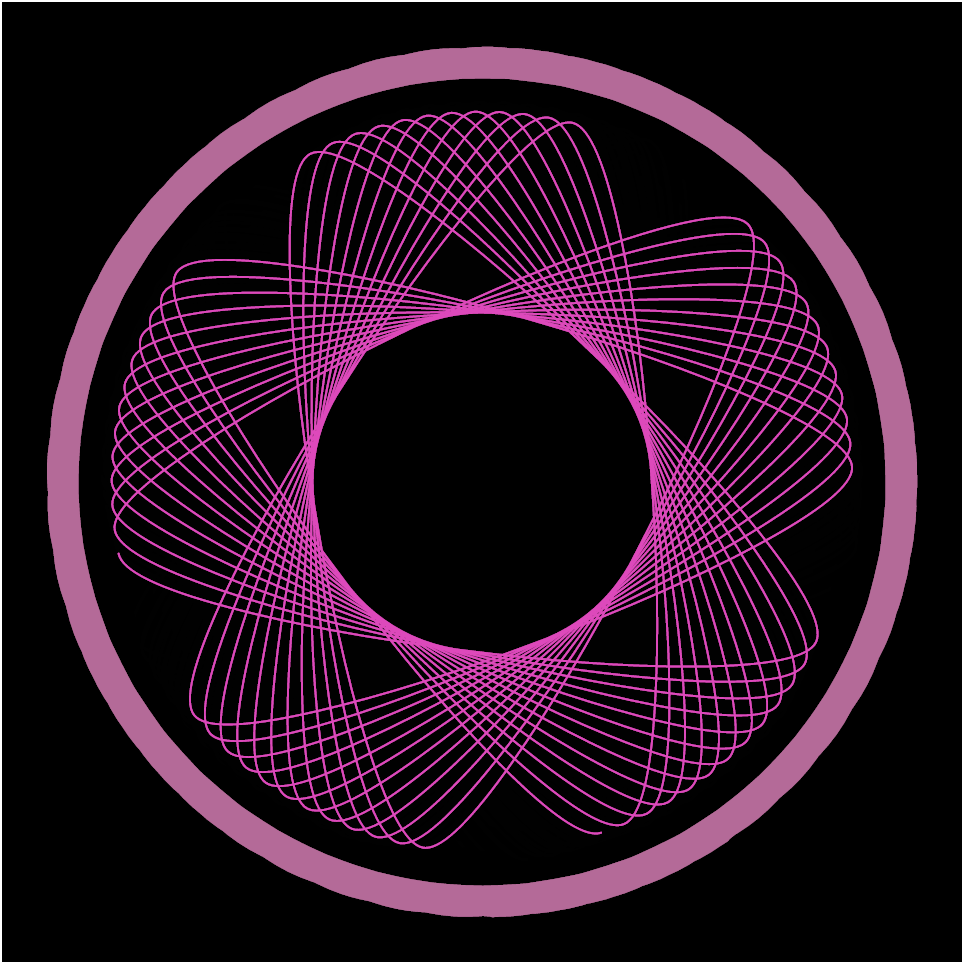
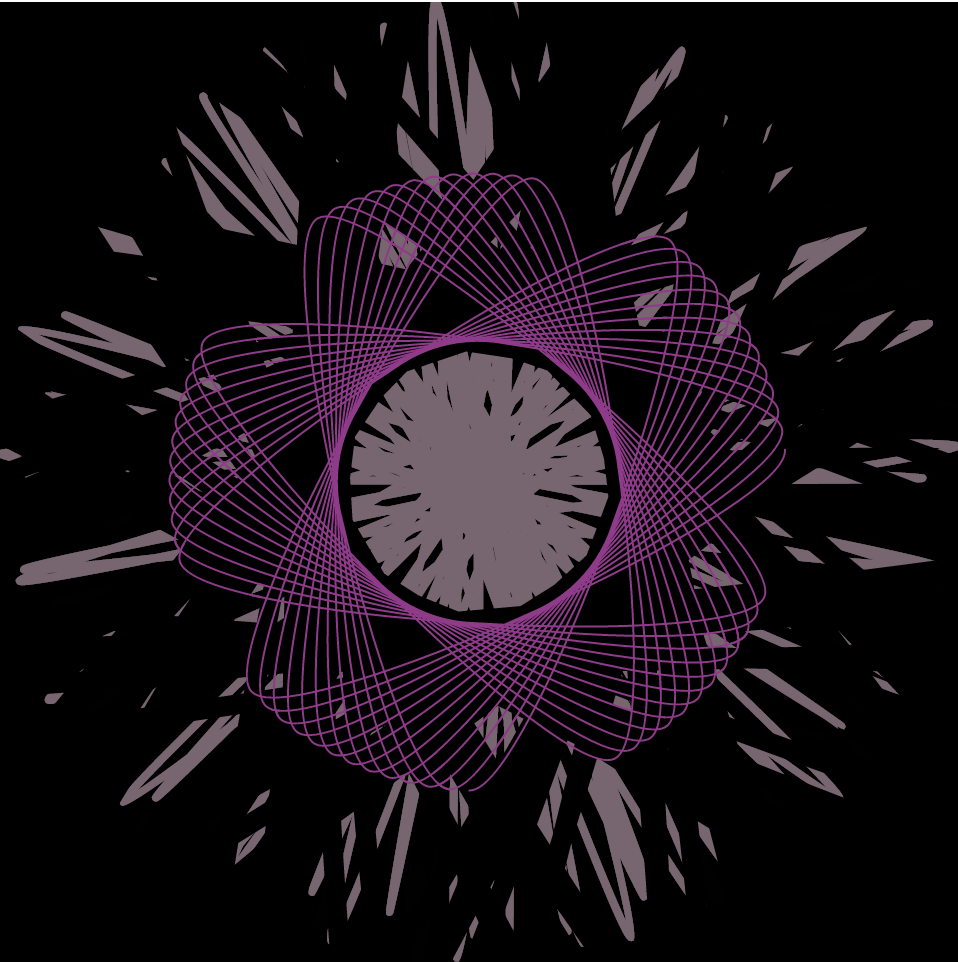
Screenshots from the code