Wind Map (2012 – present)
Martin Wattenberg and Fernanda Viegas

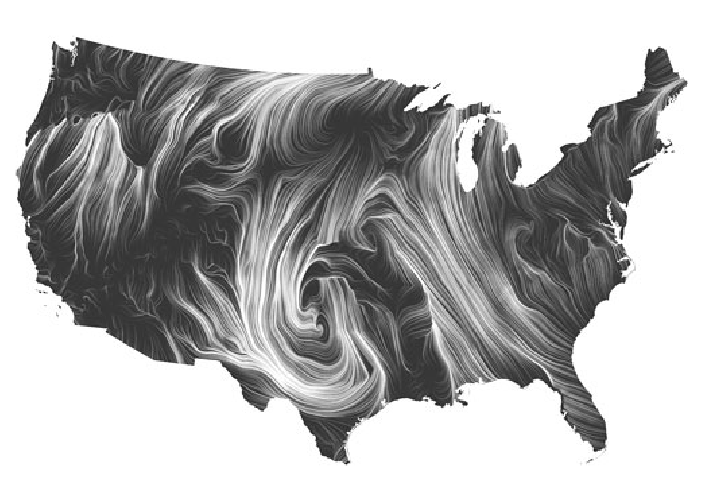
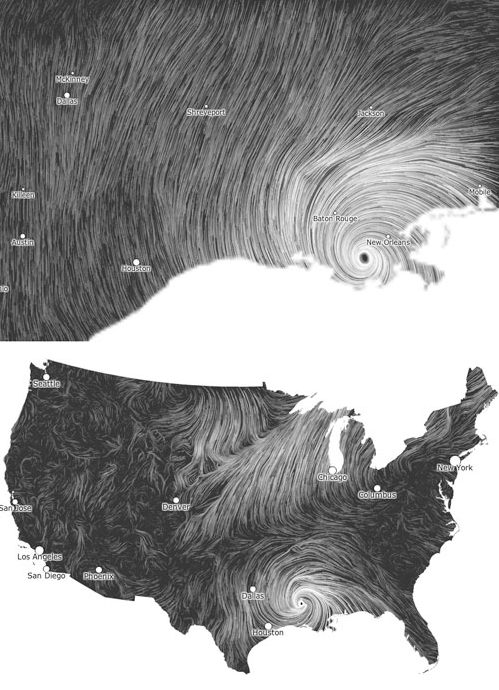
Martin Wattenberg and Fernanda Viegas’ Wind Map visualizes the tracery of wind flow over the United States in the most basic and familiar way—visual motion. On calm wind days, the artwork can be a “soothing meditation on the environment” (Wattenberg), whereas during hurricanes, the piece can become overwhelming and terrifying. Something that I found interesting was that bird watchers actually use the map to track migration patterns, and cyclists use it to prepare for trips. Even conspiracy theorists use the map to track mysterious air chemicals. Data for the wind map was collected from the National Digital Forecast Database, and Wattenberg took inspiration from Edmund Halley (1686), who developed the technique of using comet-like trails to visualize motion. Wattenberg used HTML and JavaScript.

![[OLD FALL 2020] 15-104 • Introduction to Computing for Creative Practice](https://courses.ideate.cmu.edu/15-104/f2020/wp-content/uploads/2021/09/stop-banner.png)