![[OLD FALL 2020] 15-104 • Introduction to Computing for Creative Practice](https://courses.ideate.cmu.edu/15-104/f2020/wp-content/uploads/2021/09/stop-banner.png)
Iris Yip iyip
15-104 Section D
LO-09
This week for Looking Outwards, I looked at Tian’s Looking Outwards post on Stamen Studios as part of interactive informational visualizations. He specifically looked at a map looking at bird populations in National parks. I wanted to write and learn about this topic this week because I felt that he really communicated the importance of interactive maps that allows people to look at an issue from multiple perspectives simultaneously. I think it’s a good way of communicating massive amounts of information with lots of different variables. I think that this particular example definitely helps support how interactive data can achieve ways of communication through motion and interaction that regular types of data visualization might not be able to do.
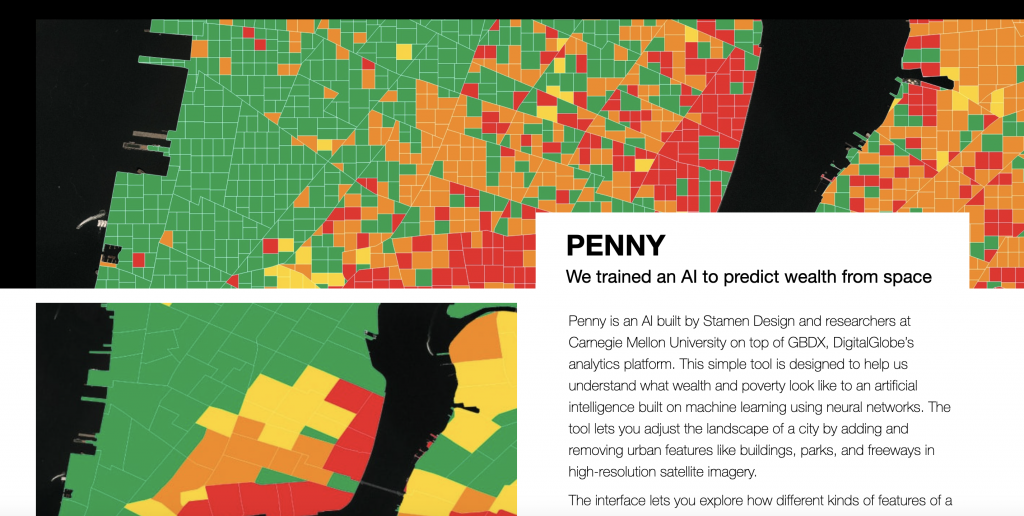
Another project I was drawn to from the same studio/artist is PENNY, which uses an AI to estimate wealth levels of an area based on images. While not entirely guaranteed to be accurate, there is a lot of consideration for signs of areas of low socio-economic welfare in a more directed way. I think that overall, there is a lot of consideration for the unique ways that digital information can be uniquely synthesized and used to make data collection and analysis easier.