Final Project – Interactive Pandemic Visualizer

sketch
/*
 * Eric Zhao
 * ezhao2
 * 15-104D
 * Final Project: Pandemic Simulation
 */

var p;
var noiseStep = 0.005;
var noiseParam = 0;
var particles = []; //all particles
var numParticles = 50;
var infectedList = []; //all the particles that are infected
var generation = 0; //what "round" of infection the dots are on
var colorList = []; //list of colors to mark the generation of infection
var paused = false; //is the program paused?
var numCols = 8; //number of dots per row (color picker)
var menuMode = 0; //shows controls or visualizations
var masksOn = false; //are the particles wearing masks
var filterCol = 0; //color 
var filterState = false; //is the program filtering dots?
var masksOn = false; //are the dots wearing masks?
var sketchState = 0; //affects if title screen is displayed


function setup() {
    //makes array of particles and infects the first one
    createCanvas(400, 600);
    background(100);
    colorMode(HSB);
    for(var i = 0; i < numParticles; i++){
        p = makeParticle(random(0, width), random(0, height), 3, 3,
            random(0, 100), i);
        particles.push(p);
    }
    var startColor = color(0, 100, 100);
    colorList.push(startColor);

    particles[0].infectedBy = 0;
    particles[0].size = 25;
    particles[0].infectColor = colorList[0];
    infectedList.push(particles[0]);

}

function draw(){
    stroke(100);
    background(50, 20, 20);
    fill(100);
    for(var i = 0; i < numParticles; i++){
        if(particles[i].infectedBy != -1){
            drawConnections(particles[i]);
        } 
    }
    for(var i = 0; i < numParticles; i++){
        particles[i].draw();
        if(paused == false){
            particles[i].step();
        }
    }
    if(paused == false){
        noiseParam+=noiseStep;
    }
    drawUI();
}


function makeParticle(px, py, dpx, dpy, noiseOffset, index){
    p = {x: px, y: py, dx: dpx, dy: dpy,
         infectedBy: -1, //if infected, which dot infected it?
         ID: index, //the dot's position in the original array
         infectColor: color(0, 0, 100), //color of the dot
         size: 10, //size of the dot
         offset: noiseOffset,
         step: stepParticle,
         draw: drawParticle};
    return p;
}

function stepParticle(){
    //moves particle based on Perlin noise

    this.x = width * map(noise(noiseParam + this.offset), 0, 1, -0.4, 1.4);
    this.y = width * map(noise(noiseParam + this.offset + 5), 0, 1, -0.4, 1.4);
}

function drawParticle(){
    fill(255);
    push();
    noStroke();
    if(this.infectedBy > -1){
            fill(this.infectColor); 
    }
    //show dot only if not filtering or if it matches filter color
    if(filterState == true){
        var tempCLR = getRGB(this.infectColor);
        if(compareColors(tempCLR, filterCol) == false){
            noFill();
        }
    }
    circle(this.x, this.y, this.size);
    pop();
}

function drawConnections(infectedP){
    //draws a line between a dot and its infector
    push();
    var ind = infectedP.infectedBy;
    if(infectedP.infectedBy > -1){
        var tempCLR = particles[ind].infectColor;
        strokeWeight(1);
        stroke(tempCLR);
    }
    //show line only if it matches the filter color
    if(filterState == true){
        var infectedRGB = getRGB(tempCLR);
        if(compareColors(tempCLR, filterCol) == false){
            noStroke();
        }
    }
    line(infectedP.x, infectedP.y, particles[ind].x, particles[ind].y);   
    pop();
}

function infection(population, infected){
    //make empty array, push newly infected particles here

    //if particles were infected, generate a new fill color
    //for them

    //adjust size of infected particles
    var base = infected.length;
    var newCases = [];
    print("Previous number: "+infected.length);

    //the basic logic: for all infected particles, check
    //if any non-infected particles are nearby. If so,
    //infect the particle and push it to an empty array.
    //add this array to the whole list of infected particles
    //at the end.
    for(var i = 0; i < infected.length; i++){
        for(var j = 0; j < numParticles; j++){
            if(dist(population[j].x, population[j].y,
            infected[i].x, infected[i].y) < 25
            & population[j].infectedBy == -1){
                if(masksOn == true){
                    if(random(0,1) > 0.66){
                        population[j].infectedBy = infected[i].ID;
                        newCases.push(population[j]);
                    }
                } else {
                    population[j].infectedBy = infected[i].ID;
                    newCases.push(population[j]);
                }
            }
        }
    }

    if(newCases.length > 0) {
        for(var i = 0; i < newCases.length; i++){
            infected.push(newCases[i]);
        }
        generation++;
        var newC = color(random(360), random(25, 100), 100);
        colorList.push(newC);
        print(infected.length);
        print(colorList.length);
        for(i = 0; i < (infected.length-base); i++){
            //makes particle size 90 percent of the one it was infected by
            infected[base+i].size =
                0.9*(particles[infected[base+i].infectedBy].size);
            //changes color to a new random fill (per generation)
            infected[base+i].infectColor = colorList[generation]; //
        }
    }
    print("Number infected: " + infected.length);
    print("Generation: "+ generation);
    print(colorList.length);
    print("__________h_______");
}

function mousePressed(){
    if(sketchState == 0){
        sketchState = 1;
    } else {
        if(mouseY < width){
            infection(particles, infectedList);
        } else if(mouseY >= width & mouseY <= height){
            filterStatus(get(mouseX, mouseY));
        }
    }
}

function keyTyped(){
    if(key === 'p'){
        //pause function that freezes movement but allows infection
        pauseMove();
    }
    if(key === 'r'){
    //Resets dot states but not entire sketch
        resetSketch();
    }
    if(key === 'h'){
    //switches menu between guide and data visualization
        if(menuMode == 0){
        menuMode = 1;
        print('data');
        } else {
            menuMode = 0;
            print('help');
        }
    }
    if(key === 'm'){
    //toggles masks on/off
        if (masksOn){
            masksOn = false;
        } else{
            masksOn = true;
        }
    }
}

function titleScreen(){
    push();
        translate(25, 75);
        stroke(100);
        fill(50, 5, 100, 0.9);
        textSize(14);
        var rectW = width - 50;
        var rectH = 0.48*height;
        var backgroundTxt = "This is a simple simulation of a viral outbreak \
such as COVID-19 modeled with a number of colored dots.";
        var inst_1 = "1) Each time you click, all infected (colored) dots \
        will infect those nearby."
        var inst_2 = "2) Connections between the infector and newly infected \
            dot are shown."
        var inst_3 = "3) Make the dots wear masks by pressing [ W ]."
        var inst_4 = "4) Filter infected dots by pressing [ H ]."
        var inst_5 = "5) Reset all dots with [ R ]."
        var inst_6 = "(click anywhere to hide)"

        rect(0, 0, rectW, rectH, 10);
        fill(0);
        textSize(18);
        textStyle(BOLD);
        text("Visualizing a Pandemic", 20, 30);
        textSize(14);
        text("How to Use:", 20, 105);
        textSize(12);
        textStyle(NORMAL);
        text(backgroundTxt, 20, 50, 300, 150);
        text(inst_1, 20, 120, 300, 150);
        text(inst_2, 20, 160, 300, 150);
        text(inst_3, 20, 200, 300, 150);
        text(inst_4, 20, 225, 300, 150);
        text(inst_5, 20, 260);
        text(inst_6, 215, 28);
        stroke(0);
        line(20, 40, rectW-20, 40);
    pop();
}

function drawUI(){
    push();
        if(sketchState == 0)
            titleScreen();
        translate(25, width);
        fill(50, 20, 25, 0.75);
        textSize(14);
        var rectW = width - 50;
        var rectH = (height-width)-25;
        rect(0, 0, rectW, rectH, 10);
        noStroke();
        fill(100);
        textSize(14);
        textStyle(BOLD);

        if(masksOn){
            fill(120, 72, 90);
            text("Masks ON", 275, -10);
        } else{
            fill(0, 72, 90);
            text("Masks OFF", 275, -10);
        }

        fill(100);
        if(menuMode == 0){
            displayHelp();
        } else{
            displayData();
        }
    pop();
    push();
    if(paused){
        rect(width-50, 25, 8, 25);
        rect(width-34, 25, 8, 25);
    } else {
        triangle(width-50, 25, width-50, 50, width-25, 37.5);
    }
}

function displayHelp(){
        textSize(14);
        textStyle(BOLD);
        text("Guide", 20, 30);
        textStyle(NORMAL);
        textSize(12);
        text("( Press [ H ] to switch to filters )", 65, 30);
        text("[ P ] : Freeze / Unfreeze dots", 20, 100);
        text("[ R ] : Disinfect all dots (except Patient Zero)", 20, 80);
        text("[ CLICK ] to infect nearby dots", 20, 60);
        text("[ M ] : Toggle masks ON / OFF", 20, 120);
        text("[ H ] : Show / Hide controls", 20, 140);
        stroke(100);
}

function displayData(){
        noStroke();
        fill(100);
        textSize(14);
        textStyle(BOLD);
        text("Filter Data", 20, 30);
        textStyle(NORMAL);
        textSize(12);
        if(filterState){
            text("( CLICK away from squares to show all )", 90, 30);
        } else{
            text("( CLICK to isolate )", 90, 30);
        }
        drawPalette();
}

function resetSketch(){
    //code modified from setup();
    for(var i = 0; i < numParticles; i++){
            particles[i].infectedBy = -1;
            particles[i].infectColor = color(0, 0, 100);
            particles[i].size = 10;
    }
    //wipes all modifier arrays
    filterState = false;
    generation = 0;  
    infectedList = [];
    colorList = [];
    var startColor = color(0, 100, 100);
    colorList.push(startColor);

    //reinfects first dot
    particles[0].infectedBy = 0;
    particles[0].size = 25;
    particles[0].infectColor = colorList[0];
    infectedList.push(particles[0]);
}

function pauseMove(){
    if(paused === true){
        paused = false;
        print('resumed');
    } else {
        paused = true;
        print('paused');
    }
}

function drawPalette() {
    //on visualization UI, draw color palette to filter dots
    translate(20, 50);
    var count = 0;
    numRows = ceil(colorList.length / numCols);
    for(var i = 0; i < numRows; i++) {
        for(var j = 0; j < numCols; j++) {
            if(count < colorList.length) {
                fill(colorList[(i * 6) + j]);
                drawColor(40 * (j), 40*i, 30);
                count++;
            }
        }
    }
}

function drawColor(x, y, rSize) {
    rect(x, y, rSize, rSize, 0.125*rSize);
}

function filterStatus(currentColor){
    //reads color of cursor location, enables filtering
    //if the mouse is over a colored square
    if(menuMode != 0){
        for(var i = 0; i < colorList.length; i++){
            print("Infected Color "+i);
            var infectRGB = getRGB(colorList[i]);
            var cursorRGB = getRGB(currentColor);
            print("infected color: " + infectRGB);
            print("cursor color: " + cursorRGB);

            if(compareColors(infectRGB, cursorRGB) == true){
                filterCol = cursorRGB;
                filterState = true;
                return;
            }
        }
    }
    filterState = false;
}

function getRGB(inputColor){
    //converts a color into RGB
    push();
    sampledColor = inputColor;
    colorMode(RGB, 255, 255, 255, 1);
    var r = red(sampledColor);
    var g = green(sampledColor);
    var b = blue(sampledColor);
    sampledColor = color(r, g, b);
    pop();
    return sampledColor;
}

function compareColors(color1, color2){
    //approximates two colors and checks if they are identical
    var r1 = round(red(color1));
    var g1 = round(green(color1));
    var b1 = round(blue(color1));
    var r2 = round(red(color2));
    var g2 = round(green(color2));
    var b2 = round(blue(color2));

    if(r1 == r2 & g1 == g2 && b1 == b2){
        return true;
    }

    return false;

}

When quarantines first started being imposed, I found Youtube channels dedicated to data visualization and education answered all my questions about the COVID-19 pandemic and engaged me to learn further.

Inspired by channels like Primer and 3Blue1Brown, I made an interactive simulation / visualization of a pandemic. Since I had been curious about contact tracing for a while but never understood the concept, I decided to use this opportunity to learn more about it and make it a core feature in my project.

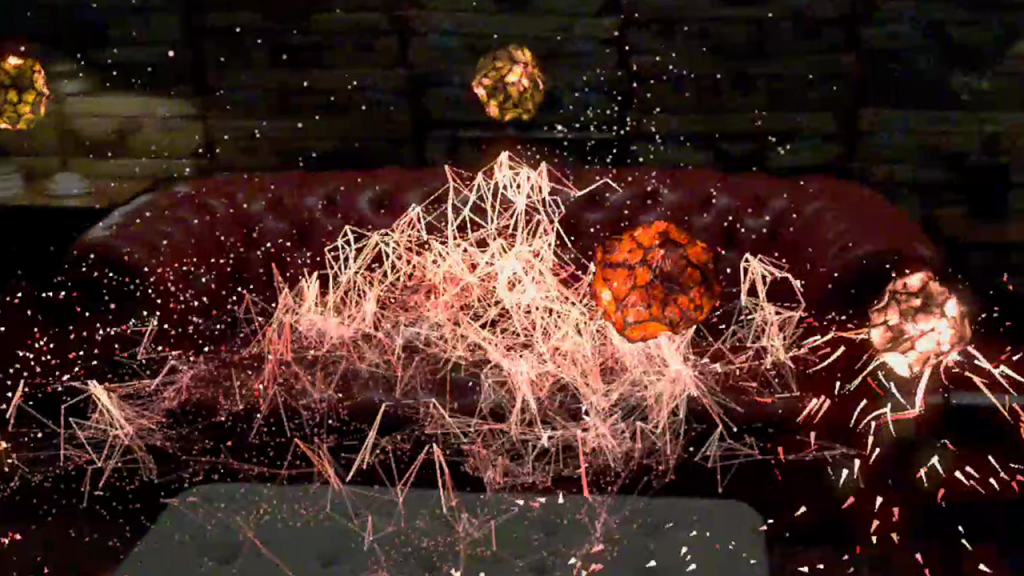
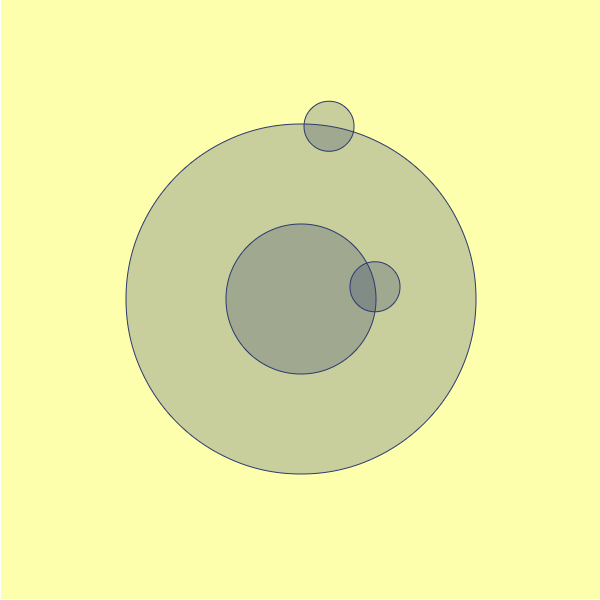
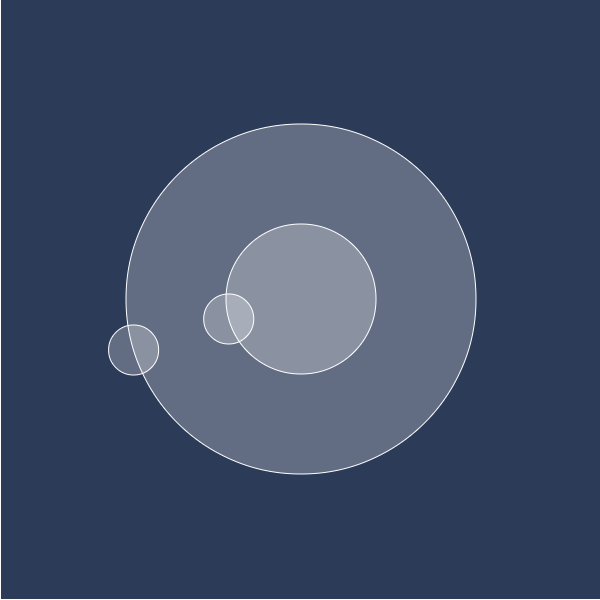
In my visualizer, a population of dots are wandering around the screen. Clicking will cause all infected dots to infect nearby ones. Colored, larger dots have been infected. Additionally, you can see which dot infected which other dot through connecting lines. Since this rough form of contact tracing still gets messy, you can also filter the dots by color (or “generation” of infection) to find “super-spreader” dots.

A good chunk of my time was spent making sure all the interactions worked together without any errors or slowdowns. With more time, I would try mimicking real-life contact tracing more closely through recursion and add animations to the dots.

Below is a short demo of my project demonstrating the difference that having masks on makes on the speed of infection.

LO 11 – Women Practitioners

Milica Zec is a VR filmmaker who focuses on creating stories to raise awareness of societal and environmental issues. Growing up in Serbia, she witnessed war, bombings, and unrest as a child. Her tumultuous childhood inspires her work, in which she hopes to preserve what is precious through creating new realities. 

Milica’s second VR film, Trees, places a viewer in the middle of a rainforest as an immobile tree that grows from a seed and eventually is destroyed by a wildfire, as the viewer watches, helpless as they cannot do anything to save the tree or forest. In a talk at the World Economic Forum, she describes how the film was so moving that many viewers came out in tears, finally understanding climate change on an innate and personal level.

I watched Trees online through a 2D youtube video. While I didn’t experience it the way it was meant to be viewed, I could immediately understand how powerful its message could be when immersing a viewer in these surroundings. I’m excited to see how her next project, Rainforest, continues this message in a more interactive way.

Project 11 – Generative Landscape

sketch
/*
 * Eric Zhao
 * ezhao2@andrew.cmu.edu
 *
 * Generative ladnscape 
 *
 */

var hillHeights = [];
var mountainHeights = [];
//arrays for foreground and background
var noiseParam = 0;
var noiseParam2 = 0;
var noiseStep = 0.01;
var numpoints = 80;
//bottom 4 used as placemarkers and attempts
//to make the hobbit holes not disappear on screen
var xInc;
var circleRad; 
var breadth = 25;
var marginRatio = (numpoints+breadth)/numpoints;

function drawMountain(hill, numpoints){
    //draws a perlin noise mountain
    beginShape();
    vertex(width - width*marginRatio, height);
    vertex(width - width*marginRatio, height);
    for(let i = -breadth; i <= numpoints+breadth; i++){
        vertex(i * xInc, hill[i]);
    }
    vertex(width*marginRatio, height);
    vertex(width*marginRatio, height);   

    endShape();
}

function stepMountain(param, step, hill, numpoints){
    //generates array of perlin values used for mountain and trees
    hill.shift();
    for(let i = -breadth; i <= numpoints+breadth; i++){
        var n = noise(param);
        var value = map(n, 0, 1, 0, height);
        hill.push(value);
        param += step;
    }
    noiseParam = param;
}

function drawHole(circleRad){
    //hobbit hole draw function
    fill(22, 98, 71);
    ellipse(0, 0, circleRad, circleRad);
    fill(random(0, 360), 94, 25);
    ellipse(0, 0, circleRad*0.8, circleRad*0.8);
    stroke(0);
    noFill();
    for(var i = 0; i <= 8; i ++){
        arc(0, 0, circleRad*0.8, circleRad*0.8, i*(PI/8), -i*(PI/8), CHORD);
    }
    fill(50, 80, 90);
    ellipse(0, 0, max(10, circleRad*0.1), max(10, circleRad*0.1));
}

function setup() {
    createCanvas(600, 400);
    colorMode(HSB);
    frameRate(30);
    noStroke();
    strokeWeight(2);
    stepMountain(noiseParam, noiseStep, hillHeights);
}

function draw() {
    xInc = width/numpoints;
    background(183, 33, 95);
    //draws background/dark green mountain
    fill(120, 100, 20);
    stepMountain(noiseParam2, 0.4, mountainHeights, 320)
    drawMountain(mountainHeights, 320);
    //draws foreground scenery
    fill(110, 64, 52);
    stepMountain(noiseParam, noiseStep, hillHeights, numpoints);
    drawMountain(hillHeights, numpoints);
    push();
    translate(0, 20);
    fill(42, 30, 90);
    drawMountain(hillHeights, numpoints);
    //at peaks of hill, add a hobbit hole
    for(let i = -breadth; i <= numpoints+breadth; i++){
            if(i != -breadth & i !=numpoints+breadth){
                if (hillHeights[i] < hillHeights[i-1] &&
                hillHeights[i] < hillHeights[i+1]){
                    push();
                    fill(0);
                    translate(i * xInc, (height + hillHeights[i])/2);
                    drawHole((height-hillHeights[i])/1.5);
                    pop();              
                }

            }
        }
    pop();

}

My idea was to generate a rolling hill and place hobbit holes at random locations or peaks under the hill, with their basic shape looking something like this:

Unfortunately, I realized too late that the program I wrote didn’t utilize objects and made changing variables about the holes (ex. colors and varying designs) very difficult without restructuring the program significantly.

Project 09 – Computational Portrait

sketch
/*
 * Eric Zhao
 * ezhao2
 *
 * Computational portrait that "draws" an image using
 * an existing image. Clicking the mouse changes the 
 * orientation of the randomly drawn rectangles in 
 * relation to the center.
 */

let img;
let smallPoint, largePoint;
let rotated = false;

function preload() {
    img = loadImage("https://i.imgur.com/uwh5nXO.jpg");
}

function setup() {
    createCanvas(400, 600);
    axisShort = 10;
    axisLong = 30;
    imageMode(CENTER);
    rectMode(CENTER);
    noStroke();
    background(255);
    img.loadPixels();
}

function draw() {
    push();
    cursorX = constrain(mouseX, 0, width);
    cursorY = constrain(mouseY, 0, height);
    let pointillizeX = map(mouseX, 0, width, axisLong/2, axisLong);
    let pointillizeY = map(mouseX, 0, width, axisShort/2, axisShort);
    //changes width and length of rectangles drawn based on mouse position
    let x = floor(random(img.width));
    let y = floor(random(img.height));
    let pix = img.get(x, y);
    fill(pix, 128);

    //orients rectangles around center of canvas
    translate(width/2, height/2);
    x = x-width/2;
    y = y-height/2;
    rotate(atan2(y, x));
    if(rotated == true){
        rect(dist(x, y, 0, 0), 0,
            pointillizeY, pointillizeX, pointillizeY/2);
    } else {
        rect(dist(x, y, 0, 0), 0, 50,
                pointillizeY, pointillizeY/2);
    }
    pop();
}

function mousePressed(){
    //slightly greys out existing composition 
    push();
    fill(255, 192);
    rect(width/2, height/2, width, height);
    pop();
    //changes rectangle orientation b/t parallel and perpendicular
    switch(rotated){
        case true:
            rotated = false;
            print(rotated);
            break;
        case false:
            rotated = true;
            print(rotated);
            break;
    }
}

I wanted to see if there was a way to unify the pointillism example code to make the developing composition feel more cohesive. My portrait draws random strokes (rounded rectangles) of varying width and height based on the mouse position, all oriented towards the center of the canvas. Clicking on the canvas causes the underlying content to be slightly greyed out and the orientation of the rectangles will change (from the short side facing the center to the long side facing the center and vice versa).

Picture is of my friend trying to be fancy while drinking bagged Earl Grey tea, a very unfancy beverage.

Looking Outward 09

Jubbies’s Looking Outwards Post on Joris Laarman piqued my interest. Joris Laarman is a Dutch artist who utilizes emerging technologies in his work and founded a self-named experimental design lab in the Netherlands. 

The work being discussed was his “Strange Attractor Lamp” made in 2016: this was a dynamic piece of random-looking, sweeping metal elements woven together that had the ability to function as a lightning element. 

Jubbies mentions that they enjoy the “blend of digital and organic” within this work and I feel similarly. I love how Joris Laarman is able to turn a material that most people think of as hard, cold, and industrial, and infuse an organic form onto it. 

Looking Outward 08 – The Creative Practice of an Individual

Mike Tucker is a creative lead at Magic Leap, a company that makes an AR headset designed to be comfortable and maneuverable to use. Since the 1990s up to 2018 when he gave a talk at the Eyeo Festival, he transitioned across different mediums to produce work, starting 2D based mediums such as Hypercard and Adobe Flash, moving onto dynamic mediums such as interactive spatial exhibits and finally into VR development.

Mike discussed some main principles he learned from helping create Tonandi at Magic Leap – an interactive project featuring the music of the band Sigur Ros. He mentioned how head tracking, 6 Degrees of Freedom, Spatial Sound, Touch/Hand controls, Eye tracking, and Environmental Design were key, showing how each principle influenced the final version. Tonandi combined audio and visual elements to create an AR space with translucent, abstract, nature-inspired shapes that moved along to the music and changed the user’s perception of sound and their surroundings.

Having a slight interest in VR, I went into his talk mostly expecting him to talk about his work and the company in a very surface level overview without much of the guiding process. However, I came out of it amazed at how sound could be integrated into a spatial experience and immerse a user further than just visuals could, as well as how he demonstrated that spatial computing was ripe with versatility to overtake the future, including applications for impaired users and the possibility to develop experiences entirely through AR and VR.

Looking Outwards 07 – Information Visualization

https://guns.periscopic.com/

On their website, Periscopic brands themselves as a “socially conscious data visualization firm”. They are a team of designers who bring light to societal issues through striking visualizations, such this one, the annual number of gun homicides in the US. 

This visualization represents the lives of those lost to a bullet through an arc of time. A victim’s arc starts as a bright orange line and fades to ash gray at the point they were killed, and the arc extends to the point of their expected natural life expectancy. Each arc can be clicked on providing more information about the homicide and expected lifespan. Periscopic mentions that the gun data was in ASCII format originally, making it difficult to extract the data for artists who had little coding experience. They have converted the data into CSV format and shared it freely.

This visualization struck me by how simple yet powerful its message is. Knowing the context of gun killings that this graphic conveys, the way the arcs turn from a passionate orange to lifeless gray is chilling, especially when seeing the vast number of lines form into a faded mass of death. And even if the 2018 death count of 11,356 doesn’t seem like much, the 472,332 lost years of human life makes it clear that gun homicides are a problem we must address.

Project 07 – Composition with Curves

I wasn’t really inspired by anything this time but I had an idea in mind of a rotating curve that had a trailing effect. I ended up with a variable epicycloid curve, formed by a point traced by a circle’s radius as it rotates around a larger circle. Clicking on the screen adds “petals” to the shape of the curve. At first, I wanted to experiment with a reuleaux triangle and make an animation similar to a rotary engine, but couldn’t figure out the math behind making the triangle follow an eccentric path.

sketch

/*
 * Eric Zhao
 * ezhao2@andrew.cmu.edu
 *
 * Interactive composition with epicycloid curves
 * that changes color with a gradient effect. Click
 * to increase the number of "petals" on the curves.
 *
 */
var numPoints = 75;
var thetaCanvas = 0;
var rotateSpeed = 2;
var multiplier = 2;
var totalScale;
var epicycloid = [];
var baseFill;

function setup() {
    createCanvas(480, 480);
    background(220);
    strokeWeight(2);
    fill(0);
    angleMode(DEGREES);
    colorMode(HSB);
}

function draw() {
        for (let i = 0; i < 10; i++){
        //creates series of nested epicycloid curve objects
        epicycloid[i] = new Object();
        epicycloid[i].shapeScale = 1 - i/10;
        epicycloid[i].a = epicycloid[i].shapeScale * 100;
        epicycloid[i].b = epicycloid[i].a / multiplier;
        epicycloid[i].theta = 0;
    }

    totalScale = map(sin(thetaCanvas), -1, 1, 0.33, 1);
    //makes composition zoom in and out smoothly
    background(0);

    push();
    translate(width/2, height/2);
    rotate(thetaCanvas);
    scale(totalScale);
    for (let i = 0; i < epicycloid.length; i++){
        //slightly offsets hue and rotation of each successive curve
        push();
        rotate(i*10);
        baseFill = ((thetaCanvas + i*10)*2) % 360;
        stroke(baseFill, 100, 100);
        epicycloidCurve(epicycloid[i]);
        pop();
    }
    pop();
    thetaCanvas += rotateSpeed;
}
function epicycloidCurve(e){
    //Epicycloid curve equation
    beginShape();
    for(let i = 0; i <= numPoints; i++){
        e.theta = map(i, 0, numPoints, 0, 360);
        e.x = ((e.a + e.b) * cos(e.theta) - e.b * cos(((e.a + e.b)/e.b) *
        e.theta));
        e.y = ((e.a + e.b) * sin(e.theta) - e.b * sin(((e.a + e.b)/e.b) *
        e.theta));
        curveVertex(e.x, e.y);
    }
    endShape(CLOSE);
}

function mousePressed(){
    //changes number of "petals" in the epicycloid
    multiplier++;
    if(multiplier > 5){
        multiplier = 2;
    }
}


Project 06 – Abstract Clock

sketch
/*
 * Eric Zhao
 * ezhao2@andrew.cmu.edu
 *
 * Abstract clock that represents time indirectly
 * through proximity to base units (for ex. if a minute
 * is close to elapsing). The background color indicates
 * the approximate hour and time of day.
 *
 */


var x;
var y ;
var thetaSec;
var thetaMin;
var secondRad = 75;
var minuteRad = 175;
var speedMult; //rate of acceleration
var baseSpeed = 2; //speed of circles at [time unit] = 0;

function setup() {
    thetaSec = -PI;
    thetaMin = -PI;
    thetaHour = -PI;
    createCanvas(600, 600);
    background(220);
    frameRate(60);
}

function draw() {
    //draws the revolving circles and background
    push();
    translate(300, 300);
    BG();
    secondHand();
    minuteHand();
    pop();
}

function secondHand(){
    /*the "hand" is the inner circle that exponentially
    revolves faster as the seconds count grows
    closer to a minute exactly, then resets to the
    base speed when the seconds count goes back to zero. */
    speedMult = pow(second(), 1.75) / 150;
    x = secondRad * cos(radians(thetaSec));
    y = secondRad * sin(radians(thetaSec));
    circle(x, y, 50);
    thetaSec += baseSpeed + speedMult;
    print(speedMult + baseSpeed);
}

function minuteHand(){
    //see comment in secondHand(), works the same but by min/hour.
    speedMult = pow(minute(), 1.75) / 200;
    x = minuteRad * cos(radians(thetaMin));
    y = minuteRad * sin(radians(thetaMin));
    circle(x, y, 50);
    thetaMin += baseSpeed + speedMult;
    print(speedMult + baseSpeed);
}

function BG(){
    //draws a background with a fill color proportional to time.
    let fillR = map(hour(), 0, 11, 30, 255);
    let fillG = map(hour(), 0, 11, 45, 235);
    let fillB = map(hour(), 0, 11, 70, 150);

    if(hour() >= 12){
        fillR = map(24-hour(), 1, 12, 30, 255);
        fillG = map(24-hour(), 1, 12, 45, 235);
        fillB = map(24-hour(), 1, 12, 70, 150);
    }

    background(fillR, fillG, fillB);
    /*Fill conditions:
     *Goes from dark blue to pale yellow if 0 < hour < 12
     *Goes from pale yellow to dark blue if 12 >= hour > 24 
     */

    if(fillR > 190) {
        stroke(39, 58, 115);
        fill(39, 58, 115, 65);
    } else {
        stroke(255);
        fill(255, 65);
    }
    //changes stroke to dark/light based on brightness of background
    
    circle(0, 0, secondRad*2);
    circle(0, 0, minuteRad*2);
}


I was inspired by mob spawners in Minecraft when making this clock. The mob models in spawners spin faster and faster until a mob spawns from it, then it slows down and starts speeding up again until the next mob spawns.

This clock shows how close the next minute is to passing and how soon the next hour will pass, rather than displaying the exact time. The circles rotating the center speed up exponentially as the time nears the next unit. The outer circle represents minutes/hour and the inner one represents seconds/minute. The background also changes color across a gradient every hour (see code comments).


Daytime hours
Nighttime colors

LO 06 – Randomness

Last year, I was browsing Reddit when I stumbled on a post that took me to a little website: https://nopaint.art/. It’s the work of Jeffrey Alan Scudder, a digital artist who teaches Emerging Digital Practices as a professor in Oregon currently. No Paint is a pseudo-random artwork in the sense that the algorithm contributes randomness, but the user can determine how to utilize it.

No Paint is an online painting game / program. However, the user is presented with only two buttons to interact with the canvas: “No” and “Paint”. Within the program, a vast array of brushes, stickers, and effects are programmed in. Each round of painting, the program presents the user with a brush, sticker, or effect: for example, a two-tone brush that snakes in a random direction continuously, or an effect that continuously changes the saturation the entire canvas. When the user clicks “Paint”, the element or effect is applied in its current state. For example, if a user was presented with a randomly snaking brush, they could wait a long time for the brush to cover most of the canvas before pressing “Paint”, or press it shortly after for a short stroke. Pressing “No” cycles onto the next element or effect. 

This project stuck with me because of its unique take on drawing programs. Since the brushes are randomly chosen and most never cohere well with your existing artwork, you have very little control over what you can draw on the canvas and have to be creative with using randomly selected elements to form a cohesive artwork.