![[OLD FALL 2020] 15-104 • Introduction to Computing for Creative Practice](https://courses.ideate.cmu.edu/15-104/f2020/wp-content/uploads/2021/09/stop-banner.png)
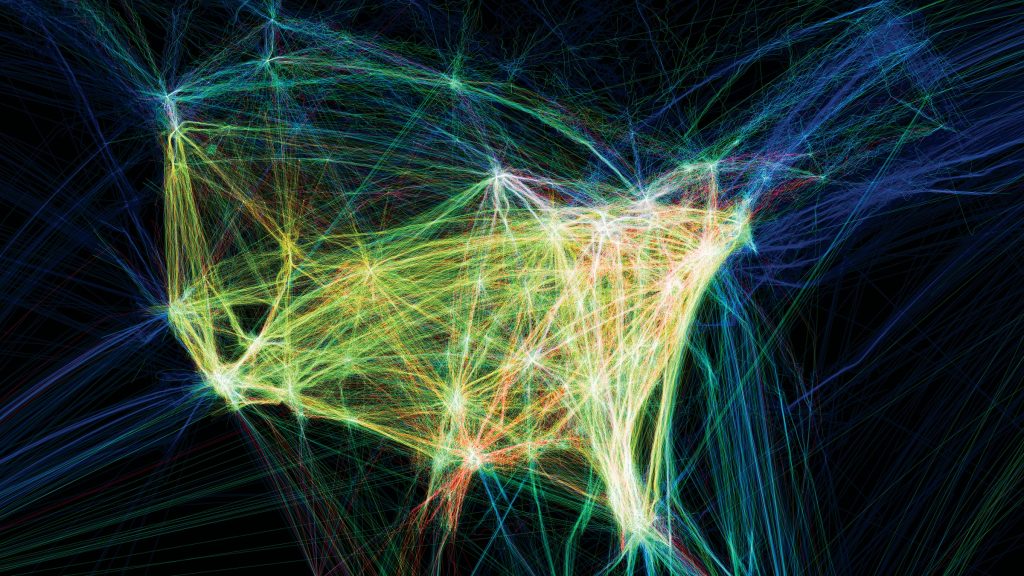
“Flight Patterns” was developed by Aaron Koblin, Scott Hessels, and Gabriel Dunne as part of a series of experiments for the project “Celestial Mechanics” initially created in August 2005. The artists parsed and plotted data using the Processing Programming Environment. The frames were then composited on Adobe After Effects and Maya.
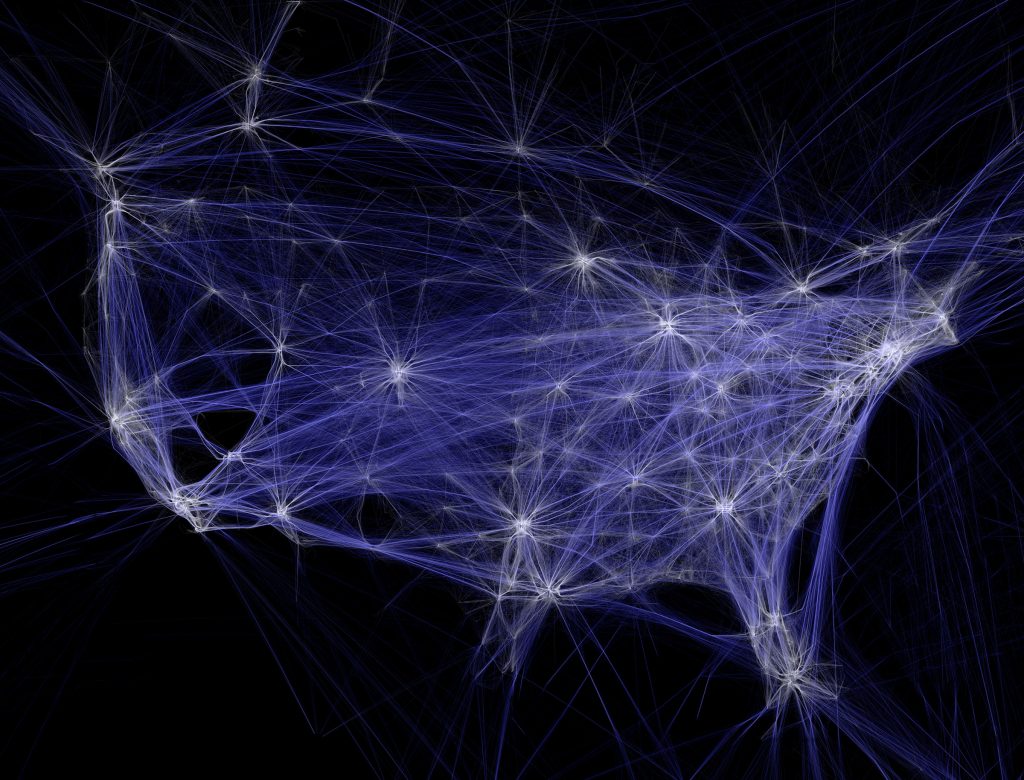
I admire the artist’s ability to convey so much information through the different variations and avoids overcrowding the piece. Each element provides a new detail, the brightness increases as flight density increases, color represents type of aircrafts and altitude. I also admire the way he is able to create visual interest out of mundane data; each flight pattern looks like a mini firework.
The creator’s artistic sensibilities manifest in the final form through the story the piece tells. In Koblin’s Ted Talk he talks about how collecting data can make us more human and how he humanizes data through his work. For example, with this specific piece, you can see when people depending on their region are the busiest based on how bright that part of the piece is.