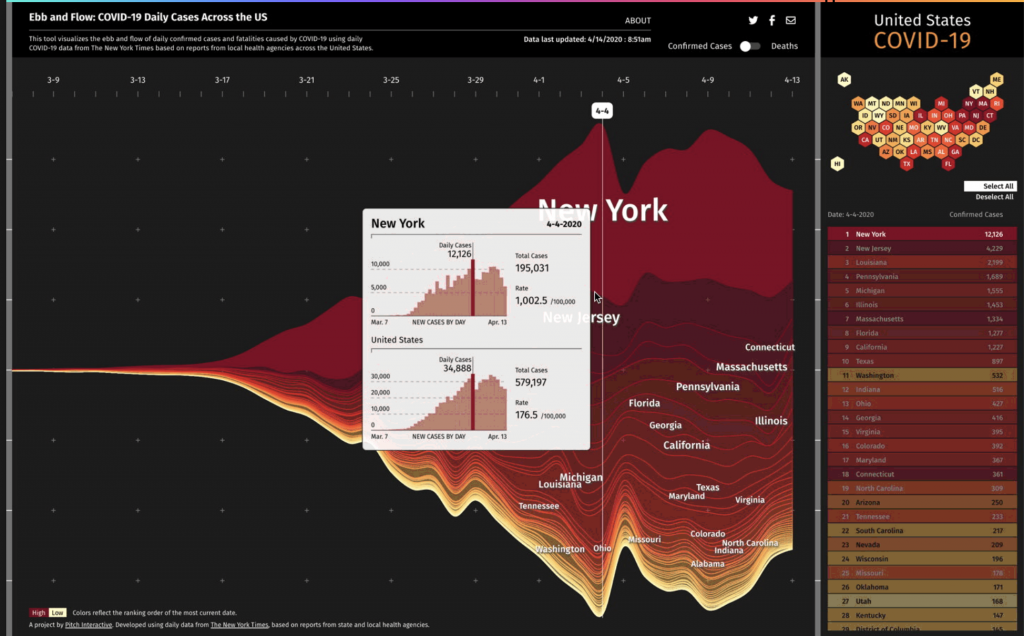
For this week’s exploration of data visualization I picked Ebb and Flow and I am particularly going to look at their project for Pitch Interactive Inc called “Covid-19 Daily Cases Across the US”.

I really admire this tool because I feel like this is a great example of when data visualization is needed the most. It is an important tool for educating the public in a clear way especially when stress is high and misinformation is rampant. This project started while the concept of flattening the curve was spreading.
This graph uses the steam graph methodology and the data was extracted from the New York Times. This graph allows you to look at certain states and be able to compare them. The y-axis shows confirmed cases and deaths and the x-axis represents time starting March 7th.
Overall, I think this tool is very cool because it seems like this tool is constantly evolving even while the pandemic is currently winding down in the US. I think visualizations like this are so important and I think this team did really well at making it clear and concise while also informational.
![[OLD SEMESTER] 15-104 • Introduction to Computing for Creative Practice](https://courses.ideate.cmu.edu/15-104/f2021/wp-content/uploads/2023/09/stop-banner.png)