![[OLD SEMESTER] 15-104 • Introduction to Computing for Creative Practice](https://courses.ideate.cmu.edu/15-104/f2021/wp-content/uploads/2023/09/stop-banner.png)
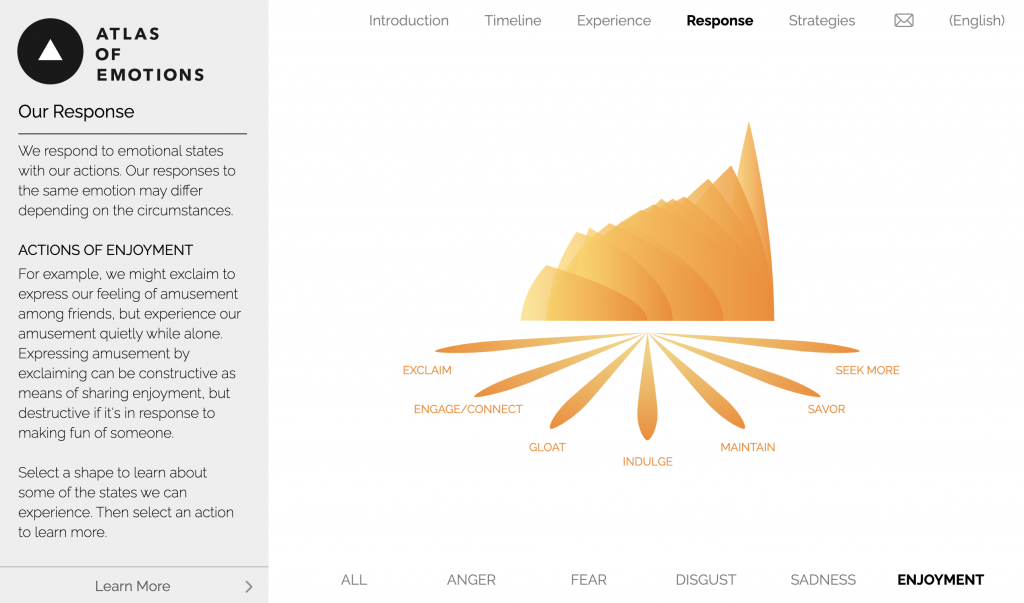
This Data Visualization, by the group Stamen Design, is a visualization of the atlas of human emotions, designed for the Dalai Lama and scientist Dr. Paul Ekman. It features scholarly findings about emotions and maps it into a series of graphs and interactions on their live website, which brings in different factors such as emotions, triggers, and responses to map how different triggers may cause different emotions in us. For the data itself, the studio and Ekamn conducted a peer-reviewed study among other emotion-studying scientists called “What Scientists Who Study Emotion Agree About,” from which they derived that five emotions in particular are considered and widely acknowledged as universal regardless of culture: anger, fear, sadness, disgust, and enjoyment. I admire that the project uses computation and code to map something so human, visceral, and natural as emotions themselves, and I particularly enjoy the way they graphed the different states of emotions from least to most intense, using shapes, colors, and line qualities that help visualize the emotions themselves, which also point to the design studio’s artistic sensibilities beyond simply plotting data points.