Project 7: Composition with Curves

sketch

var x1;
var y1;
var x;
var y;
var a;
var t;
var r;
var g;
var b;
var bcolor;

function setup() {
    createCanvas(480, 480);
    let j = 700
    while (j > 0) {
        strokeWeight(0);
        j = j - 10
        bcolor = map(j, 700, 0, 0, 255);
        fill(bcolor);
        circle(240, 240, j);
    }
}

function draw() {
    stroke(r, g, b);
    strokeWeight(3);
    beginShape();
    for (var i = 0; i < 100; i++) {
        a = map(mouseX, 0, 480, 0, 100);
        t = map(mouseY, 0, 480, 0, 100);
        x1 = a * sin(t);
        y1 = a * sin(t) * cos(t);
        x = 240 + x1 * -1
        y = 240 + y1 * -1
        vertex(x, y);
        print(y);
    }
    endShape(CLOSE);
}

function mousePressed() {
    r = random(0, 255);
    g = random(0, 255);
    b = random(0, 255);
}

As I started working on this project, I wanted the viewer to be able to “draw” the curves themselves. As MouseX changes, the size of the curve changes. As MouseY changes, different points are added on the curve. When the canvas is clicked, the color of the points change. If you manipulate the mouse in a certain way, you can make concentric figure 8s of varying colors. When I finished coding the curves and their mouse interaction, it still felt a little bland, so I added a circular gradient to the background to focus the eye gaze on the center of the canvas.

Project – Cardioid Visualization

sketch
//Brandon Yi
//btyi@andrew.cmu.edu
//Section A

// Cardioid Function

var points = 200; // number of points on circle
var rate; // coefficient
var r = 180; // radius of big circle
var count = 0;

function setup(){
  createCanvas(400, 400);
  frameRate(200);
  rate = 2;
}

function draw() {
  //basic settings 
  background(0);
  translate(width/2, height/2);

  //  Large White Circle
  stroke(255);
  fill(0);
  ellipse(0, 0 , r * 2, r * 2);

  // drawing lines based on cardioid shape 

  for(var i = 0; i < count; i++){

    var x = r * cos(i * TWO_PI/points);
    var y = r * sin(i * TWO_PI/points);

    var x2 = r * cos(i*rate * TWO_PI/points);
    var y2 = r * sin(i*rate * TWO_PI/points);

    //color gradient based on rate

    if (rate % 3 == 0) {
      stroke(i, 0, 255-i);
    }

    else if (rate%3 == 1) {
      stroke(0, i, 255-i);
    }

    else {
      stroke(i, 255-i, 0);
    }
    // drawing line
    line(x, y, x2, y2);
  }  

  //counter increases until count of 200 lines
  if(count <= points) {
    count += 1;
    frameRate(200);
  }

  //counter hits 200 -- cardioid coefficient increases + counter reset
  else {
    rate++;
    count = 0;
  }

  // coefficient reset
  if (rate >= 12) {
    rate = 2;
  }

  // brief pause 
  if(count == points) {
    frameRate(1);
  }

  
}

I wanted to combine what we did with the line drawings and the new curves that we were trying to draw. Though it took some thinking, I think my project turned out really well.

Project-7: Composition with Curves

My Project

//cbtruong;
//Section B;

//sets up the variables for stroke color;
//col is the stroke color for smooth conical spiral;
//col2 is the stroke color for the rough conical spiral;
var col = 0;
var col2 = 0;
//sets up the variable for angl to allow for rotation;
var angl = 0;
//sets up the variable for the shifting fill color value;
//for the rough conical spiral;
var shiftingVal = 100;
//sets up the variable that allows for reversing the change;
//of shiftingVal;
var shiftingValChange = 1;


function setup() {
    createCanvas(480, 480);
    background(220);
    text("p5.js vers 0.9.0 test.", 10, 15);
}

function draw() {
    background(220);
    stroke(0);
    //diagonal lines that hit the center of the spirals;
    line(0, 0, 120, 120);
    line(0, 480, 120, 360);
    line(480, 0, 360, 120);
    line(480, 480, 360, 360);
    //lines that outline the perimeter of the canvas;
    line(0, 0, 480, 0);
    line(0, 0, 0, 480);
    line(480, 0, 480, 480);
    line(0, 480, 480, 480);
    //lines of the innerbox whose vertices are the spiral centers;
    line(120, 120, 120, 360);
    line(120, 360, 360, 360);
    line(360, 360, 360, 120);
    line(360, 120, 120, 120);

    //draws the middle, rough concial spiral;
    strokeWeight(2);
    fill(shiftingVal);
    stroke(col2);
    push();
    translate(240, 240);
    conicalSpiralTopViewRough();
    pop();
    
    //draws the 4 smooth rotating conical spirals;
    noFill();
    stroke(col);
    for (var i = 120; i <= 360; i += 240){
        for (var j = 120; j <= 360; j += 240){
            push();
            translate(j, i);
            rotate(radians(angl));
            scale(0.5);
            conicalSpiralTopViewSmooth();
            pop();
        }
    }

    //checks if the shiftingVal is too high or low;
    //if too high, the fill becomes darker;
    //if too low, the fill becomes ligher;
    if (shiftingVal >= 255){
        shiftingValChange = shiftingValChange * -1;
    }
    else if (shiftingVal < 100){
        shiftingValChange = shiftingValChange * -1;
    }
    //changes the shiftingVal;
    shiftingVal += 1*shiftingValChange;
    //changes the angle and allows for rotation;
    //of the smooth conical spirals;
    angl += 0.1;
    

}

//function that creates the smooth conical spirals;
function conicalSpiralTopViewSmooth() {
    //variables for h, height; a, angle; r, radius;
    var h = 1;
    var a;
    var r = 30;
    
    //adds interactivity;
    //as one goes right, the size of the spiral increases;
    //as one goes down, the complexity of the spiral increases;
    var indepChangeX = map(mouseX, 0, 480, 500, 1000);
    var indepChangeY = map(mouseY, 0, 480, 800, 1000);
    a = indepChangeY;

    //actually creates the spiral;
    beginShape();
    for (var i = 0; i < indepChangeX; i++){
        var z = map(i, 0, 400, 0, PI);
        x = ((h - z) / h)*r*cos(radians(a*z));
        y = ((h - z) / h)*r*sin(radians(a*z));
        vertex(x, y);
    }
    endShape(CLOSE);

}

//function that creates the rough middle conical spiral;
function conicalSpiralTopViewRough() {
    //variables are the same as the smoothSpiral function;
    var h = 0.5;
    var a = 1000;
    var r;
    
    //adds interactivity;
    //the radius is now dependant on mouseY, going up increases size;
    //going left increases complexity;
    r = map(mouseY, 0, 480, 20, 10);
    var edgeNum = map(mouseX, 0, 480, 60, 30);
    
    //creates the spiral;
    beginShape();
    for (var i = 0; i < edgeNum; i++){
        var z = map(i, 0, 50, 0, TWO_PI);
        x = ((h - z) / h)*r*cos(radians(a*z));
        y = ((h - z) / h)*r*sin(radians(a*z));
        vertex(x, y);
    }
    endShape();
}

//mousePressed function that changes the variables col and col2;
//with random values of r, g, and b;
function mousePressed() {
    var randR = random(150);
    var randG = random(150);
    var randB = random(150);
    col = color(randR, randG, randB);
    col2 = color(randR + random(-50, 50), randG + random(-50, 50), randB + random(-50, 50));
}

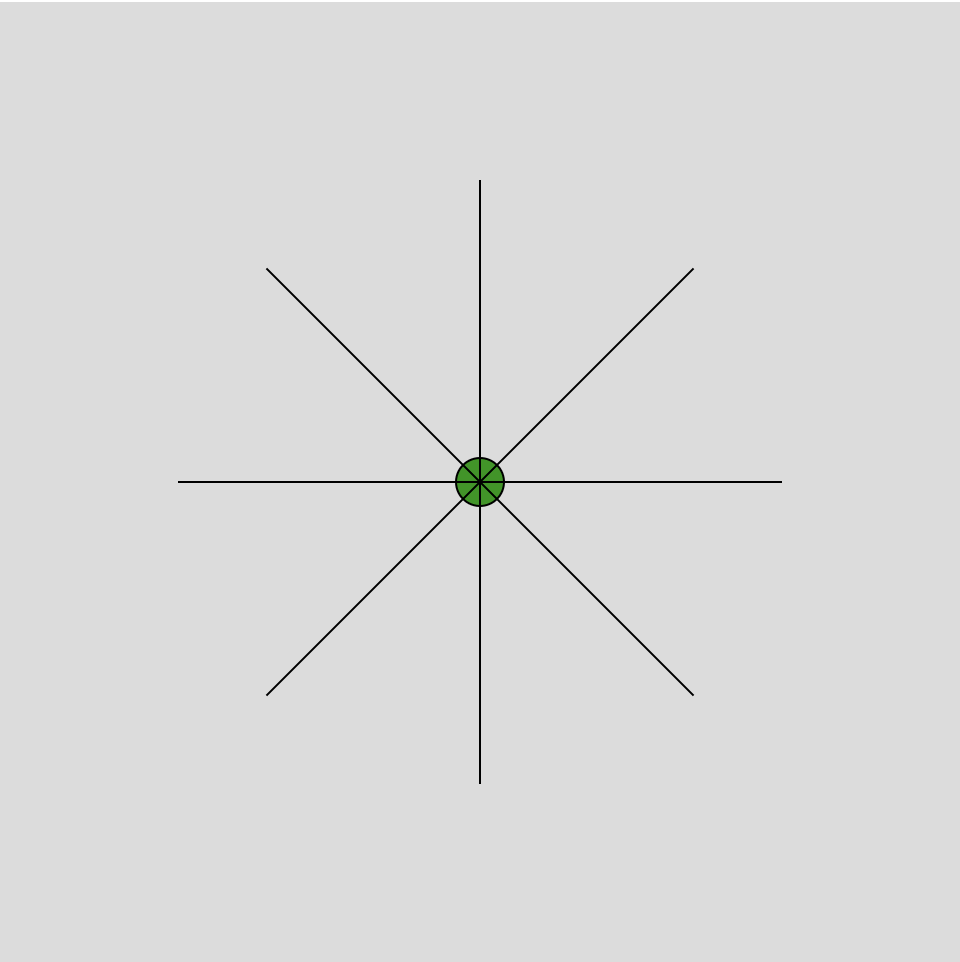
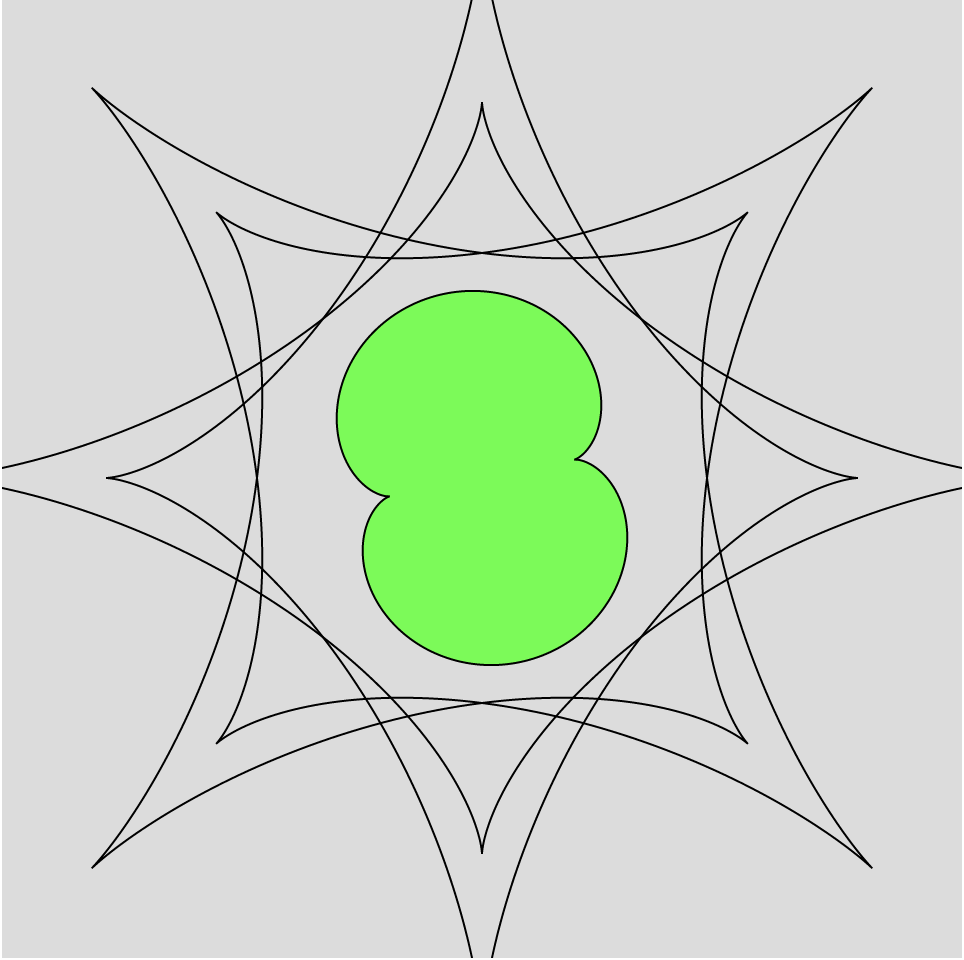
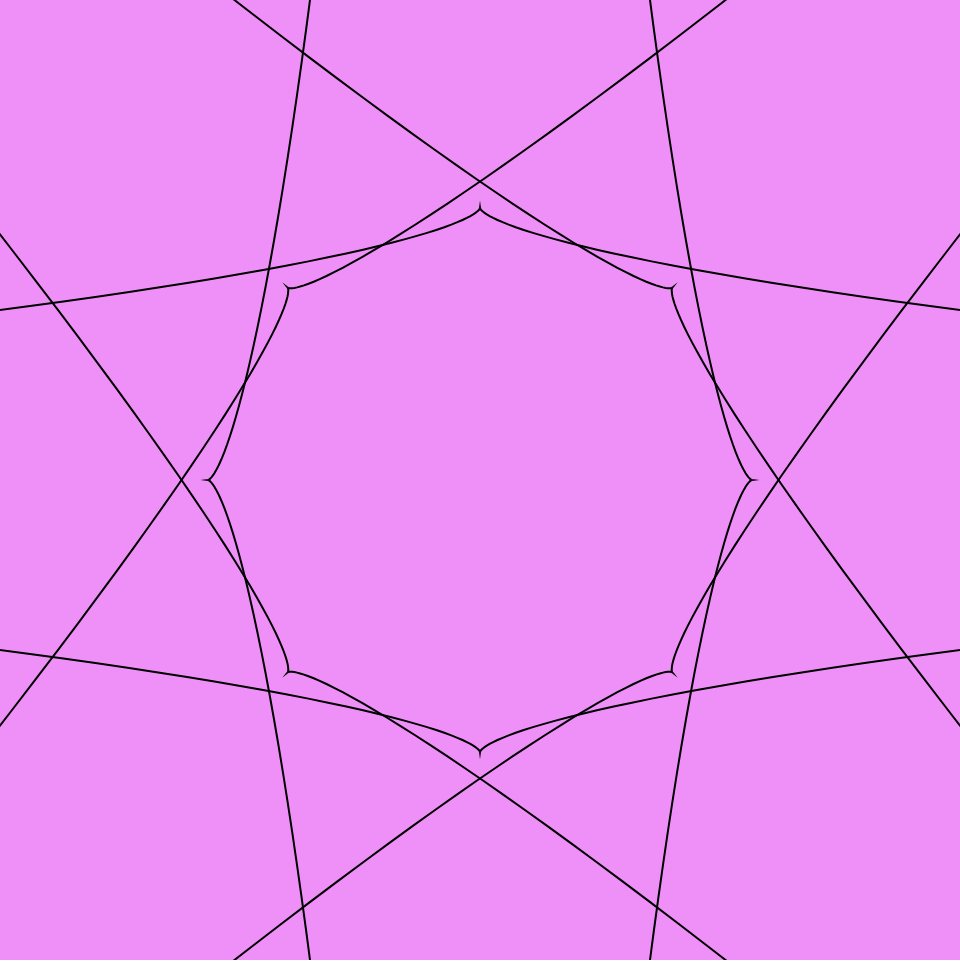
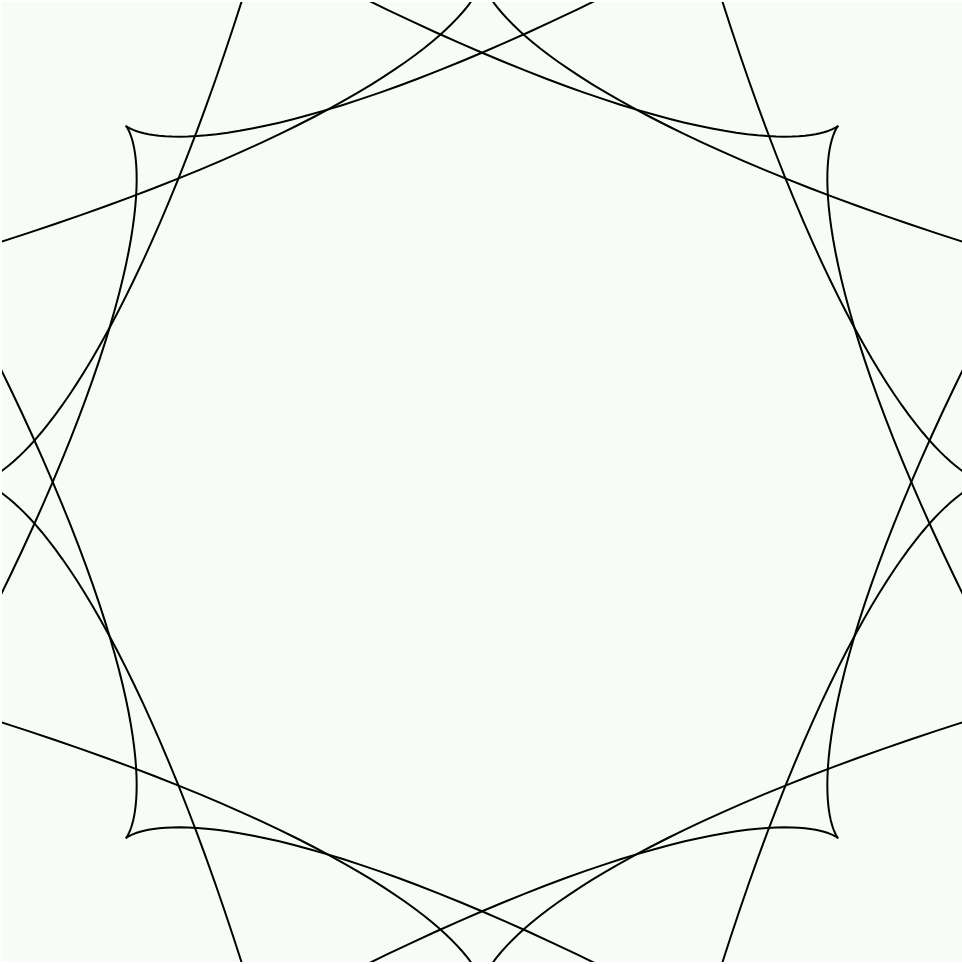
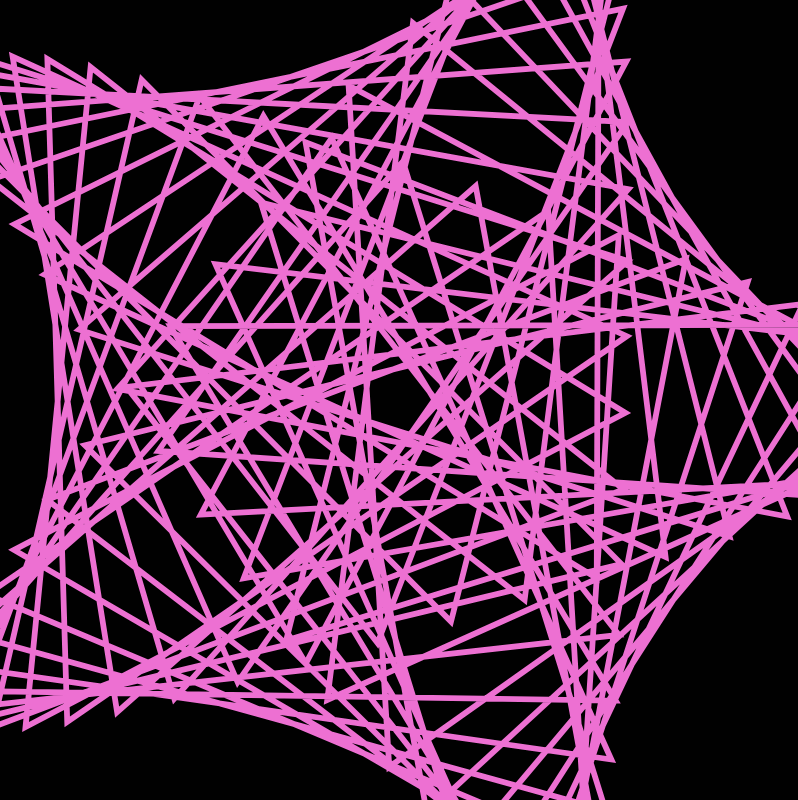
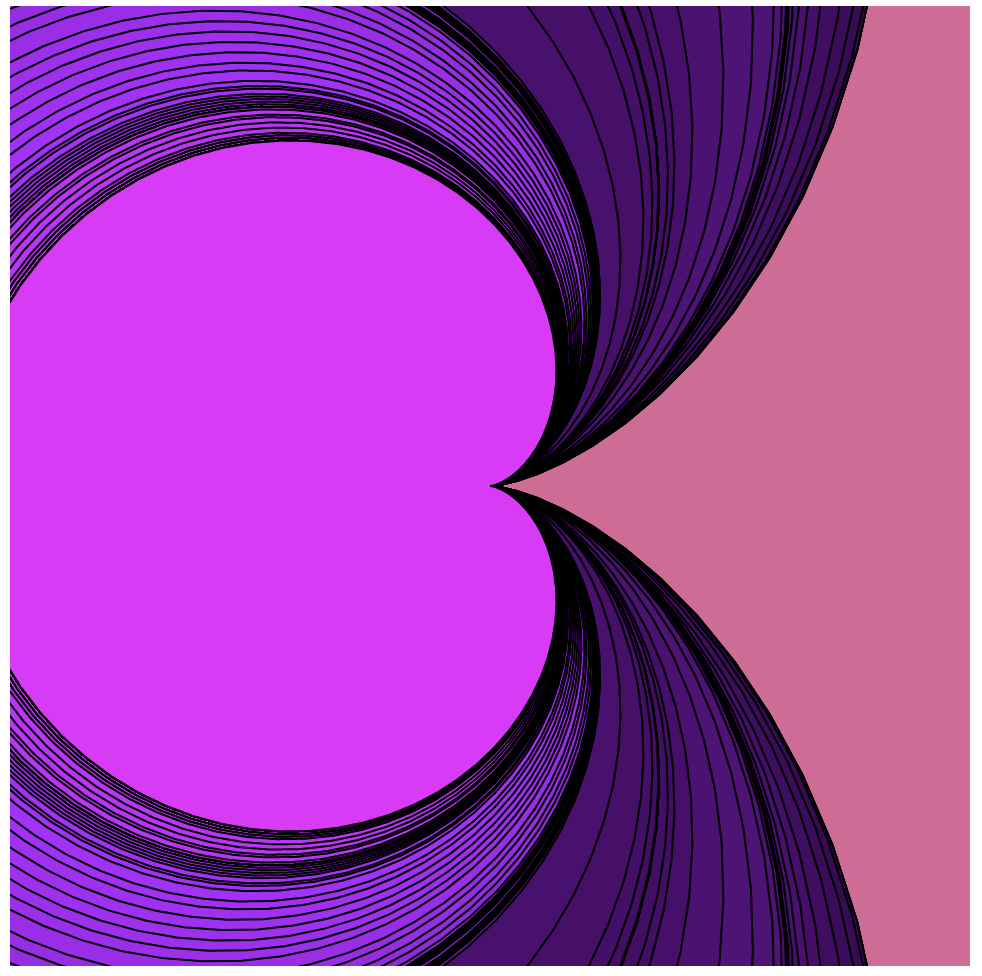
I initially had no idea what to make in terms of curves. That was until I happened upon the Conical Spiral. It was supposed to be 3-D, but it ended up as a top down view of a spiral which I liked. Overall, I liked what I did with this Project.

As for how it works, clicking the mouse will change the colors of the middle “rough” Conical Spiral and the 4 “smooth” Conical Spirals. The colors of both types are similar but not the same, as seen with the use of random() in the code.

Along with that, moving the mouse right will increase the size of the “smooth” Spirals and reduce the size and complexity of the “rough” Spiral. Moving left does the opposite. Moving down increases the complexity of the “smooth” Spirals while also reducing the size of them and the “rough” Spiral.

Project 07: Composition with Curves

sketch
//Christy Zo
//Section C

var nPoints = 400;
function setup() {
    createCanvas(480, 480);
}

function draw() {
    background(220);
    push();
    translate(width / 2, height / 2);
    drawEpitrochoidCurve();
    pop();
    push();
    translate(width / 2, height / 2);
    drawEpicycloidCurve();
    pop();
    push();
    translate(width / 2, height / 2);
    rotate(radians(90)); //rotating Epicycloid to create a radial pattern
    drawEpicycloidCurve();
    pop();
    push();
    translate(width / 2, height / 2);
    rotate(radians(45));
    drawEpicycloidCurve();
    pop();
    push();
    translate(width / 2, height / 2);
    rotate(radians(135));
    drawEpicycloidCurve();
    pop();


}

function drawEpicycloidCurve() {
    // Epicycloid:
    // http://mathworld.wolfram.com/Epicycloid.html
    
    var x;
    var y;
    
    var a = constrain(mouseY,0, height);
    var b = constrain(mouseX, 0, width);
    //var h = constrain(mouseY / 8.0, 0, b);
    //var ph = mouseX / 50.0;
    noFill();
    stroke(0);
    beginShape();
    for (var i = 0; i < nPoints; i++) {
        var t = map(i, 0, nPoints, 0, TWO_PI);
        
        x = 4 * b * cos (t)* cos (t)* cos (t);
        y = a * sin (t) *sin (t)* sin (t);
        
      vertex(x, y);
    }
    endShape(CLOSE);

}

function drawEpitrochoidCurve() {
    // Epicycloid:
    // http://mathworld.wolfram.com/Epitrochoid.html
    
    var x;
    var y;
    
    var a = mouseX;
    var b = a / 2.0;
    var h = constrain(mouseY / 8.0, 0, b);
    var ph = mouseX / 120.0;
    
    fill(mouseX, mouseY, mouseX);
    beginShape();
    for (var i = 0; i < nPoints; i++) {
        var t = map(i, 0, nPoints, 0, TWO_PI);
        
        x = (a + b) * cos(t) - h * cos(ph + t * (a + b) / b);
        y = (a + b) * sin(t) - h * sin(ph + t * (a + b) / b);
        vertex(x, y);
    }
    endShape(CLOSE);
    
}

In this project, I wanted to create something that not only shows horizontal and vertical change, but something that goes diagonally too. I was inspired by how stars twinkle and their strokes/beams of light reduce and increase as it sparkles.

Free Drawings Of Stars Download Free Clip Art Free - Christmas Star  Coloring Page - Png Download - Full Size Clipart (#267769) - PinClipart
sample image of star

snippets of code:

As the cranioid in the center increases in size, the color changes from black-green-pink-white in a gradual scale.

Project 07 Curves

When I saw the bean curve on the website, I knew i had to do it since it was pretty cute. After coding it in, I realized my bean did not look like a bean, and it turns out its becuase I had to be careful translating the math equations in way that the code would understand. After, I figured it out, I realized just drawing one bean was too simple, so I had to draw alot of them. Taking inspiration from the spots on canvas example, I was able to create the project below.

sketch
var ex = [];
var ey = [];
var points = 100;

function setup() {
    createCanvas(480, 480);
    frameRate(10);
    text("p5.js vers 0.9.0 test.", 10, 15);
}

function draw() {
//Picked the bean curve to do the project 
background("green");
//translate(width/2,height/2);
for (var i = 0; i < ex.length; i++){
  push();
  translate(ex[i], ey[i]);
  drawBeanCurve();
  pop();
}
}

function mousePressed(){
  ex.push(mouseX);
  ey.push(mouseY);
}

function drawBeanCurve(){
  var x;
  var y;
  var a = mouseX;
  var t = mouseY;
  fill("purple");
  beginShape();
  for (var i = 0; i < points; i++){
    t = map(i,0,points,0,TWO_PI);
    x = a*(cos(t)*((sin(t)**3)+(cos(t)**3)));
    y = a*(sin(t)*((sin(t)**3)+(cos(t)**3)));
    vertex(x,y);
  }
  endShape(CLOSE);
}

Project 07: Composition with Curves

sketchDownload
// This program displays a grid of Epitrochoid curves with increasing nPoints and cusps.
// The canvas sets up with a 5x5 grid; 
// When the mouse is pressed, more curves are drawn.
// Pressing the spacebar deletes one row and column. 

var c;				// color 
var density = 5;	// number of curves in each row and column
var nPoints;		// number of points used to draw each curve
var cusp;			// number of cusps on each curve
var mode = 0		// default mode uses Epitrochoid formula, other mode uses an edited Epitrochoid-like formula

function setup() {
    createCanvas(480, 480);
}

function draw() {
	background(200, 200, 255);
	// draw a grid of curves based on density value:
	for (var k=0; k<density; k++) {
		cusp = k+1;							// number of cusps increases from left to right
		for (var j=0; j<density; j++) {
			push();
			translate(k*width/density+240/density, 	// keeps grid centered regardless of density changes
					  j*height/density+240/density);	
			nPoints = (j+1)*density			// number of nPoints increases from top to bottom
		
        	//color based on grid and mouse location:
			let r = map(j, 0, density, 0, 255);
			let g = map(k, 0, density, 0, 255);
			let b = map(mouseX, 0, width, 0, 255);
			c = color(r, g, b);
			
			// check which mode we are in and draw curves:
			if (mode == 0) {drawEpitrochoidCurve(nPoints, cusp, c)}
			else {drawEpitrochoidyCurve(nPoints, cusp, c)}
			pop();
		}
	}
	// labeling for easier understanding of the grid pattern:
	textFont('monospace');
	text('click mouse for more curves,	press spacebar for fewer curves', 20, height-12);
	text('press "w" for weird curves,	press "r" for default curves', 20, height-3);
	text('n u m b e r		o f		c u s p s   ----- >', 5, 10);
	text('n P o i n t s', 5, 30, 1, 150);
	push(); 
	rotate(radians(90));
	text('----- >', 140, -5);
	pop();
	

}

// code adapted from sample in project description:
function drawEpitrochoidCurve(nPoints, cusp, color) {
    // Epitrochoid:
	//https://mathworld.wolfram.com/Epitrochoid.html
	
    var x;
    var y;

	var a = 15;
    var b = a / cusp;
    var h = map(mouseY/8, 0, height, 0, a*5);
    var ph = -mouseX / 40;
    
    fill(color);

	// shape of curve:
    beginShape();
    for (var i = 0; i < nPoints; i++) {
        var t = map(i, 0, nPoints, 0, TWO_PI);
        
        x = (a + b) * cos(t) - h * cos(ph + t * (a + b) / b);
        y = (a + b) * sin(t) - h * sin(ph + t * (a + b) / b);
        vertex(x, y);
    }
    endShape(CLOSE);
}

// code adapted from sample in project description and edited further:
// these curves do not interact with mouseY:
function drawEpitrochoidyCurve(nPoints, cusp, color) {
    // Epitrochoidy: not quite an Epitrochoid, but follows a very similar formula
	
    var x;
    var y;

	var a = 15;
    var b = a / cusp;
    var ph = -mouseX / 40;
    
    fill(color);

	// shape of curve:
    beginShape();
    for (var i = 0; i < nPoints; i++) {
        var t = map(i, 0, nPoints, 0, TWO_PI);
        
        x = (a + b) * cos(t) * cos(ph + t * (a + b) / b);
        y = (a + b) * sin(t) * sin(ph + t * (a + b) / b);
        vertex(x, y);
    }
    endShape(CLOSE);
}

// add one more row and column each time the mouse is pressed:
function mousePressed() {
	density +=1;
}

//delete a row and column when the SPACEBAR is pressed:
function keyPressed() {
	if (keyCode == 32) { 
		if (density == 0) {density = density }		// dont let density variable go below 0
		else {density -= 1 }
	}
	if (keyCode == 87) { 
		if (mode == 0) {mode = 1}		// pressing 'w' switches to 'weird' mode
	}
	if (keyCode == 82) { 
		if (mode == 1) {mode = 0}		// pressing 'r' switches back to default 'regular' mode
	}
}

After deciding to use the Epitrochoid curve formula, I realized that the sample in our project description is a very similar curve. Using the sample formula, I adapted the code until I liked what was being drawn on the canvas. Then I made a grid of curves and built them using various nPoint values and cusp values. As you can see in the drawing, as the curves are drawn from left to right, there are more cusps; and as they are drawn from top to bottom, there are more nPoints. Similarly to the sample code, my project uses mouseX and mouseY to interact with the angle and width of the curves. Additionally, the mouseX and mouseX variables are used to determine the fill color of each curve. When the mouse is clicked, the grid gets denser; when the spacebar is pressed, the density decreases. After playing around with the formula, I decided that I also wanted to include a mode for Epitrochoid-like curves that are not technically following the Epitrochoid formula. If you press ‘w’, the ‘weird’ mode turns on and the curves look strange and interesting. Pressing the ‘r’ key puts the program back into the default ‘regular’ mode. Below are a few screen shots that document some of my proccess:

Project 07: Composition with Curves

curves
var points = 100;

function setup() {
    createCanvas(400, 400);
}

function draw() {    
    background(map(mouseX, 0, width, 50, 0)); // background color goes from grey -> black as mouse moves to the right
    translate(width/2, height/2); // move origin to center
    hypotrochoid(); // draw the curve   
}

function hypotrochoid() {
    // https://mathworld.wolfram.com/Hypotrochoid.html
    var x; 
    var y;
    var a = map(mouseX, 0, width, 50, 80); // radius of fixed circle
    var b = map(mouseY, 0, height, 0.1, 1); // radius of circle rolling around fixed circle
    var h = mouseX/2; // distance from center of interior circle
    strokeWeight(map(mouseX, 0, width, 0.1, 3)); // stroke weight increases as mouse moves to the right
    stroke(mouseX, 100, mouseY);
    noFill();
    beginShape();
    for (var i = 0; i <= points; i ++) {
        var t = map(i, 0, points, 0, TWO_PI);
        x = (a - b) * cos(t) + (h * cos(((a - b)/b) * t));
        y = (a - b) * sin(t) - (h * sin(((a - b)/b) * t));
        vertex(x, y);
    }
    endShape();
}


I started the project by just browsing all the different curves in mathworld and coding them to see how they look on the canvas. I ended up settling on the Hypotrochoid curve. The sample curve on the website actually didn’t seem very interesting, but once I allowed the parameters to change based on the mouse’s position, the curve had a lot more details and got much more complicated. It was quite incredible to see how the curve changes as the mouse cross the canvas. Here are some screenshots of the different looks:

The changes are quite drastic, so it’s interesting that they were all produced by the same equation.

Project 7

sketch
var nPoints = 500
function setup() {
    createCanvas(400, 400);
    background(220);
    text("p5.js vers 0.9.0 test.", 10, 15);
    frameRate(100)
}
function draw() {
    //background color varies with mouse X and mouse Y
    background(map(mouseX,0,width,0,144),map(mouseY,0,width,0,122),255)
    translate(25,25)

    //draw the 16 devil's curves
    for (x = 25; x < width; x += 100){
        for (y = 25; y < height; y += 100){
            push()
            translate(x,y)
            drawDevilCurve()
            pop()
        }
    }
}
function drawDevilCurve(){
    //Devil's Curve
    //https://mathworld.wolfram.com/DevilsCurve.html

    var x;
    var y;
    var a = mouseX/15;
    var b = constrain(mouseY/5, 0, a*100);
    fill(max(min(0,width),mouseX/2),max(min(0,width),mouseY/2),255);
    beginShape();
    for (var i = 0; i < nPoints; i++) {
        var t = map(i, 0, nPoints, 0, TWO_PI);
        x = cos(t) * sqrt((sq(a) * sq(sin(t)) - sq(b) * sq(cos(t))) / (sq(sin(t)) - sq(cos(t))));
        y = sin(t) * sqrt((sq(a) * sq(sin(t)) - sq(b) * sq(cos(t))) / (sq(sin(t)) - sq(cos(t))));
        vertex(x, y);
    }
    endShape(CLOSE);
}

I used Devil’s curve because i was intrigued by its name, and the demonstration of devil’s curve on the website is really fancy so i wanted to try it out. I made one devil’s curve first, and played with how the mouse would affect the shape of it. After having that one devil’s curve, i thought that i might be able to make a kaleidoscope using devil’s curves. So I wrote an for loop, and I changed the mouse X mouseYs to make sure that there would be significant changes when we move mouse X and mouse Y no matter where the mouse is ( i’m saying this because previously some manipulations of mouse X and mouse Y may not greatly impact the picture).

Project 07: Curves

sketch
//Anthony Pan
//Section C

//Cardioid Curve Interaction
//polar coordinate equation r = a*(1-cos(theta))
//parametric equation
    //x = a * cos(t) * (1 - cos(t))
    //y = a * sin(t) * (1 - cos(t))
//mouseX change colors
//mouseY changes how many are drawn


function setup() {
    createCanvas(480, 480);
    background(220, 100, 150);
}

function draw() {
    //var x1 = 0
    //var y1 = 0

    push();
    //drawRect(x1,y1); //draw another shape
    translate(width/2, height/2);
    drawCardioidCurve();
}


function drawCardioidCurve() {
    var x;
    var y;

    var a = 80;
    var h = mouseX; //mouseX interaction
    var h1 = map(mouseY, 0, 480, 0, 256); //mouseY interaction

    fill((h1 * 0.7)%256, 0, h1);
    beginShape();
    for(var i = 0; i < 101; i++) {
        var theta = map(i, 0, 101, 0, TWO_PI);

        x = (h + a) * cos(theta) * (1 - cos(theta));
        y = (h + a) * sin(theta) * (1 - cos(theta));
        vertex(x, y);
    }
    endShape(CLOSE);
}

For this project, I wanted to create a curve that would be drawn multiple times as the user moved mouseX. I chose to create a heart using the cardioid function and chose purple/pink as my color for the heart. I wanted it to feel like you were drawing hearts repeatedly that would change color and dimensions based on the mouseX and Y positions.

For the process, I did something very similar to the technical assignment this week, utilizing an equation to draw the different points on the curve rather than the noise function.

Curves

I decided to chose the Devil’s Curve for my project, mostly because I liked the way it looked. It was very hard at first because I have not been in a math class in years, to figure out what each part of my equations did. At first I had a problem where my signs were wrong and only had the crunode show up.

bad ()s
more bad ()s

I got stuck for a bit, but the project seemed simpler than I thought at first. To better understand and to play around with my curve to figure out how I should have it move, I was able to find an example of the curve and move it’s a and b points on desmos. One thing I had already accidentally realized was that if a and b were equal they would make a circle and if a/b was more or less than one rotated the crunode. I thought these properties were interesting so I wanted to attach my b value and a values to movements so that they would be able to both equal each other and be more than and less than. Doing this also allowed my curve to grow and shrink.

The code works so so that mouseX and Y control a and b. They do the same thing to the numbers but depending on the position of the mouse on the page it controls rotation of the crunode and size.

file

//Georgia Miller
//Section D
//15-104

nPoints = 400;
function setup() {
    createCanvas(400, 400);
    frameRate(10);
}

function draw() {
    background(255, 204, 255);
    push();
    translate(width / 2, height / 2);
    drawDevilsCurve();
}

function drawDevilsCurve(){
    //https://mathworld.wolfram.com/DevilsCurve.html
    var x;
    var y;
    var a = 40;
    var b = a * 1.75;
    var h = mouseY / 2 ; // up and down to change crunode
    //this particular curve changes orientation based on if a/b is bigger or larger than 1
    var ph = mouseX / 2; // move mouse to right to grow

    stroke(255, 0, 127);
    strokeWeight(3);
    fill(153, 153, 255);

    beginShape();
    for (var i = 0; i < nPoints; i++){
        var t = map(i, 0, nPoints, 0, TWO_PI); //t = theta
        x = cos(t) * sqrt((pow(a + ph, 2) * pow(sin(t), 2) 
         - pow(b + h * 2, 2) * pow(cos(t), 2)) / (pow(sin(t), 2) - pow(cos(t), 2)));
        y = sin(t) * sqrt((pow(a + ph, 2) * pow(sin(t), 2)
         - pow(b + h * 2, 2) * pow(cos(t), 2)) / (pow(sin(t), 2) - pow(cos(t), 2)));
        vertex(x, y);
    }
    endShape(CLOSE);
}