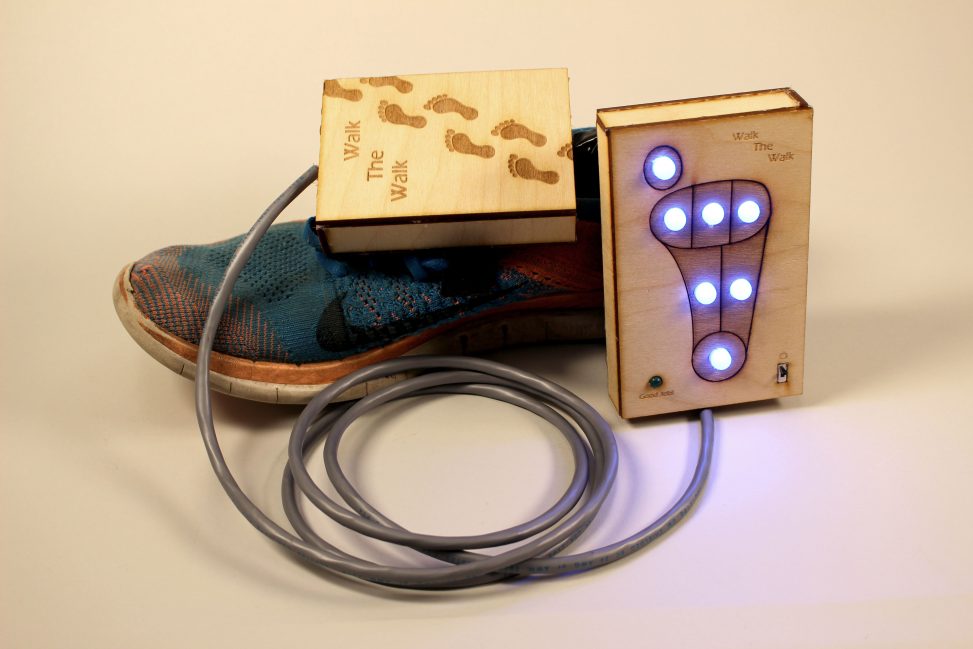
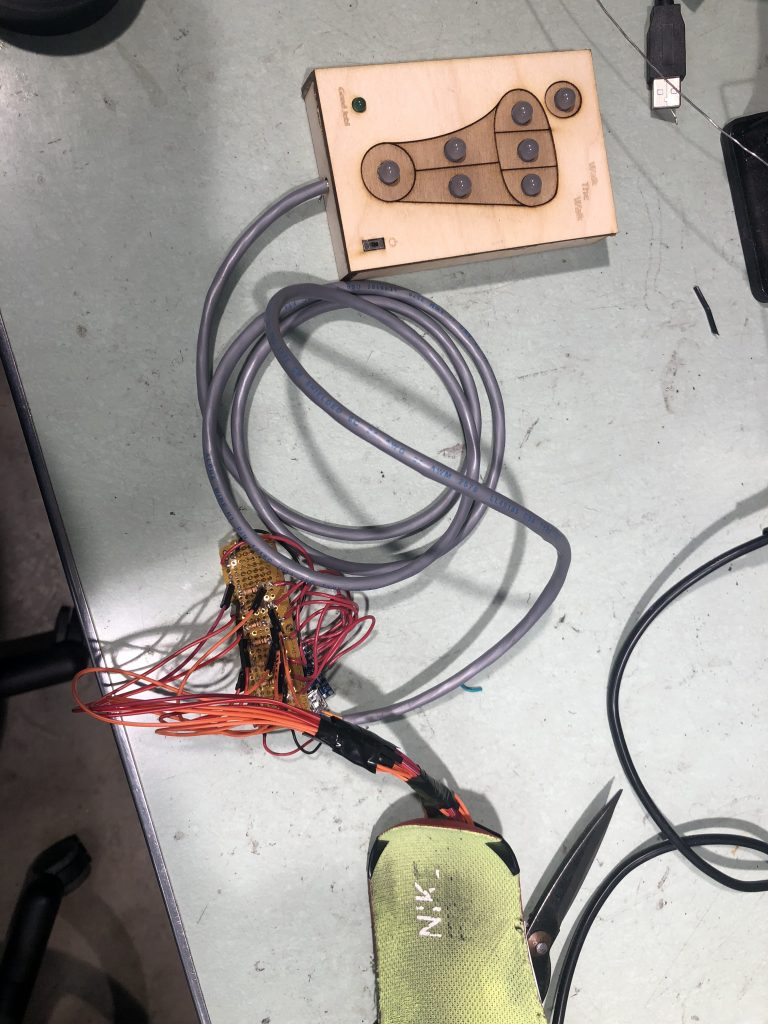
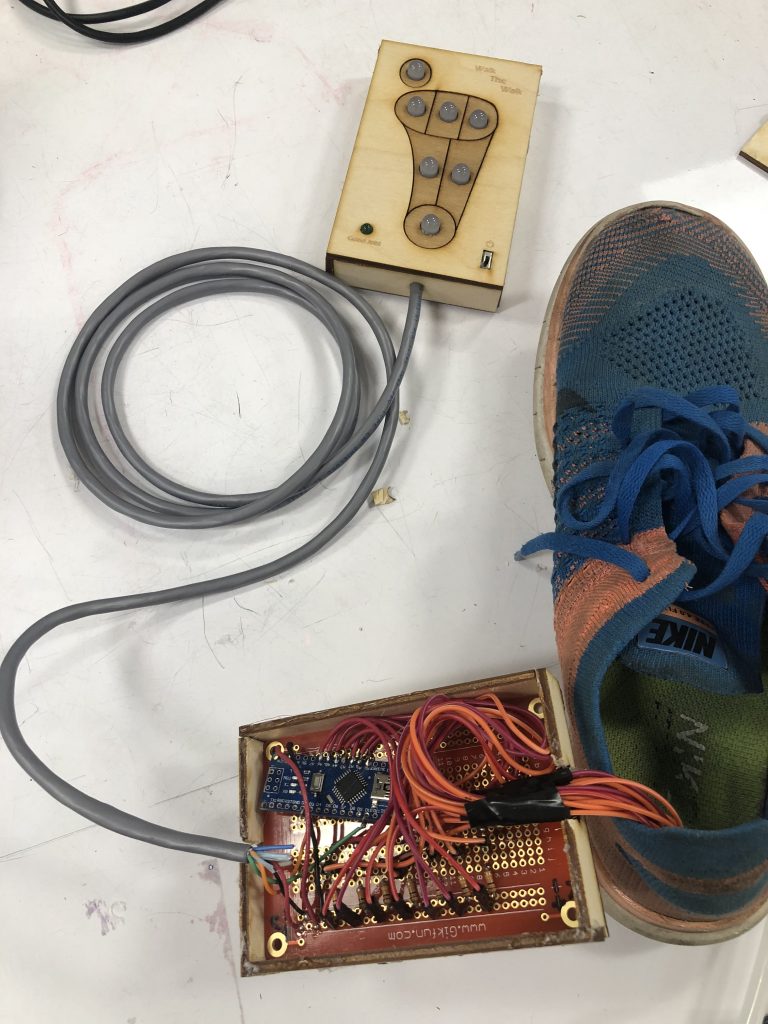
An overall shot of how the device would be used with the handheld display device, the anklet and the sensors in the shoe.
Narrative
This project uses 7 pressure sensors in strategic locations in a shoe to visually display the pressure distribution someone puts on their feet. The pressure is displayed using corresponding LEDs to map out the color based on the amount of pressure. Also, if the correct pressure distribution is reached, then a green LED lights up.
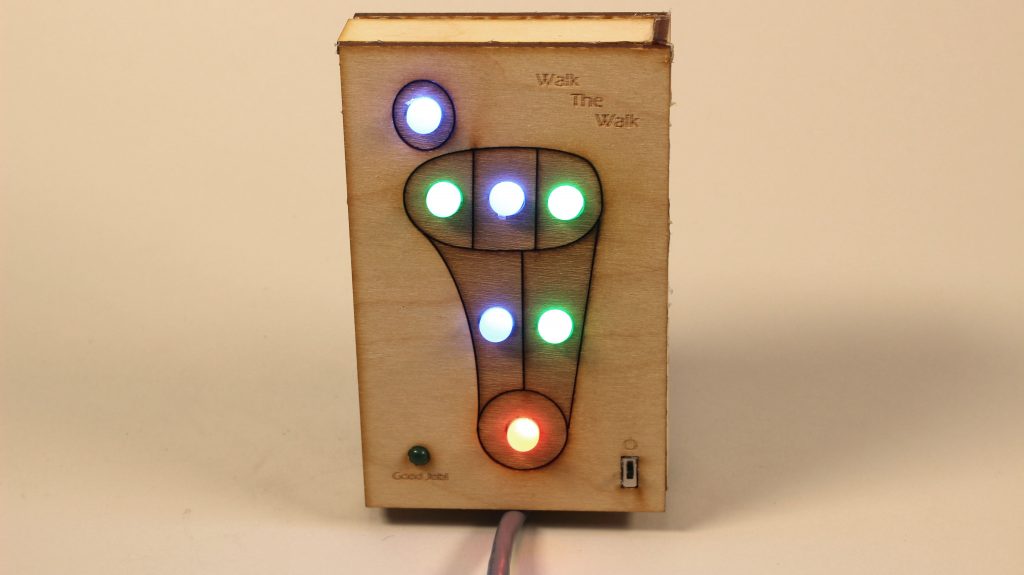
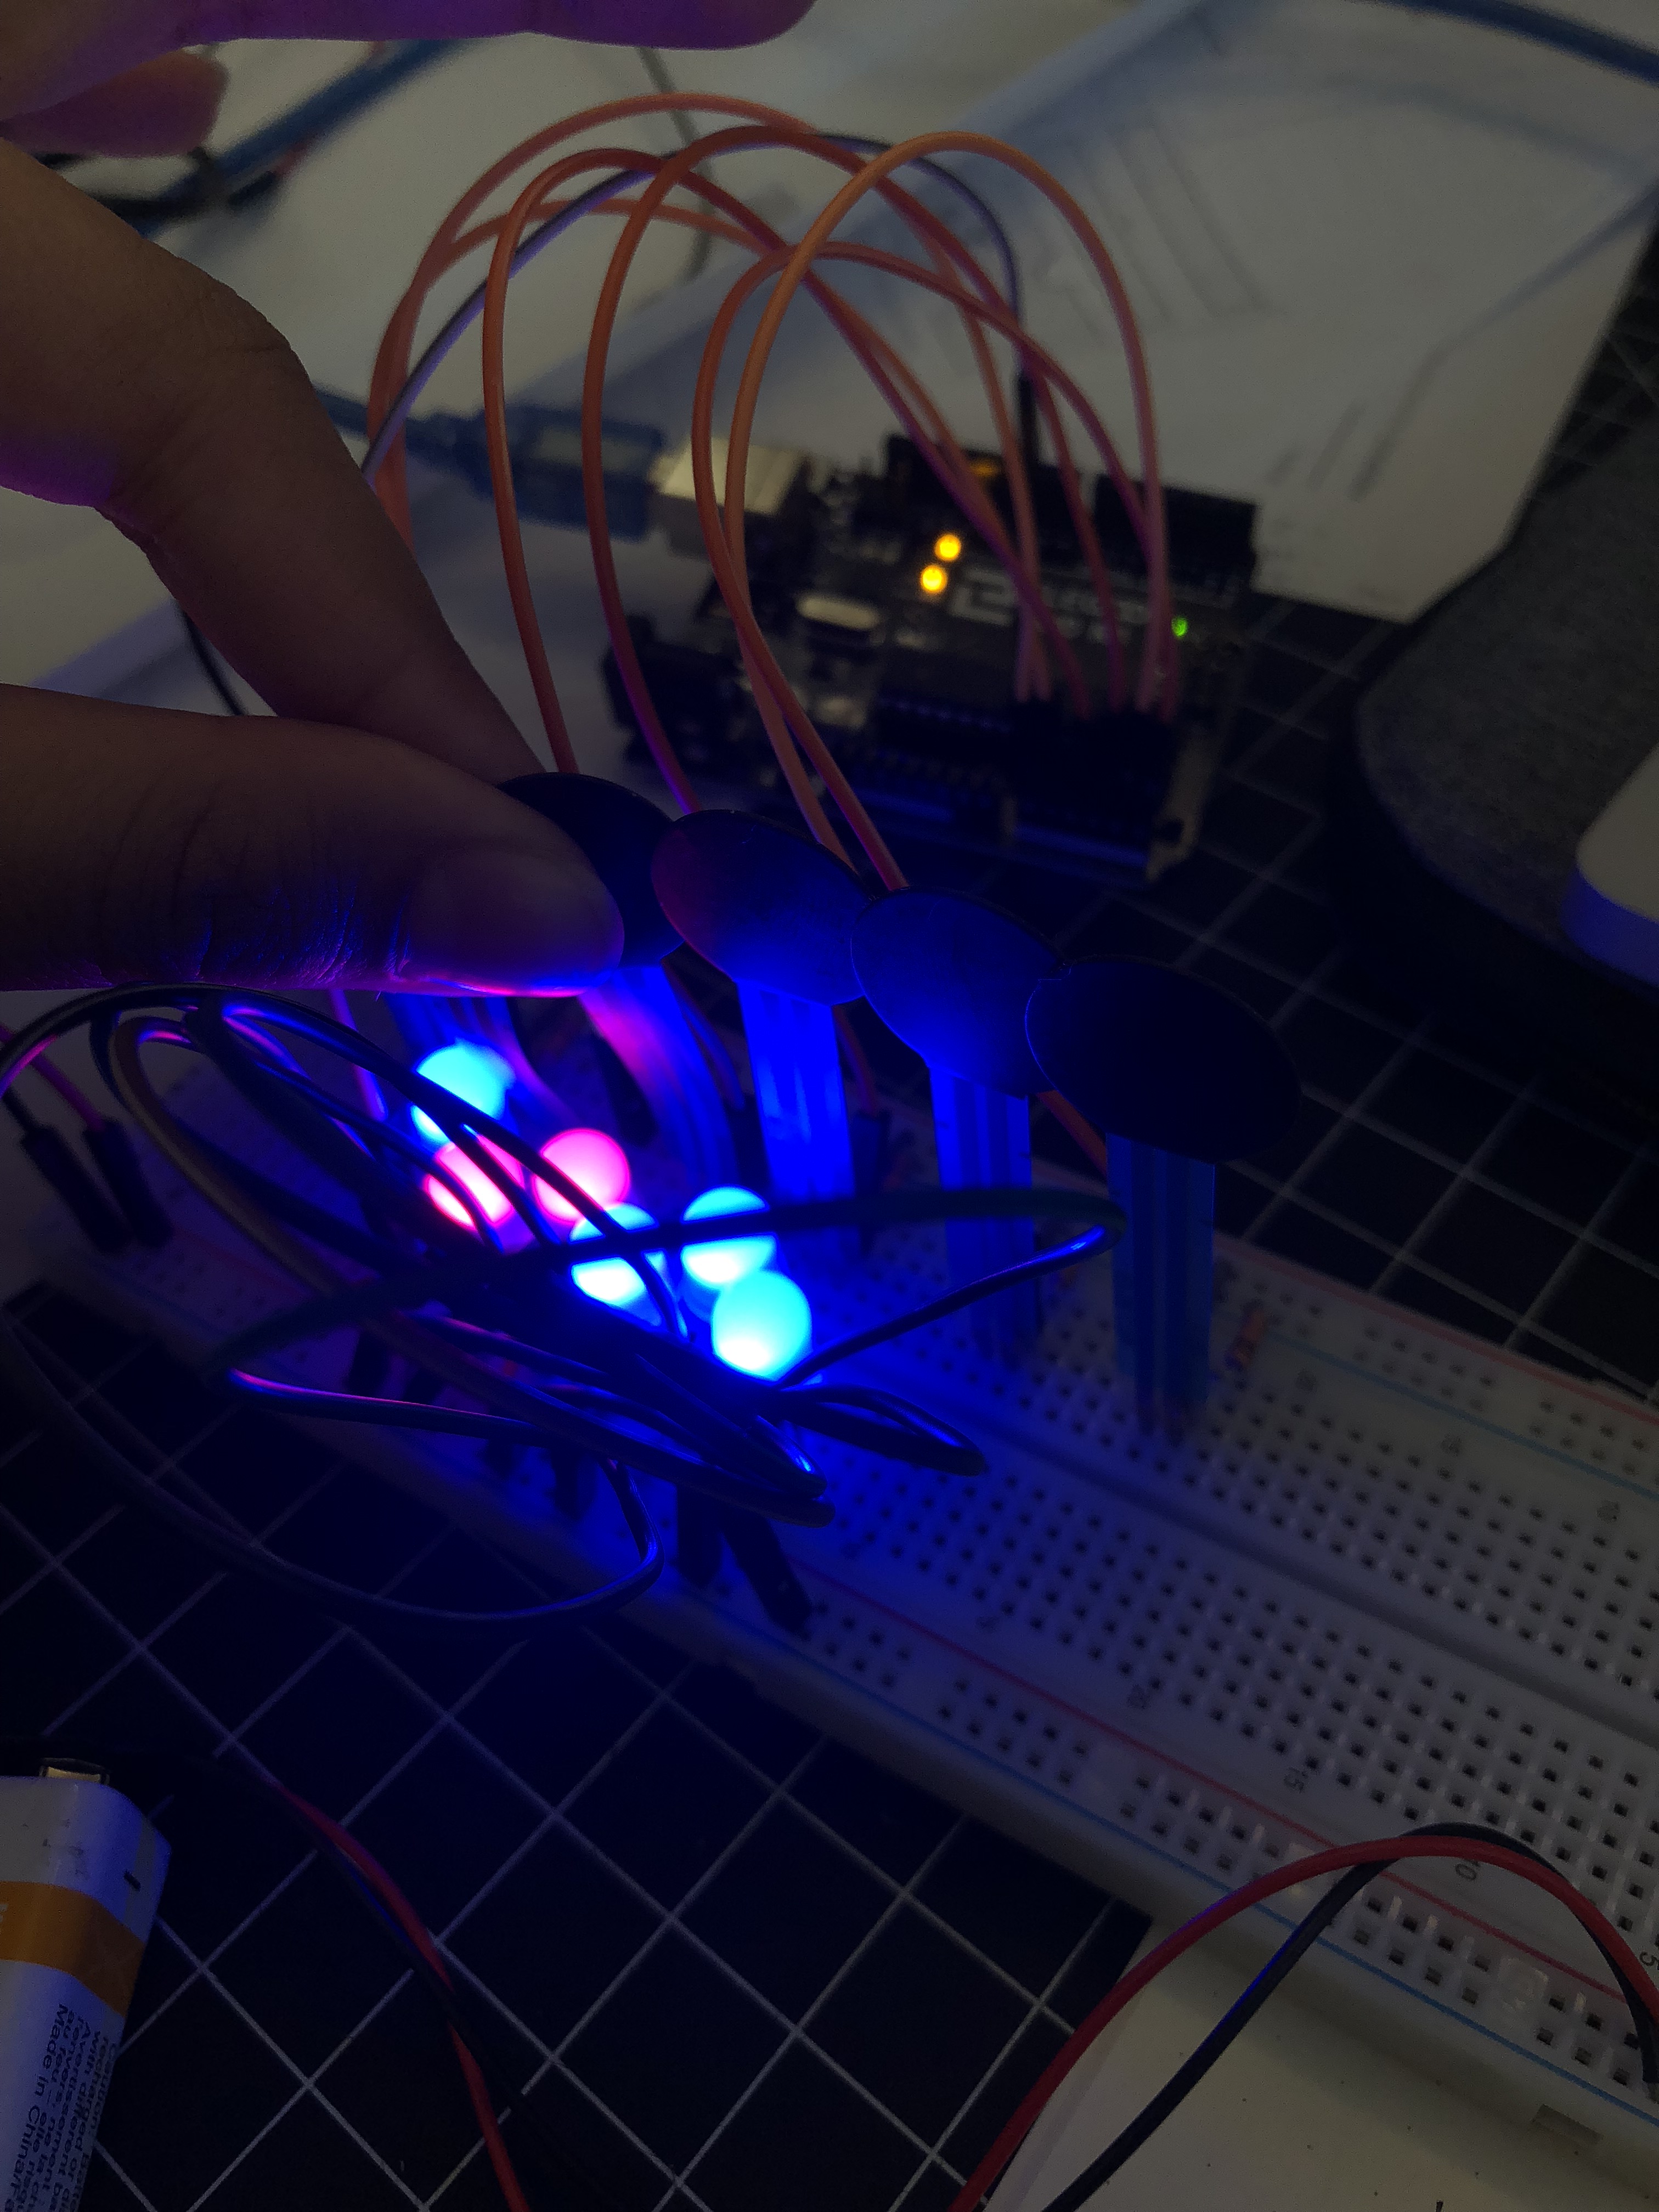
Close up image of the display as pressure is applied at the bottom of the foot.
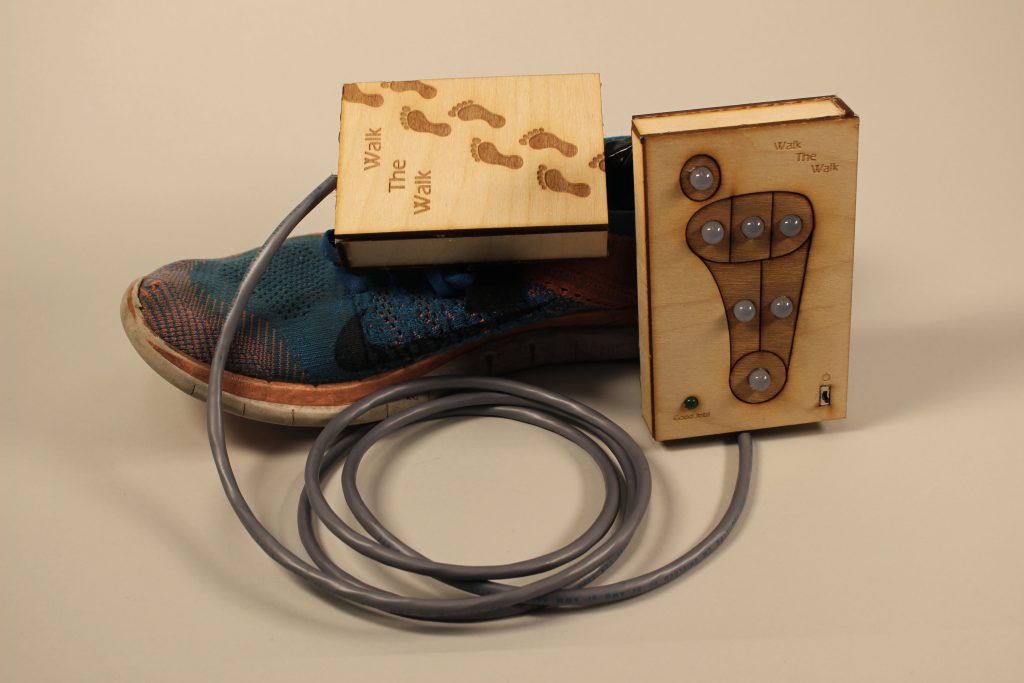
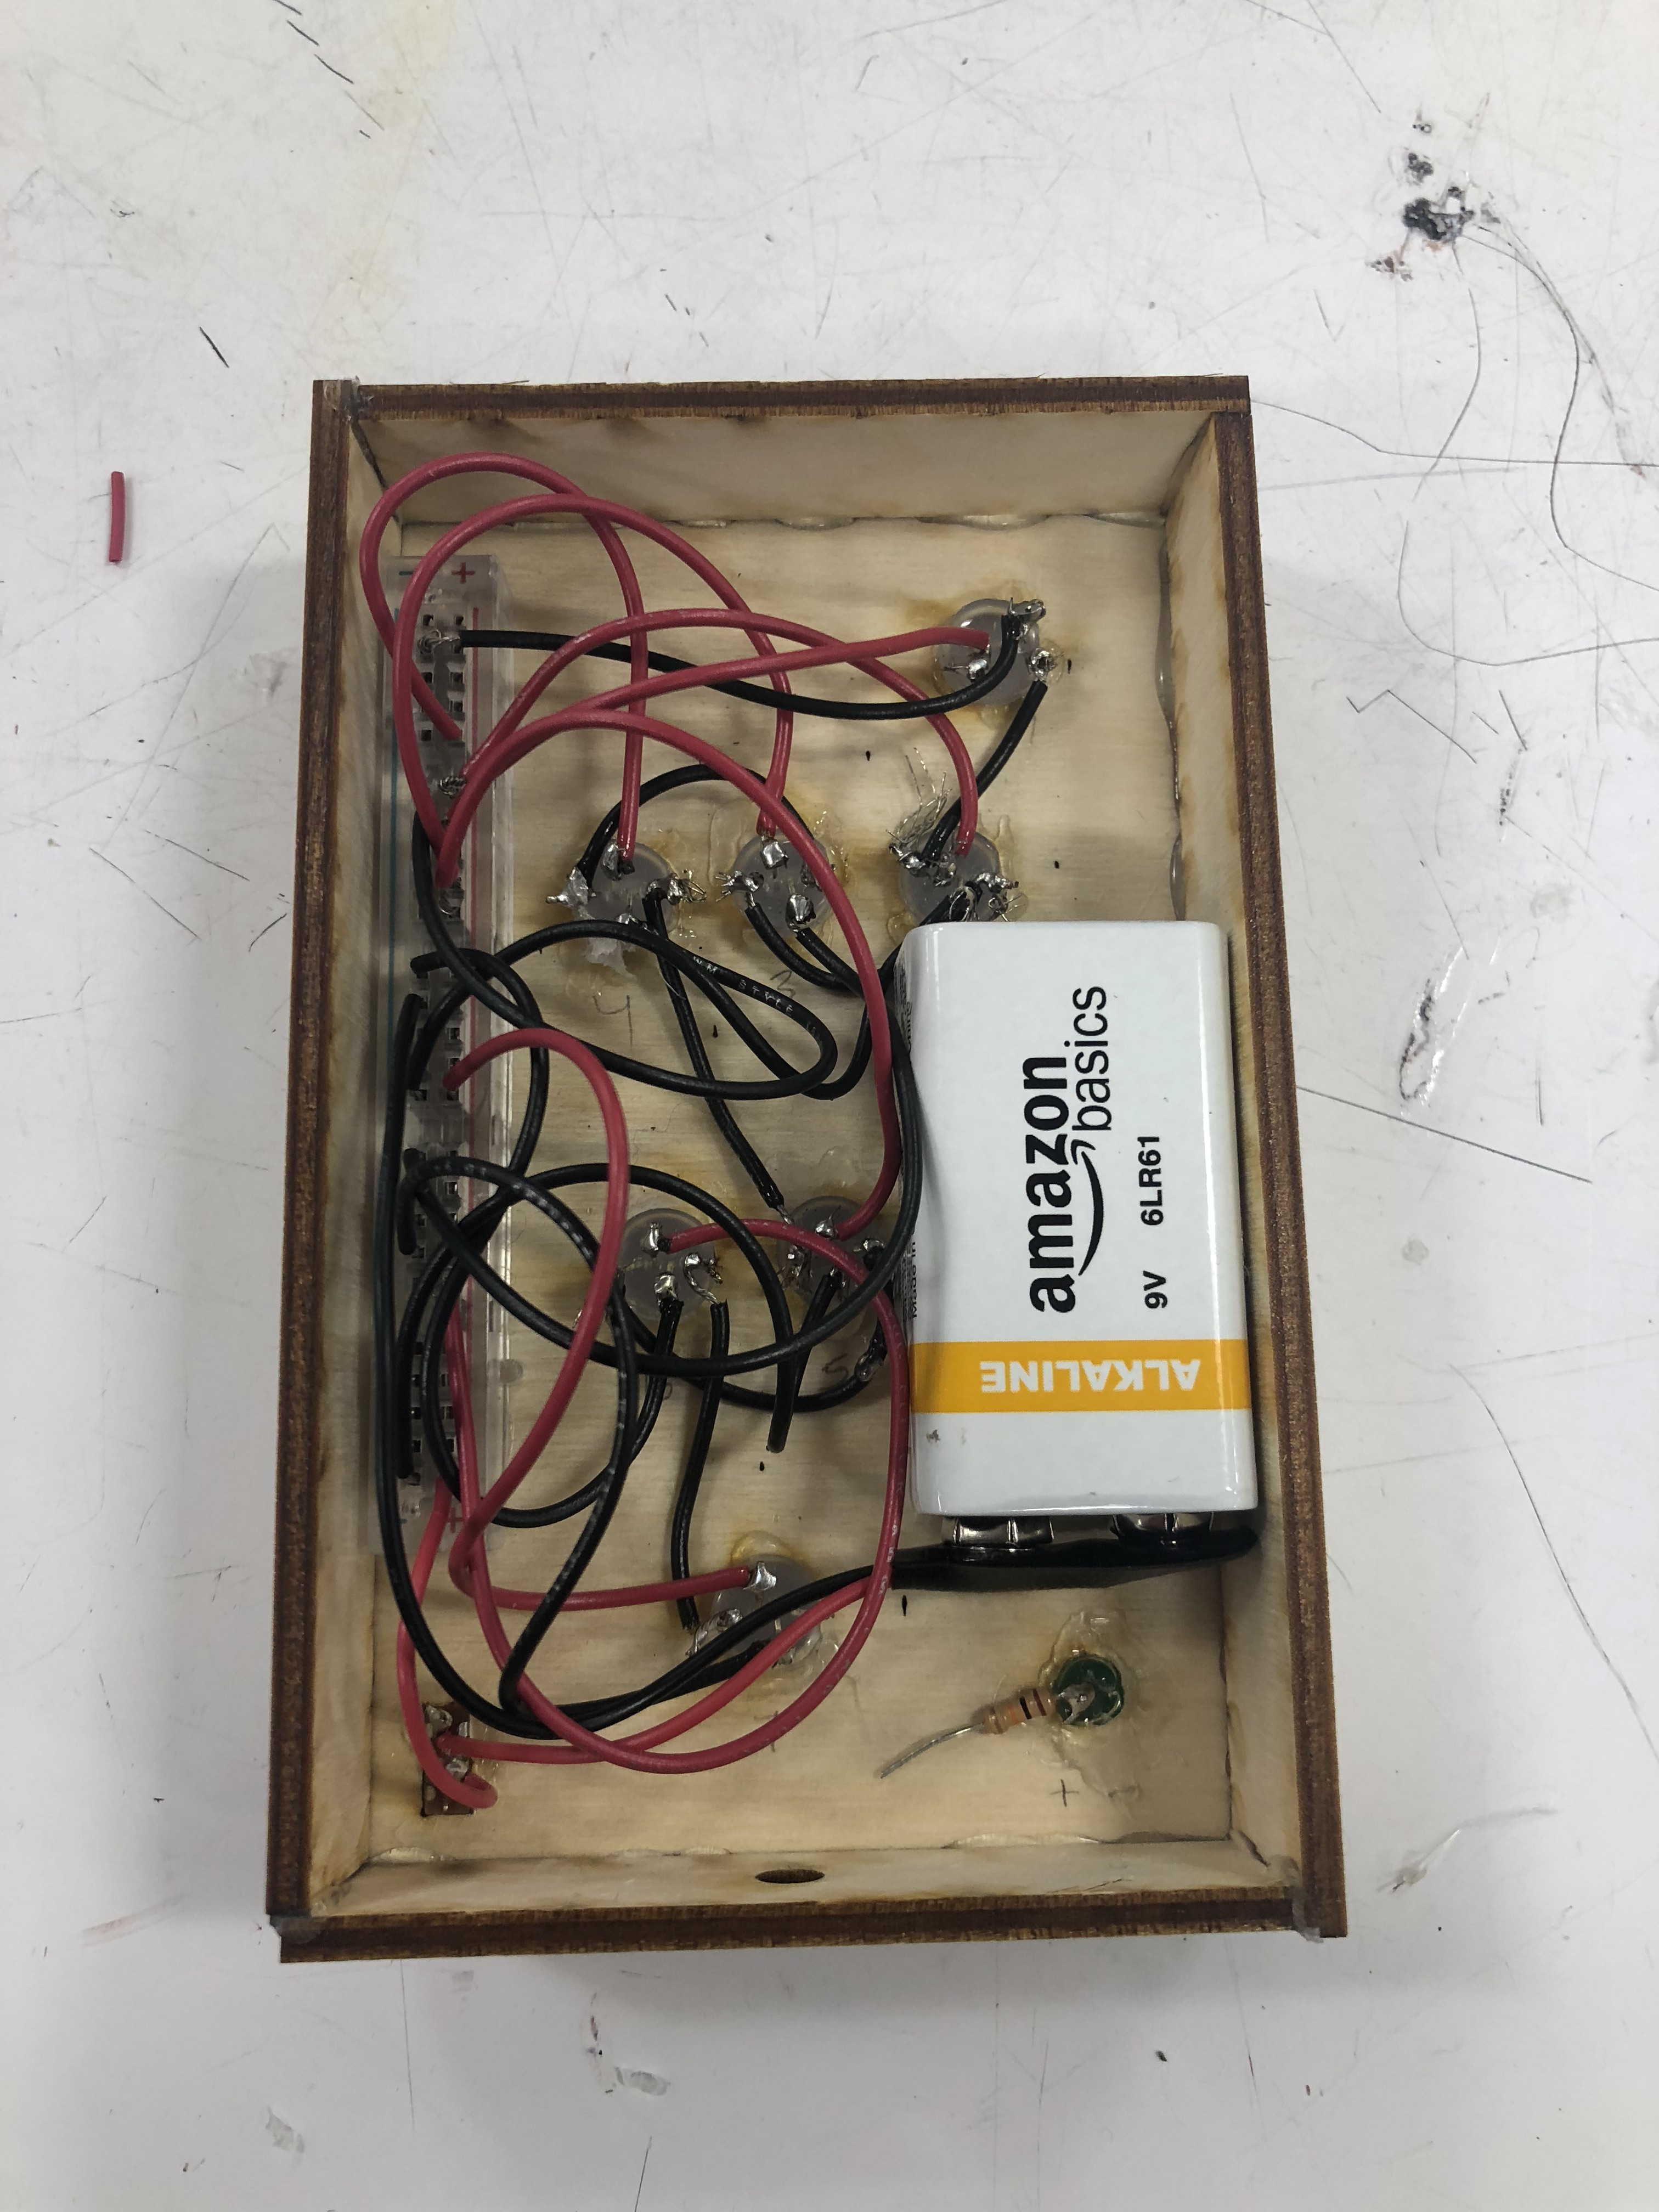
Close up of all the components when the device is off.
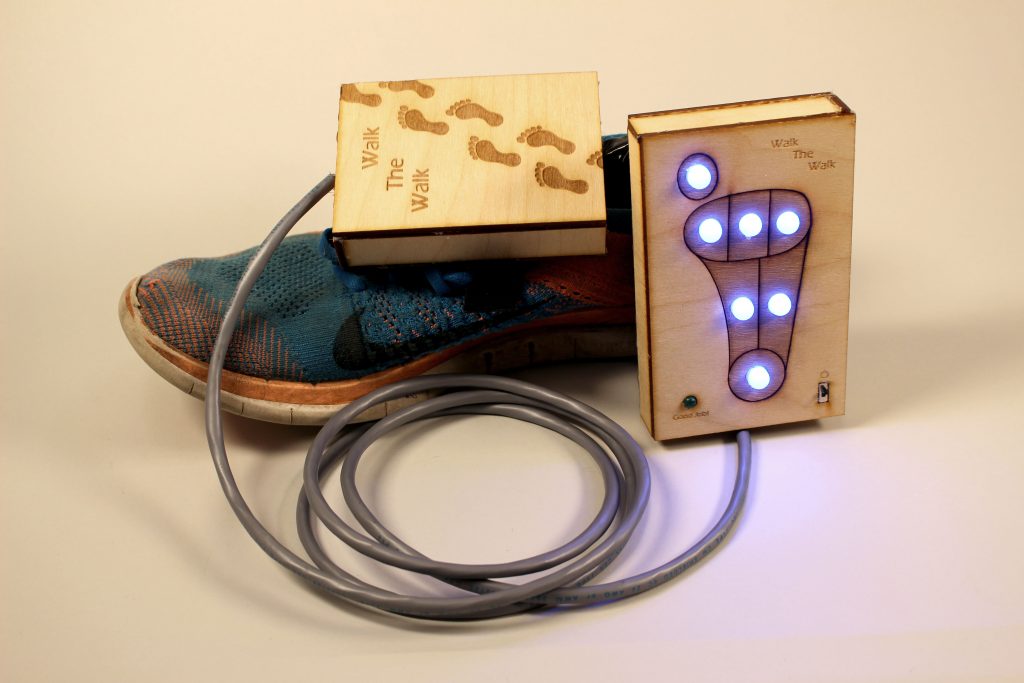
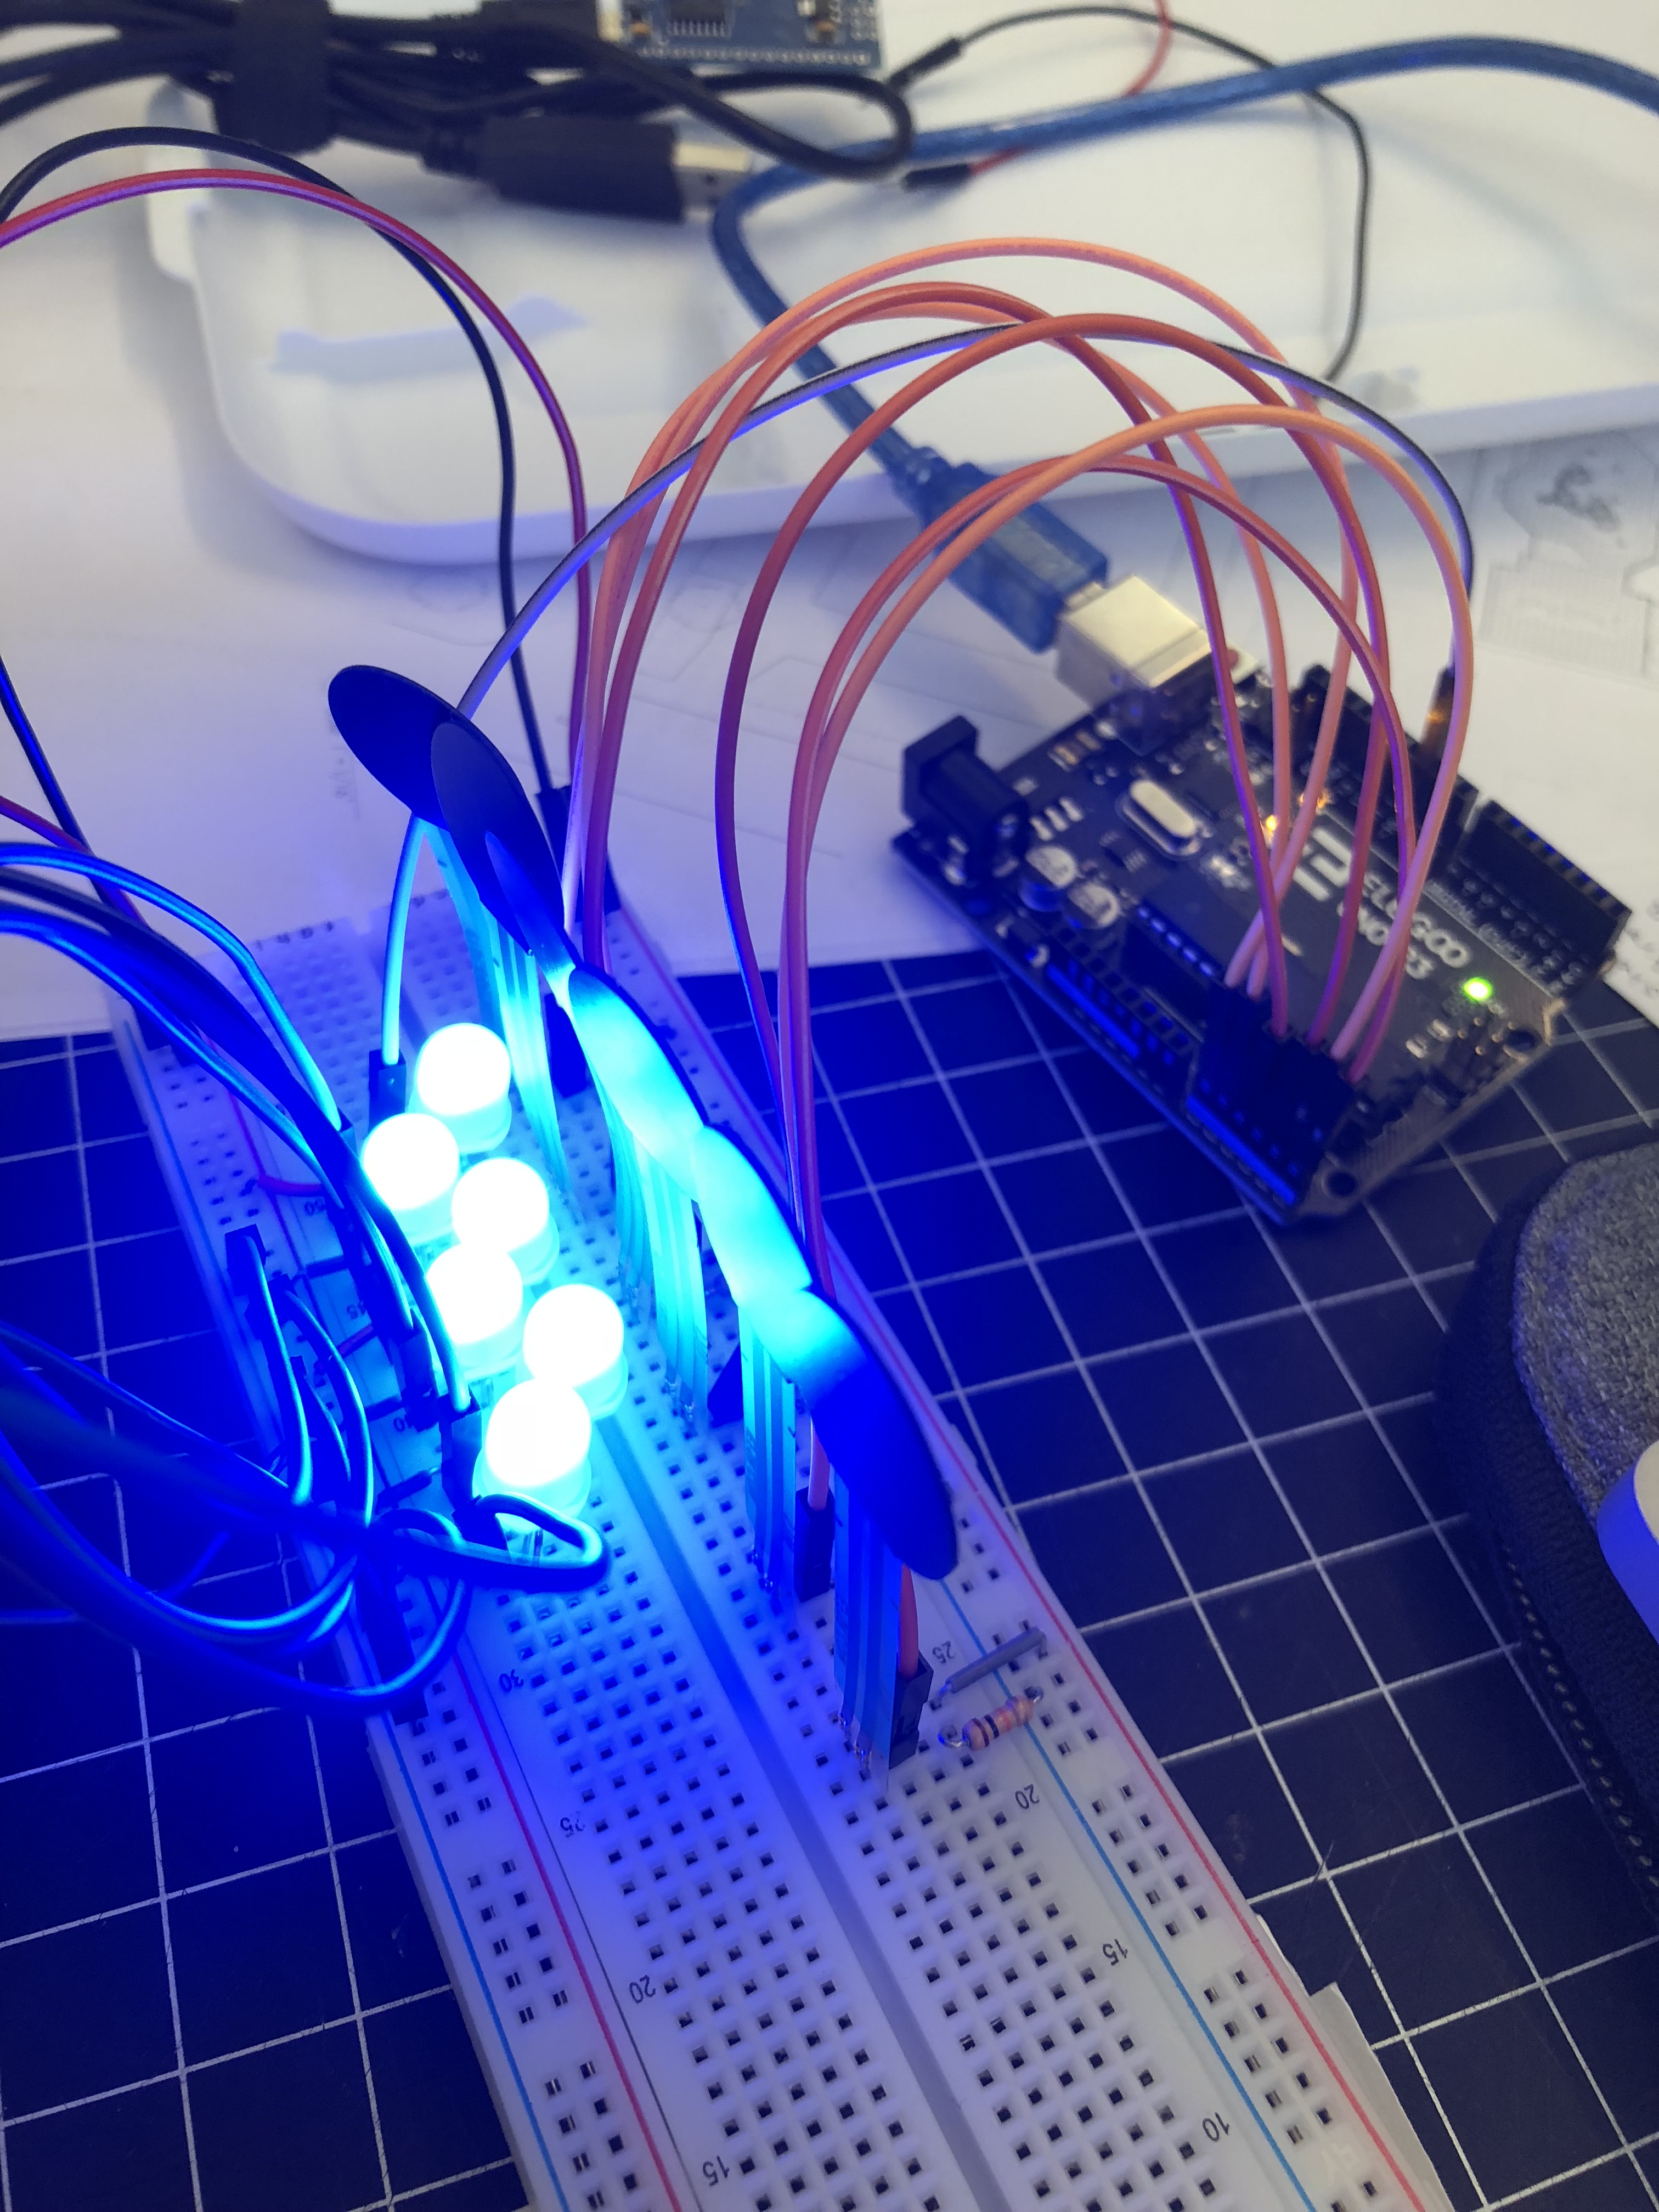
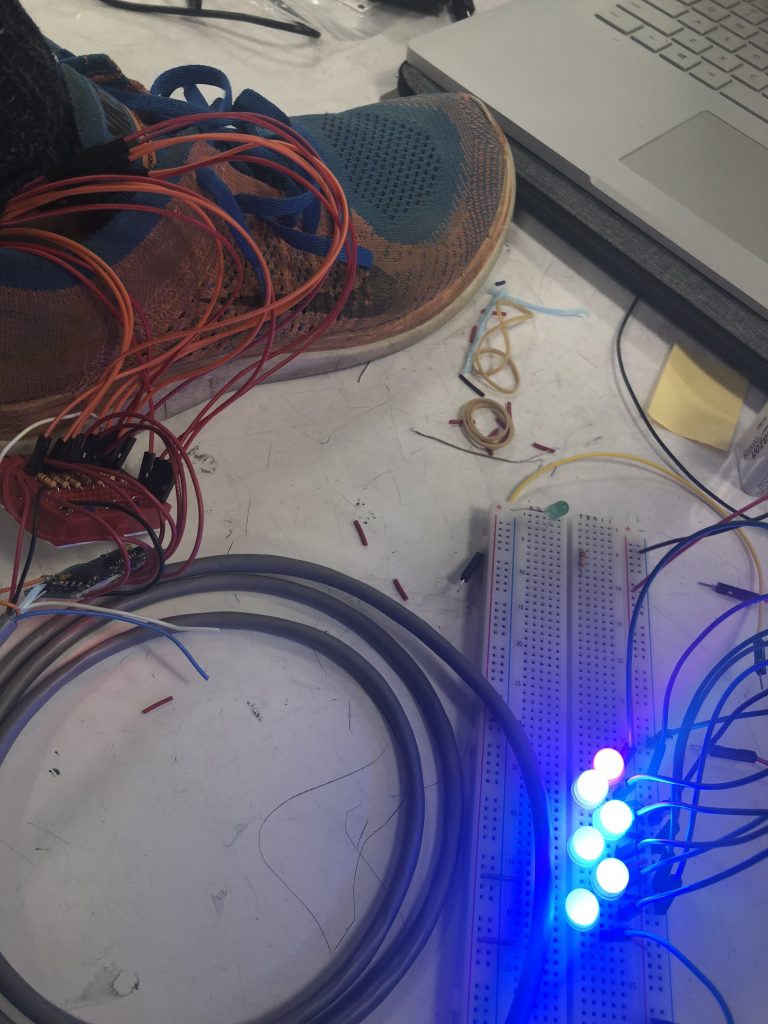
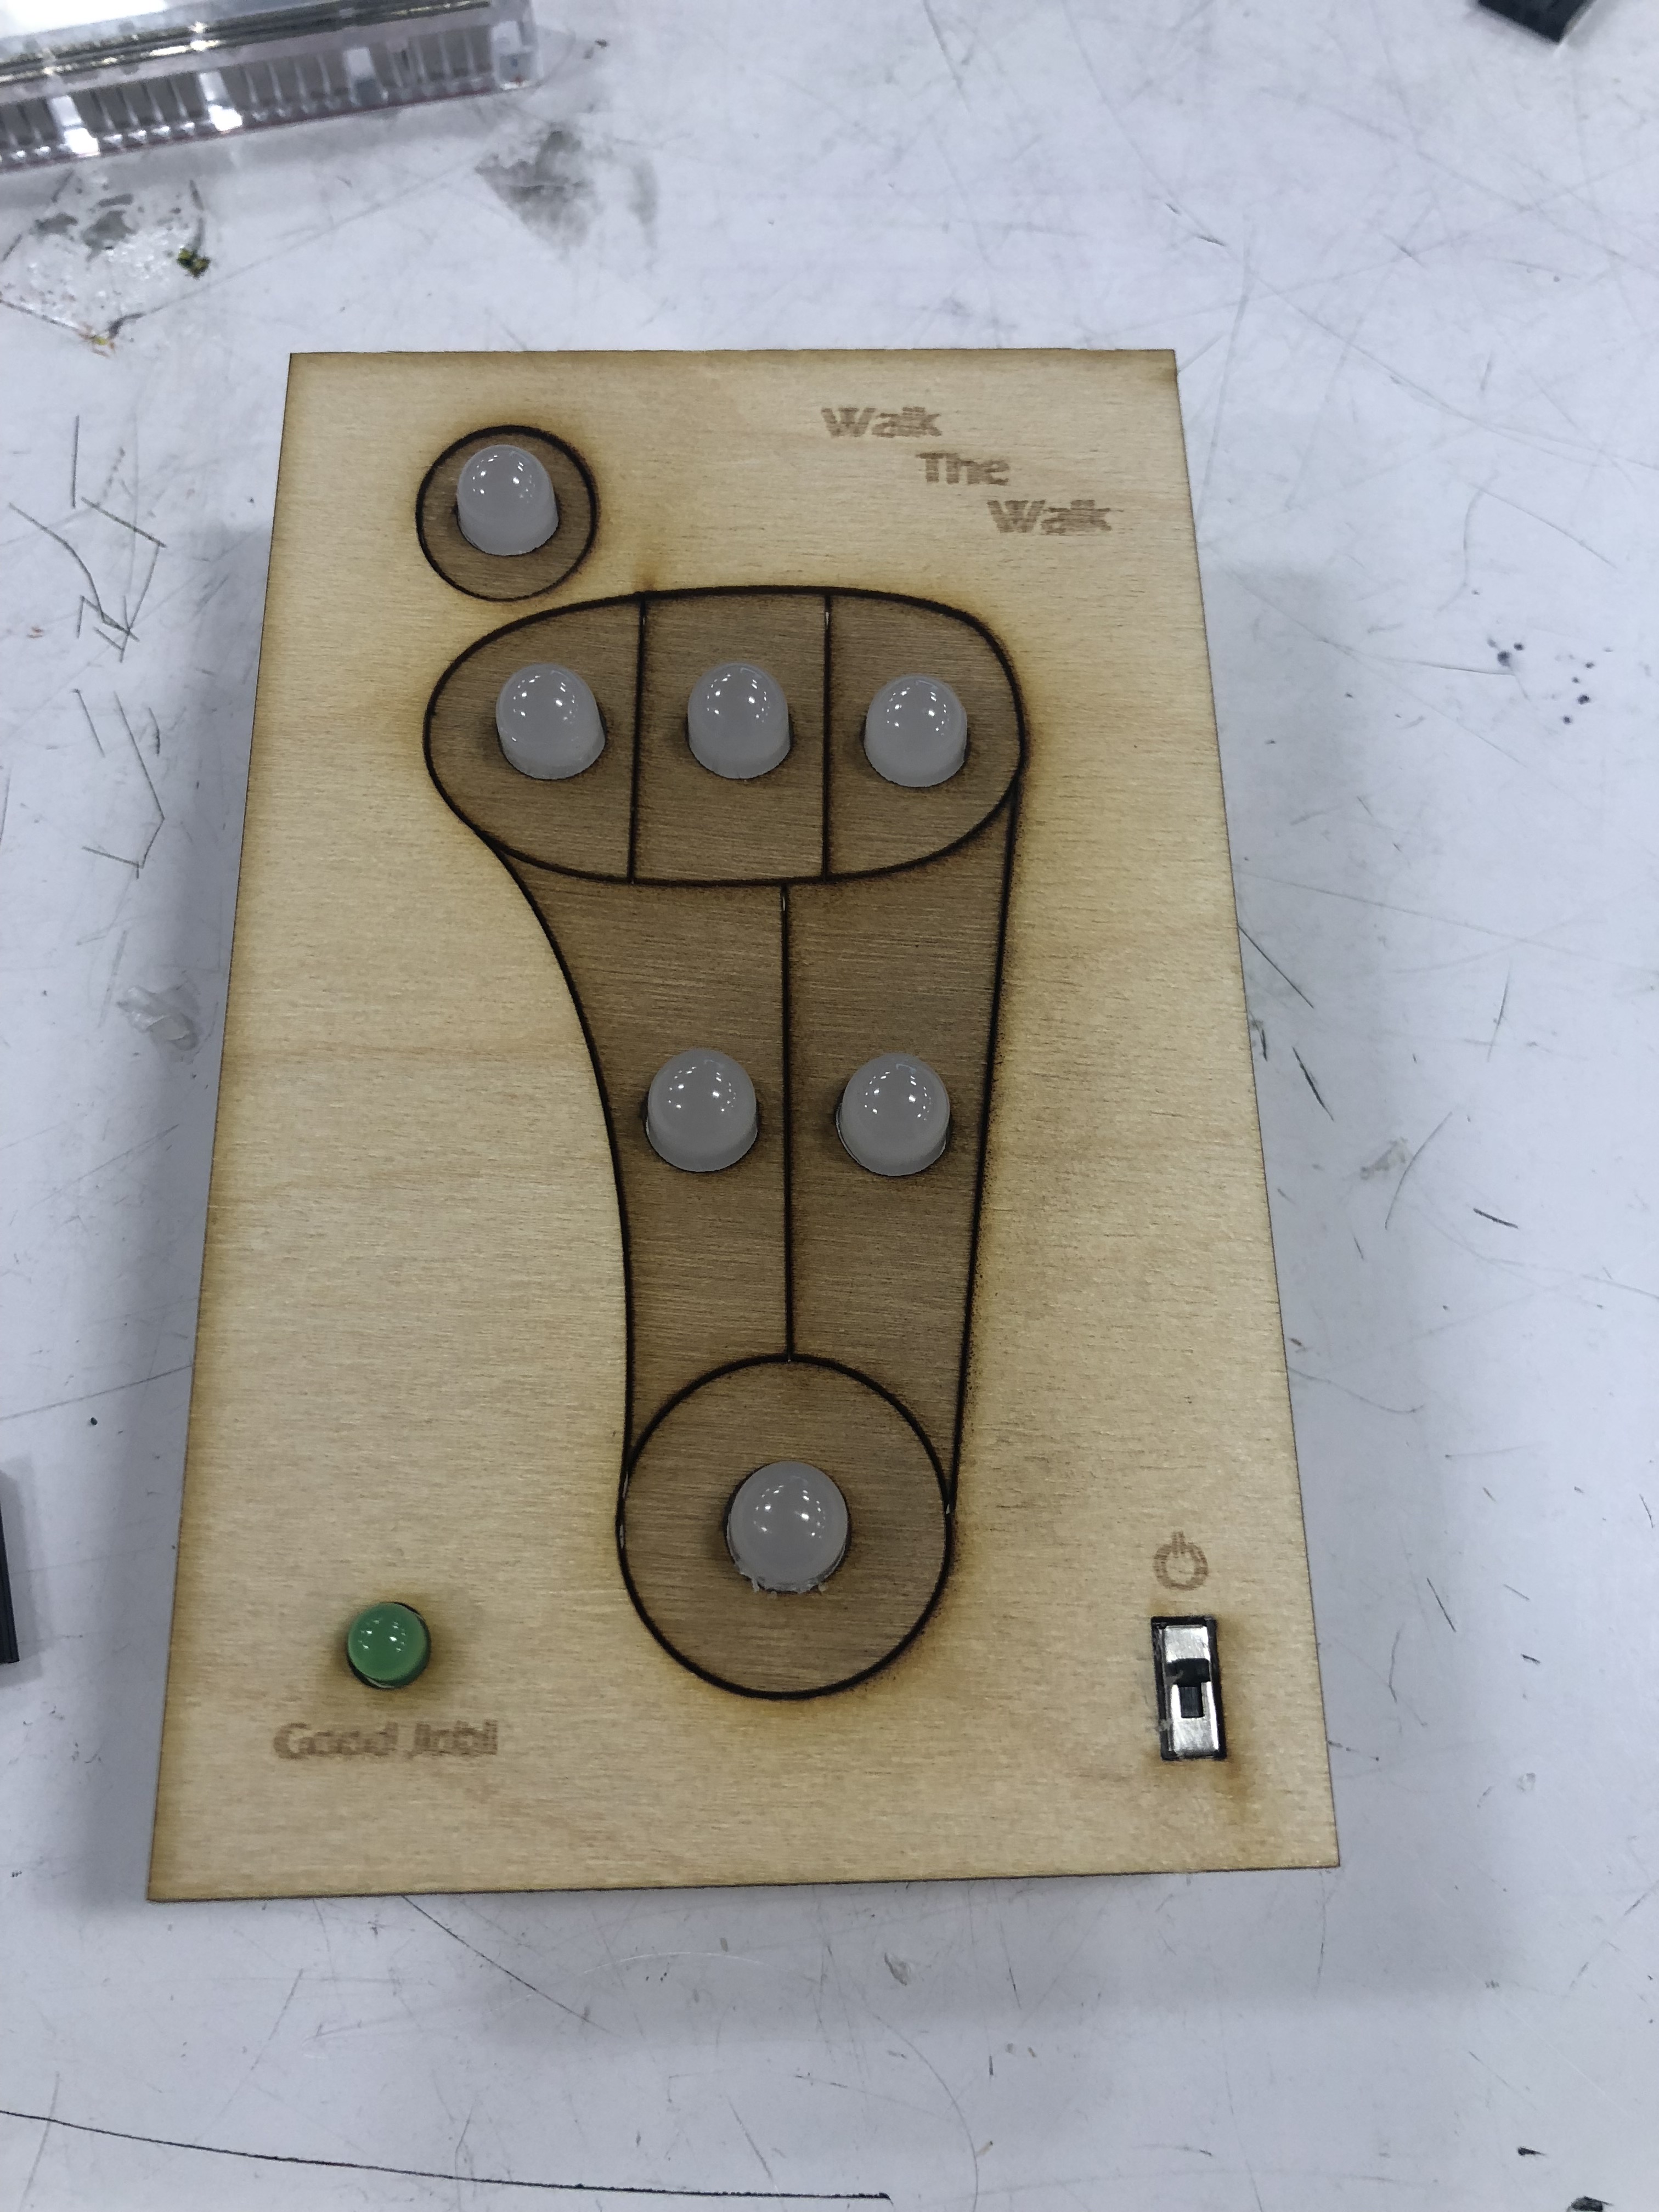
Close up of all the components when the device is on. Note that the lights are all blue because no pressure is applied to the shoe.
Animation of how the display functions as you move pressure from the bottom of the foot to your toes.
Process
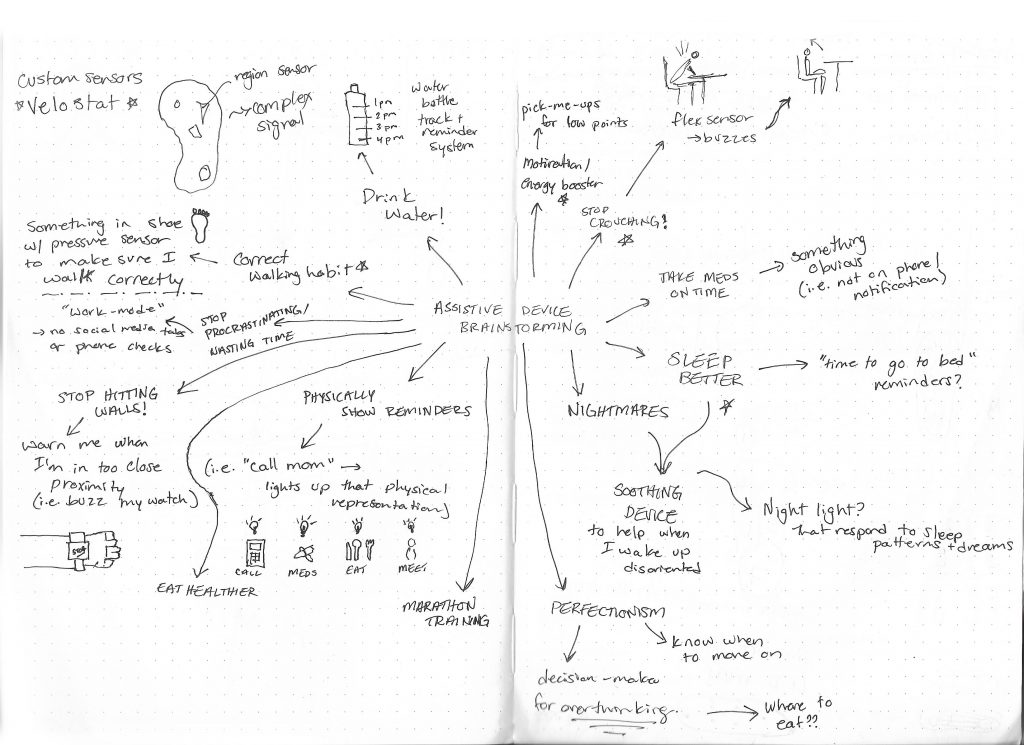
Different brainstorming ideas for an assistive device.
I am someone who has very bad walking habits. Ever since I was a kid, I knew I had wrong pressure distribution when walking, which caused my knees to grow at a wrong angle. To fix that, I need to constantly remind myself to fix the way I walk. This device is designed to help me do that. It visually displays the pressure distribution, plus tells me when I am putting the right amount of pressure.
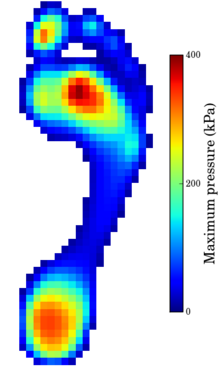
I was inspired by Pedobarography– the science and mapping of foot pressure distribution. This is a healthy pressure distribution example.
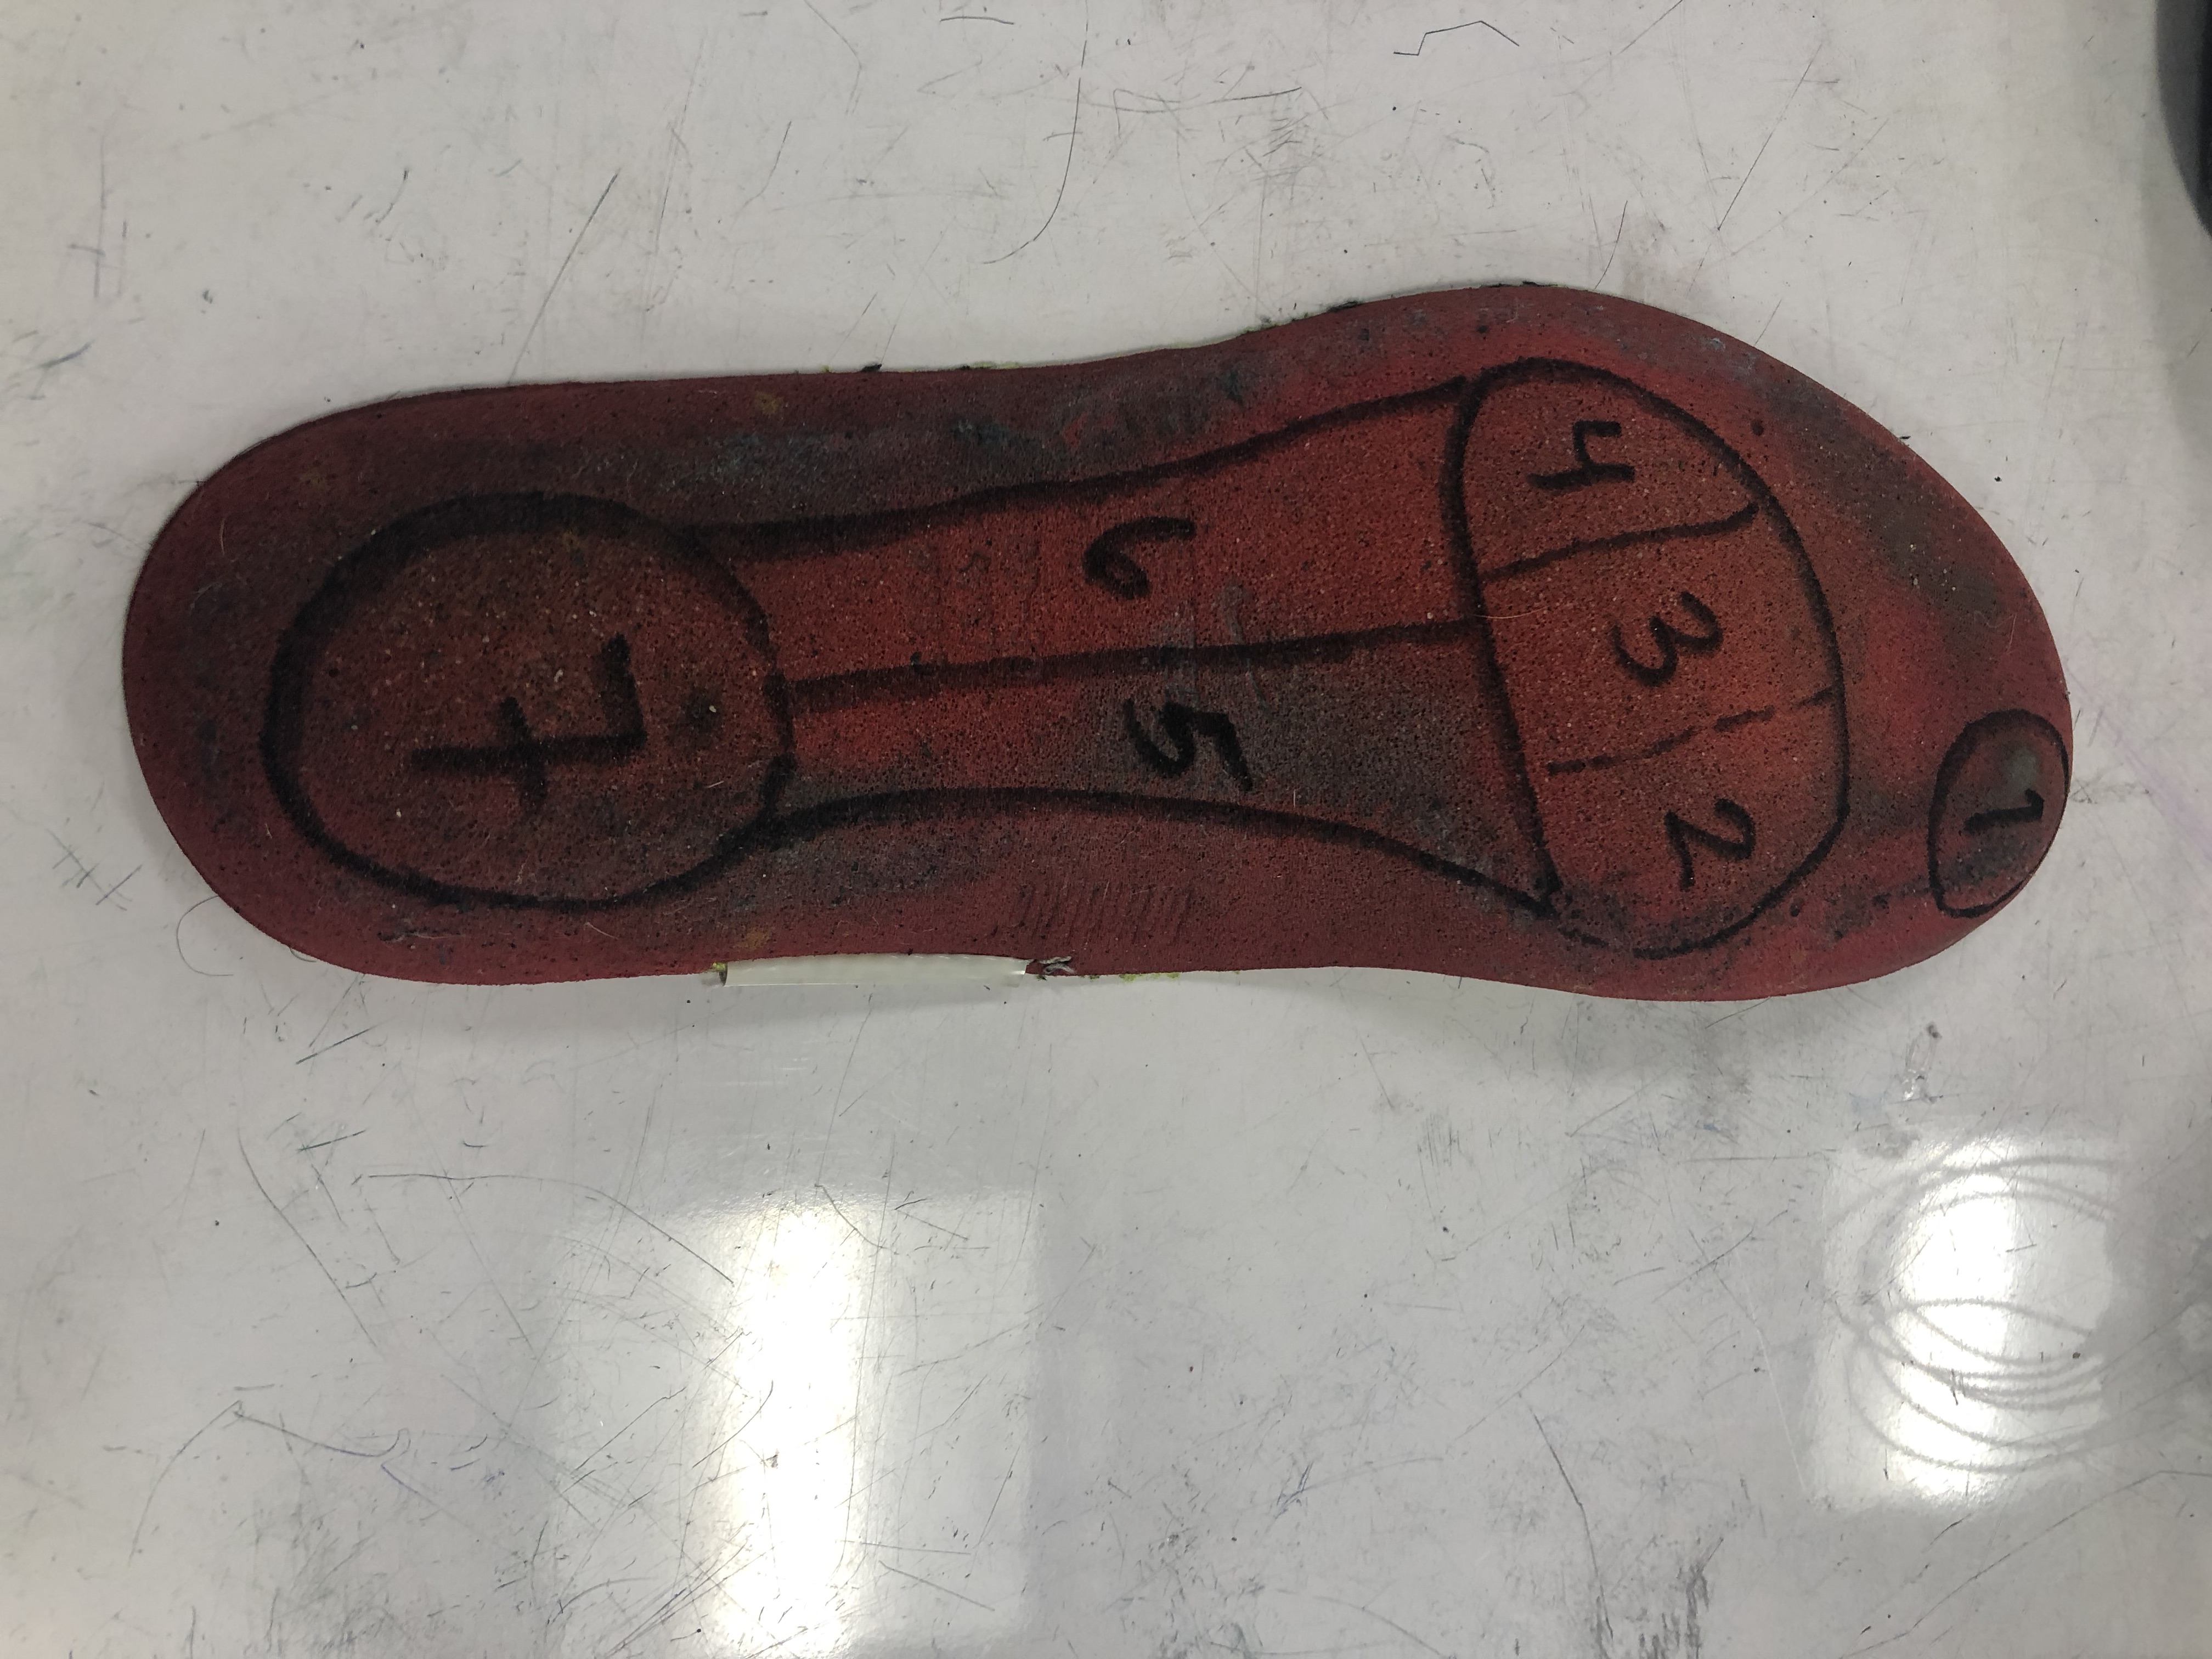
Based on extensive research on the topic, I started sketching ideas on different important pressure points, and how to correctly distribute weight on a foot.
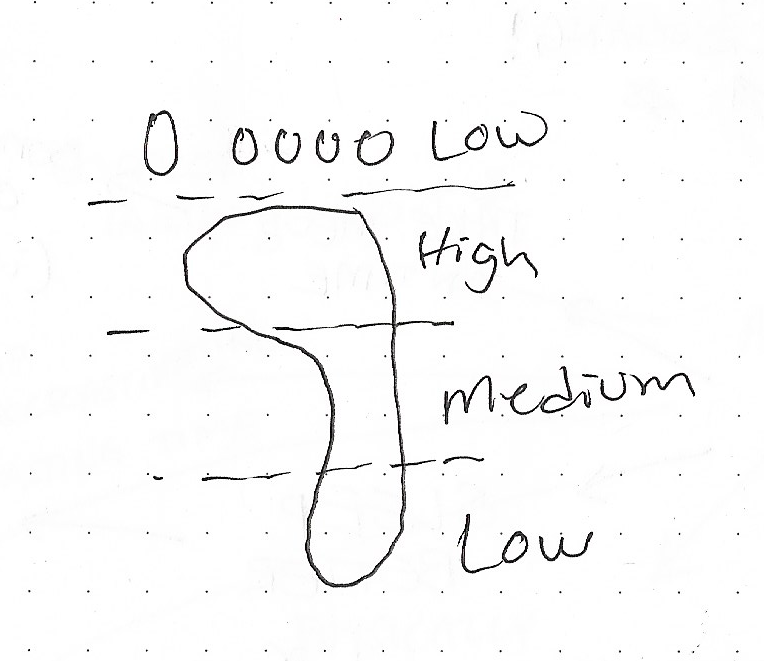
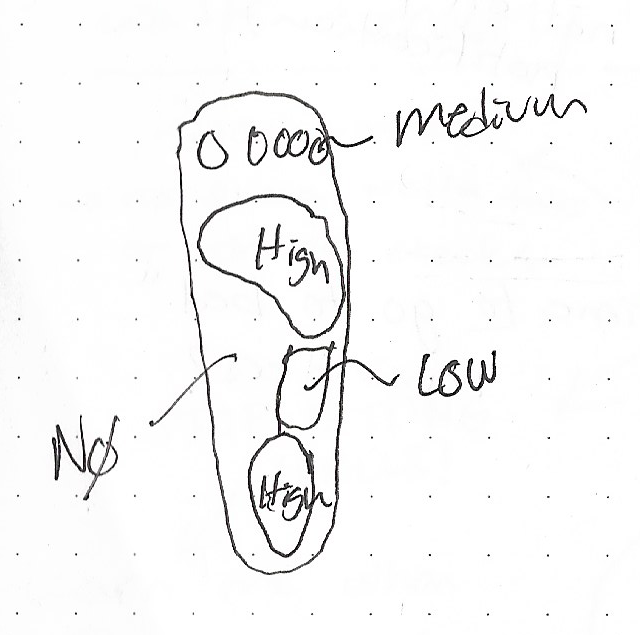
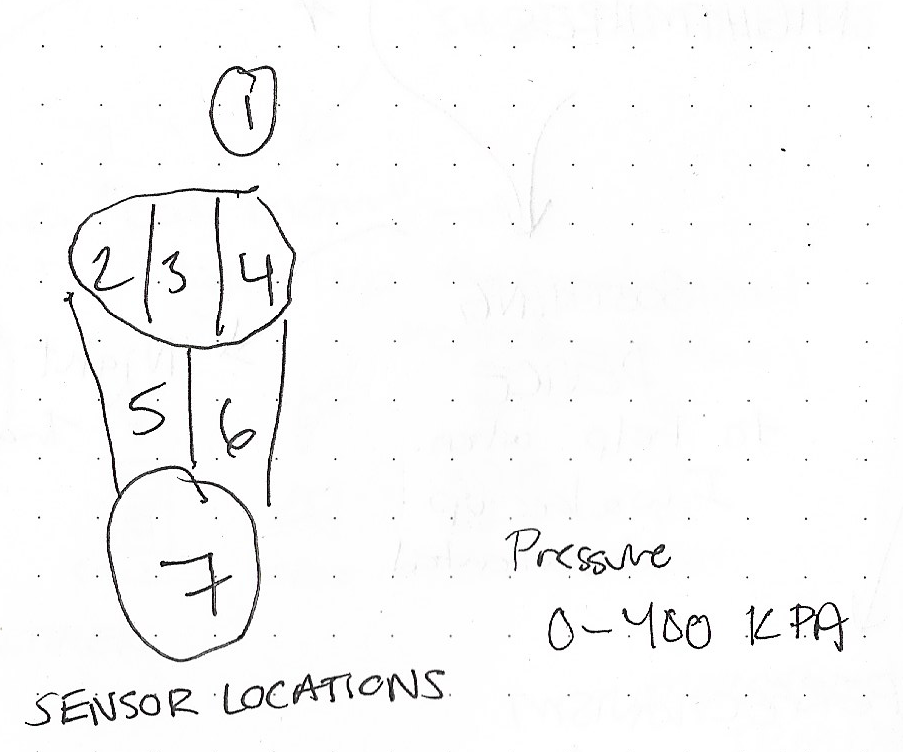
Based on the combined reading and diagrams I’ve looked at, I figured these 7 zones are most important places for foot pressure.
After research and ideation, I decided the best way to go about making this it to simultaneously work on two components separately, and then join them once they are complete. The two components are the inputs, which are the pressure sensors, and the outputs which is their corresponding LEDs.
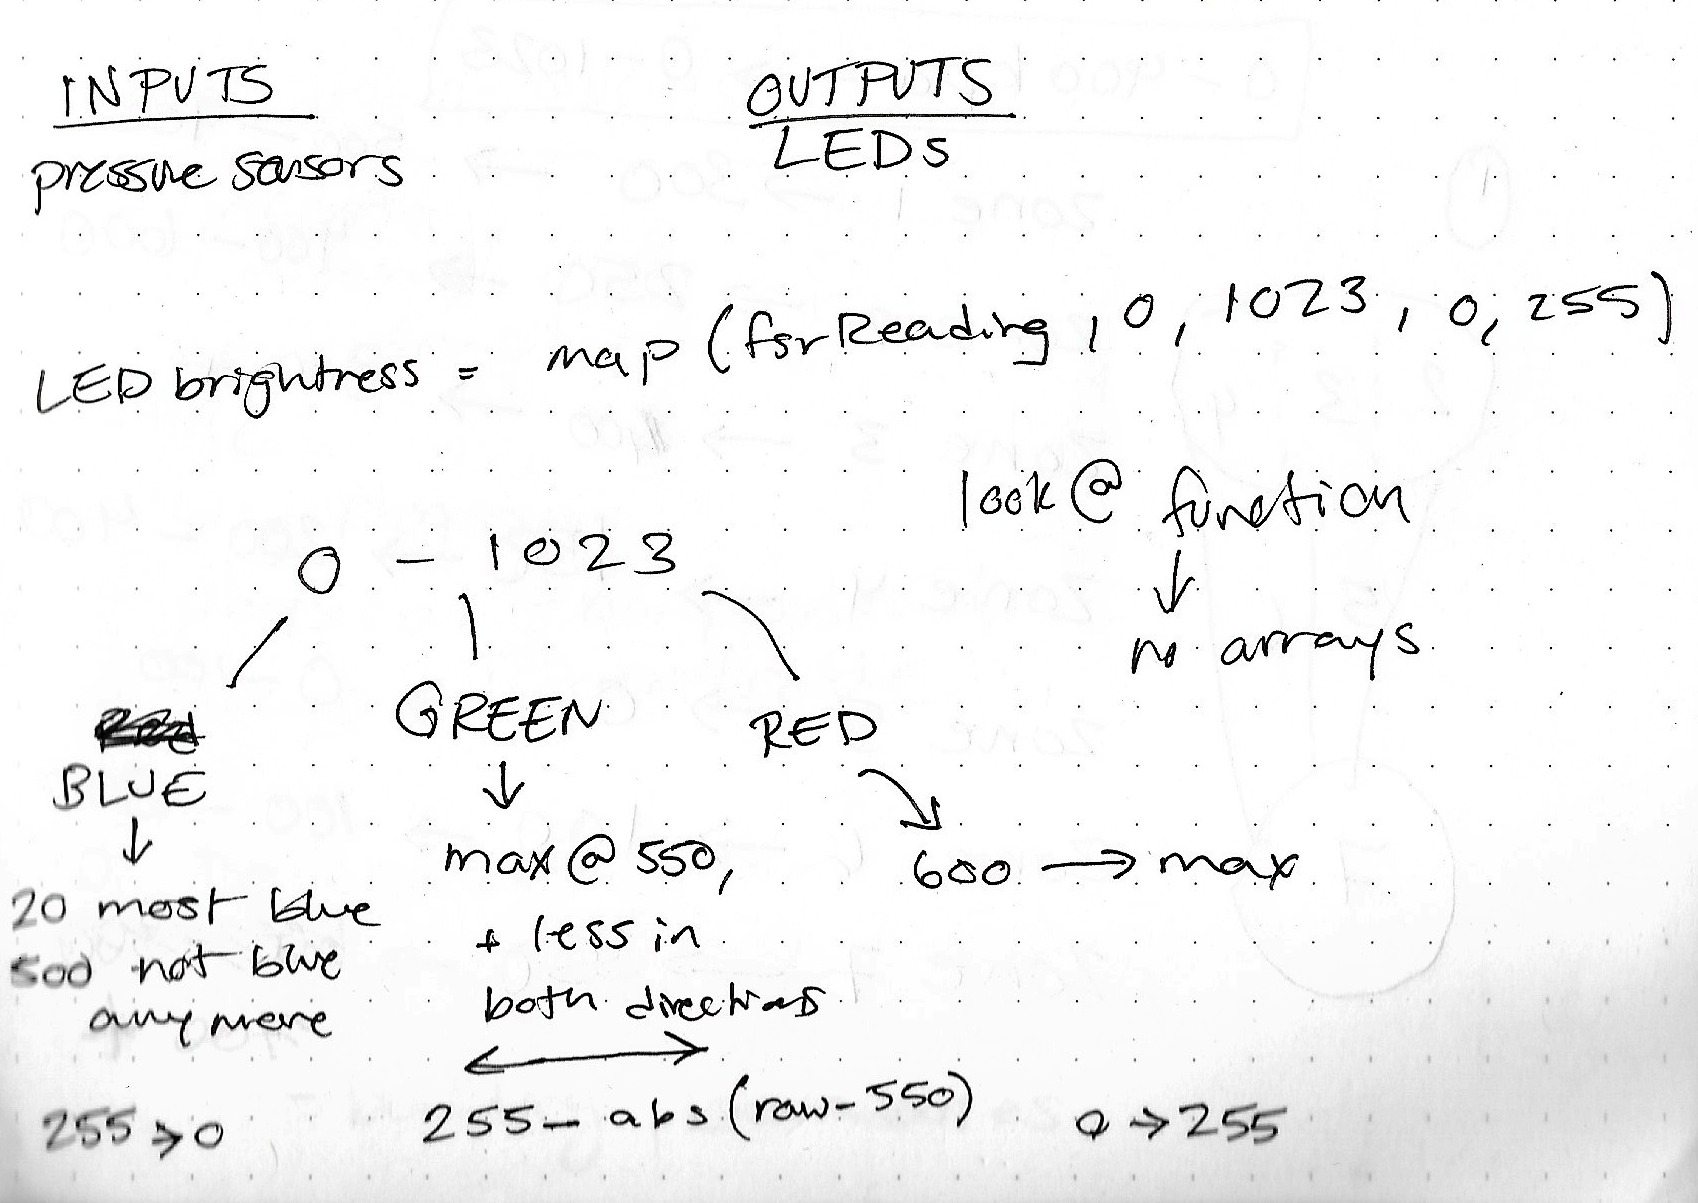
This sketch is the math I was trying to figure out to properly display RGB values on a 0-1023 range in a color gradient. Basically, as pressure increases, the LED goes from blue to green to red. The final values in the code was based on trial and error while using the shoe, to figure out the right values that makes the gradient look right.
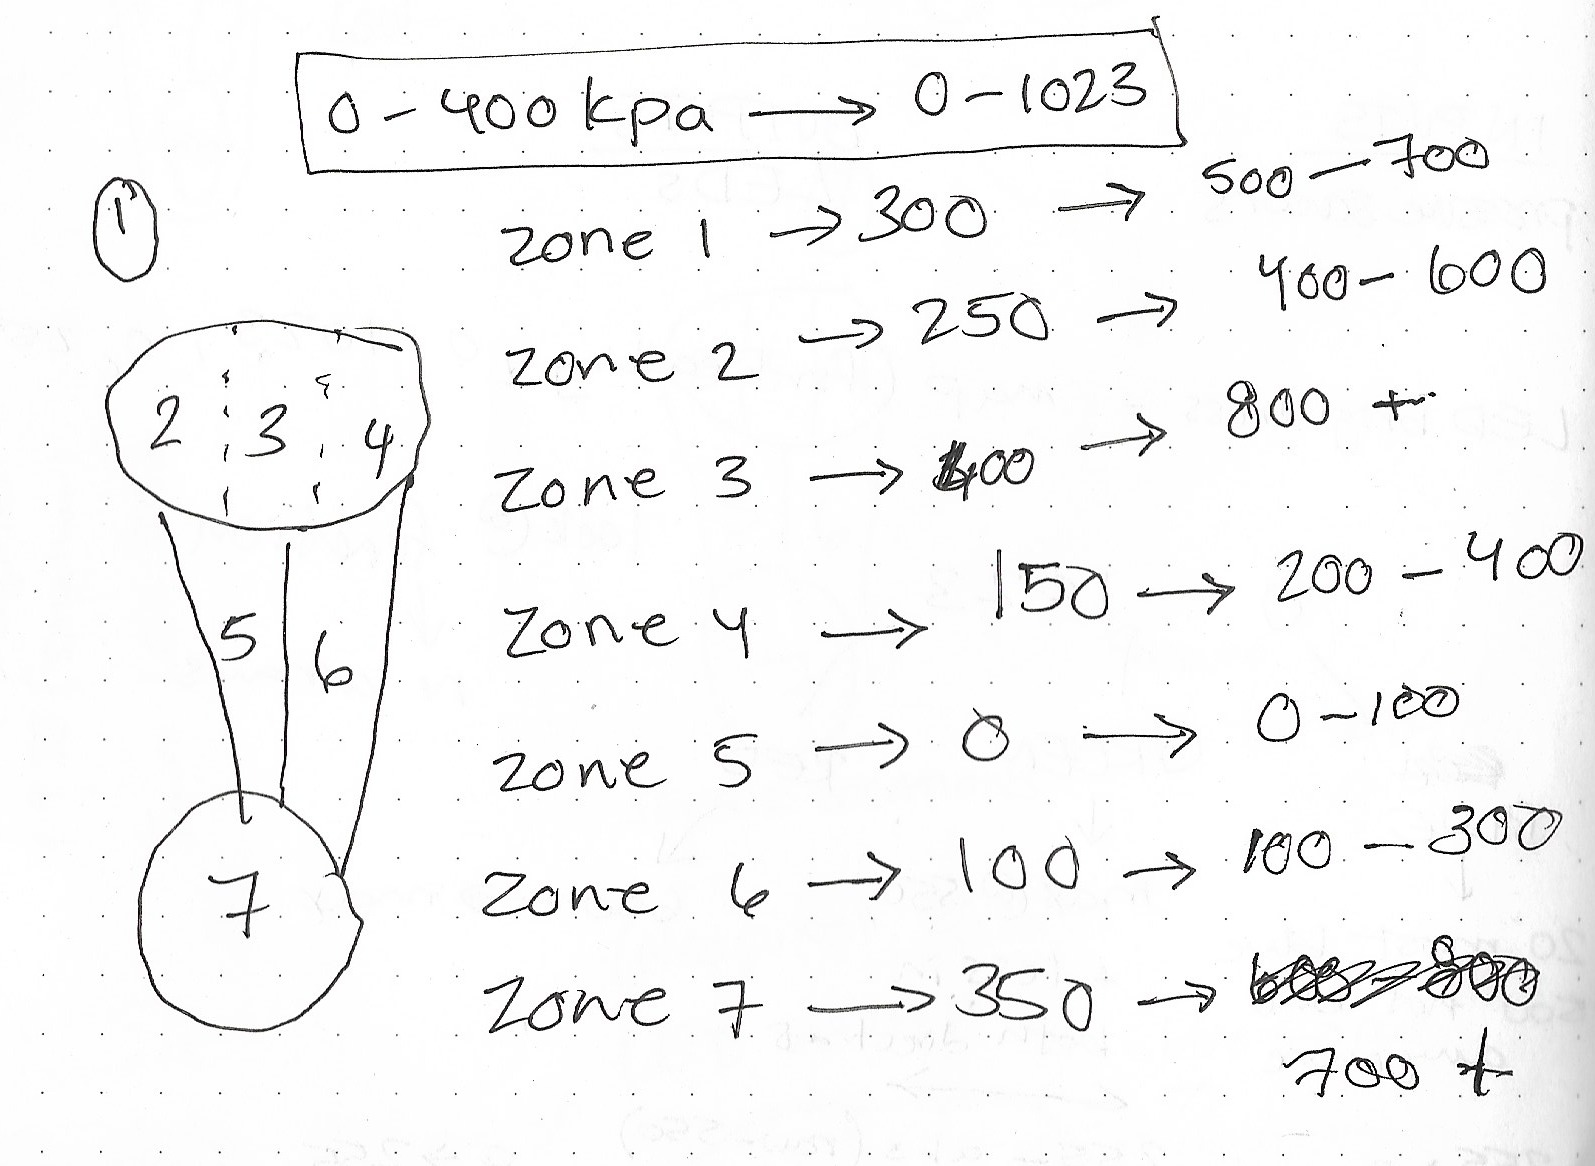
For the “good job!” light: This sketch is deciphering the research and mapping out the correct pressure distribution for each zone. Then using the values corresponding the 0-1023 value read of the pressure sensor to help map out the correct corresponding RGB value.
PART 1: Getting the pressure sensors to work and map the right colors on the LEDs
PART 2: transferring the sensors and making the shoe
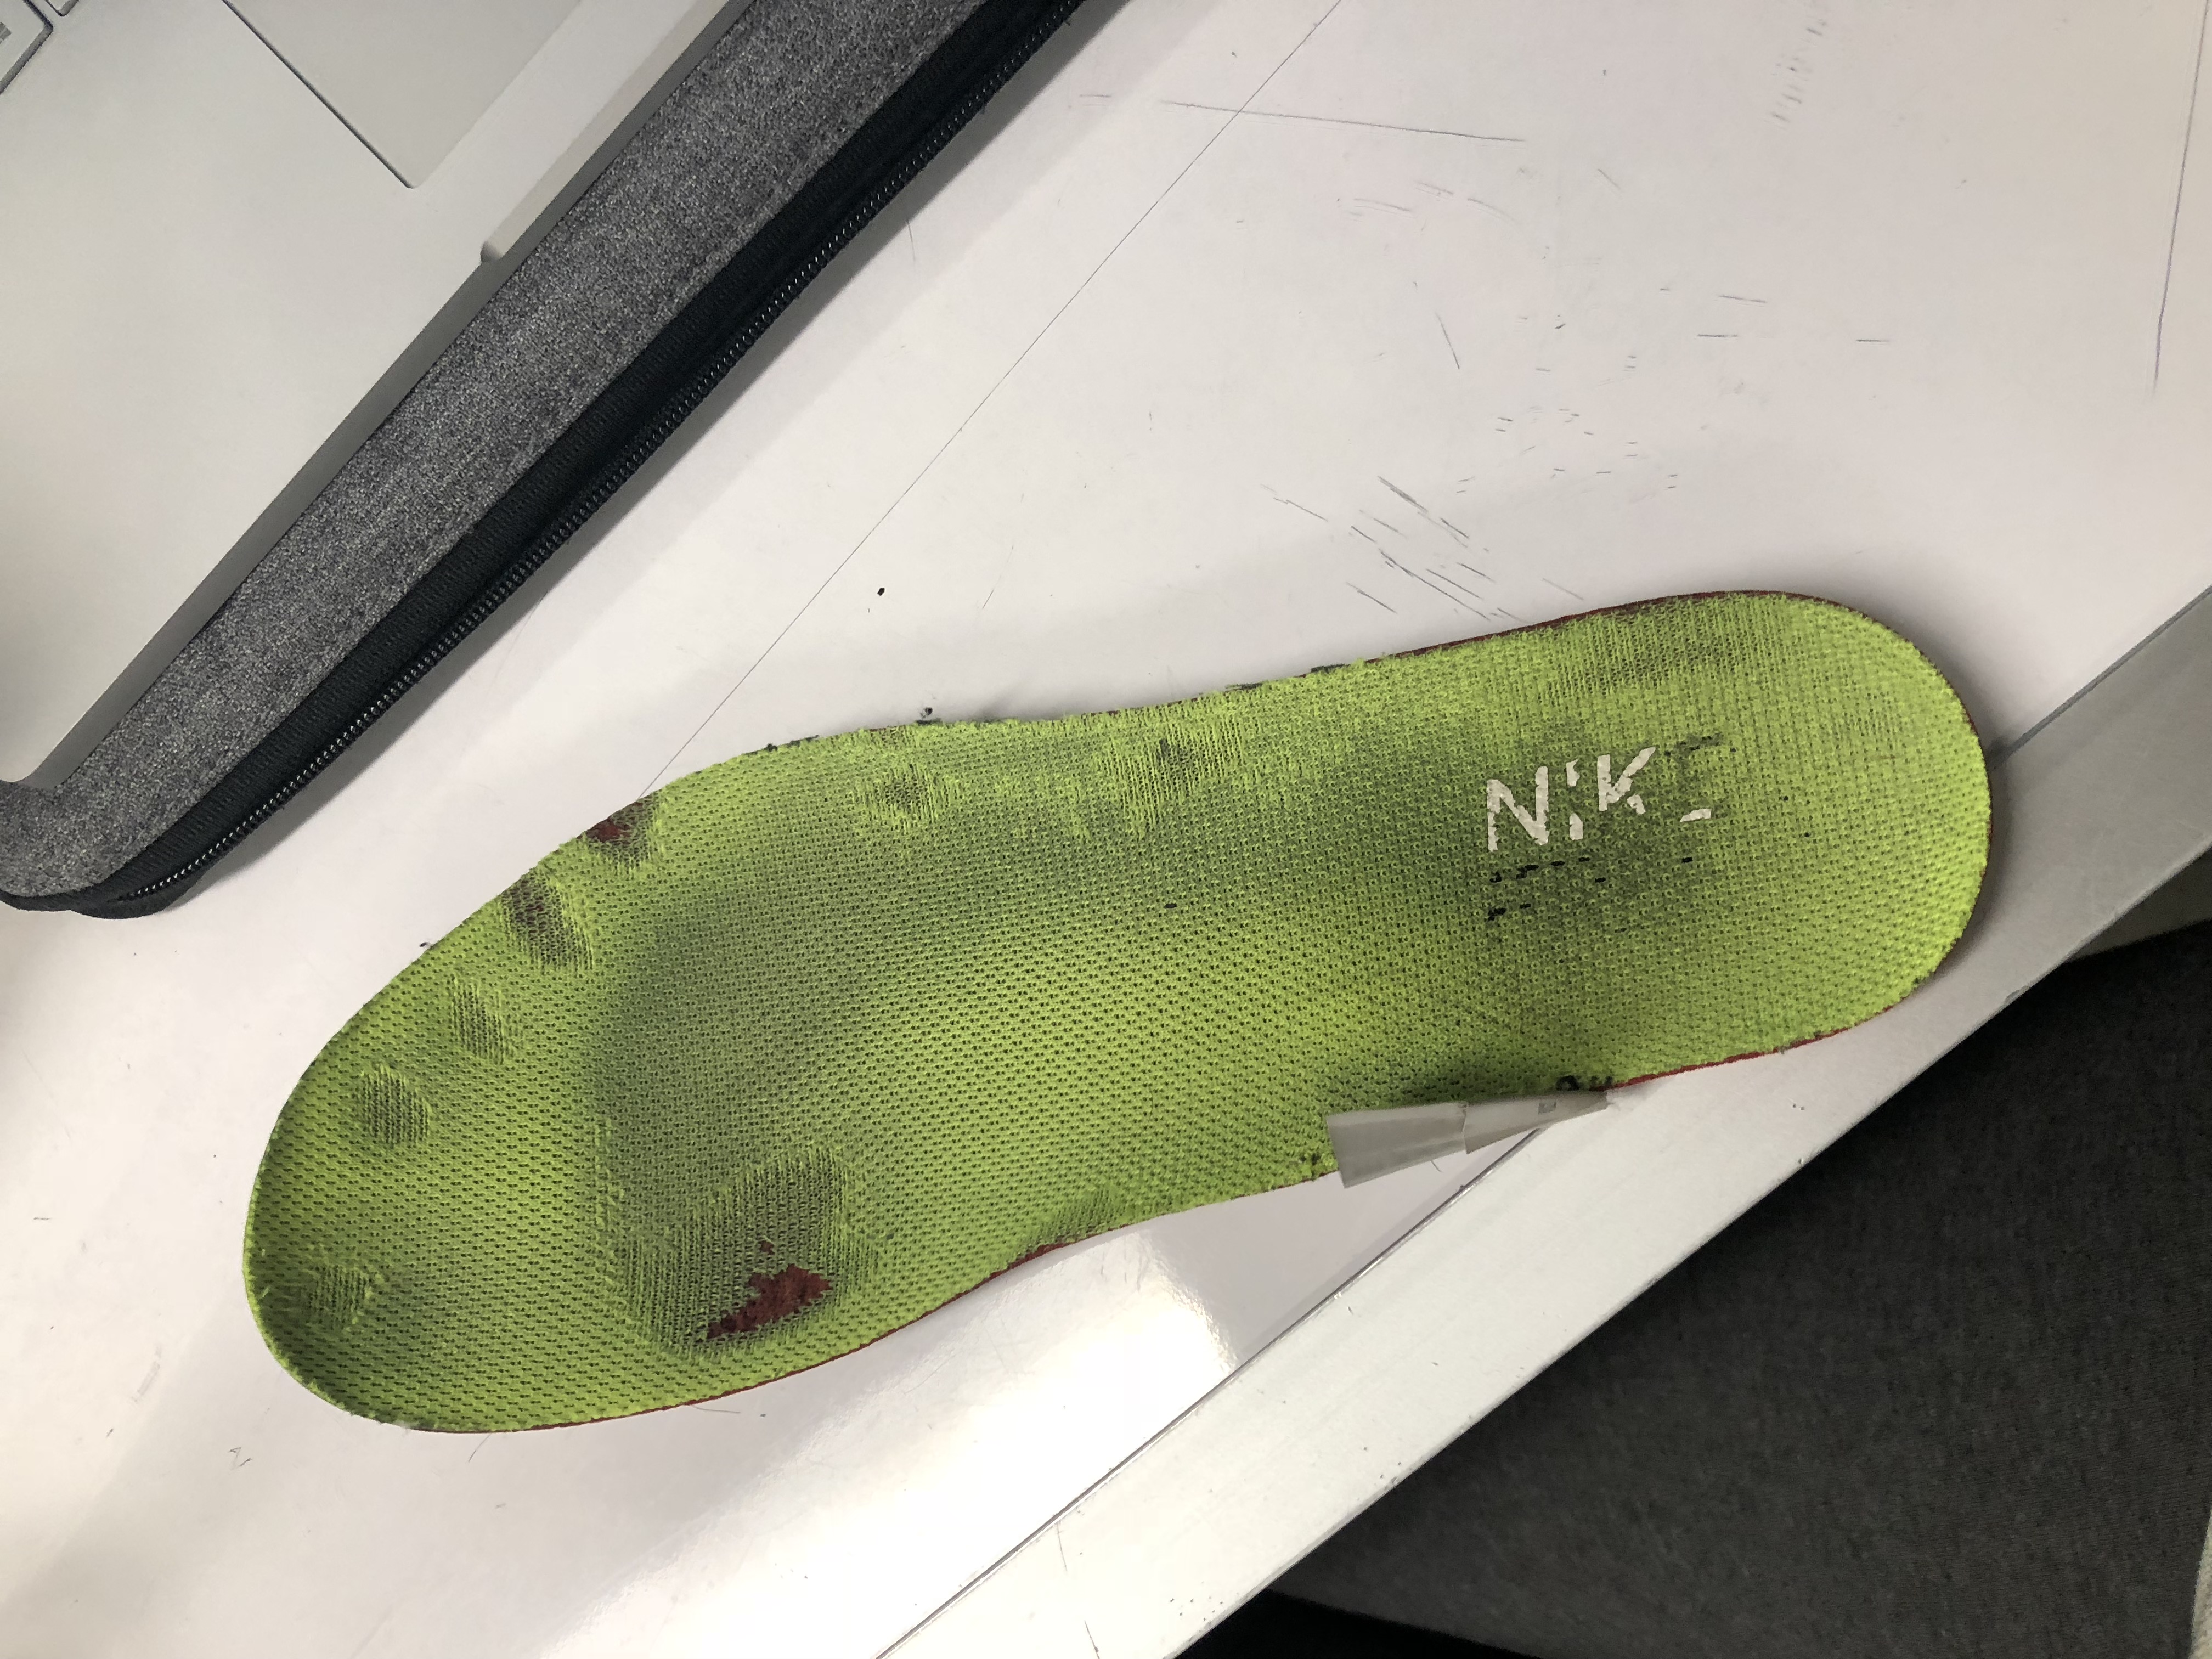
Because I was using an old shoe, it was very helpful, because I could see where I put pressure on my feet, based on where it’s worn out.
That made transferring the zone diagram easier.
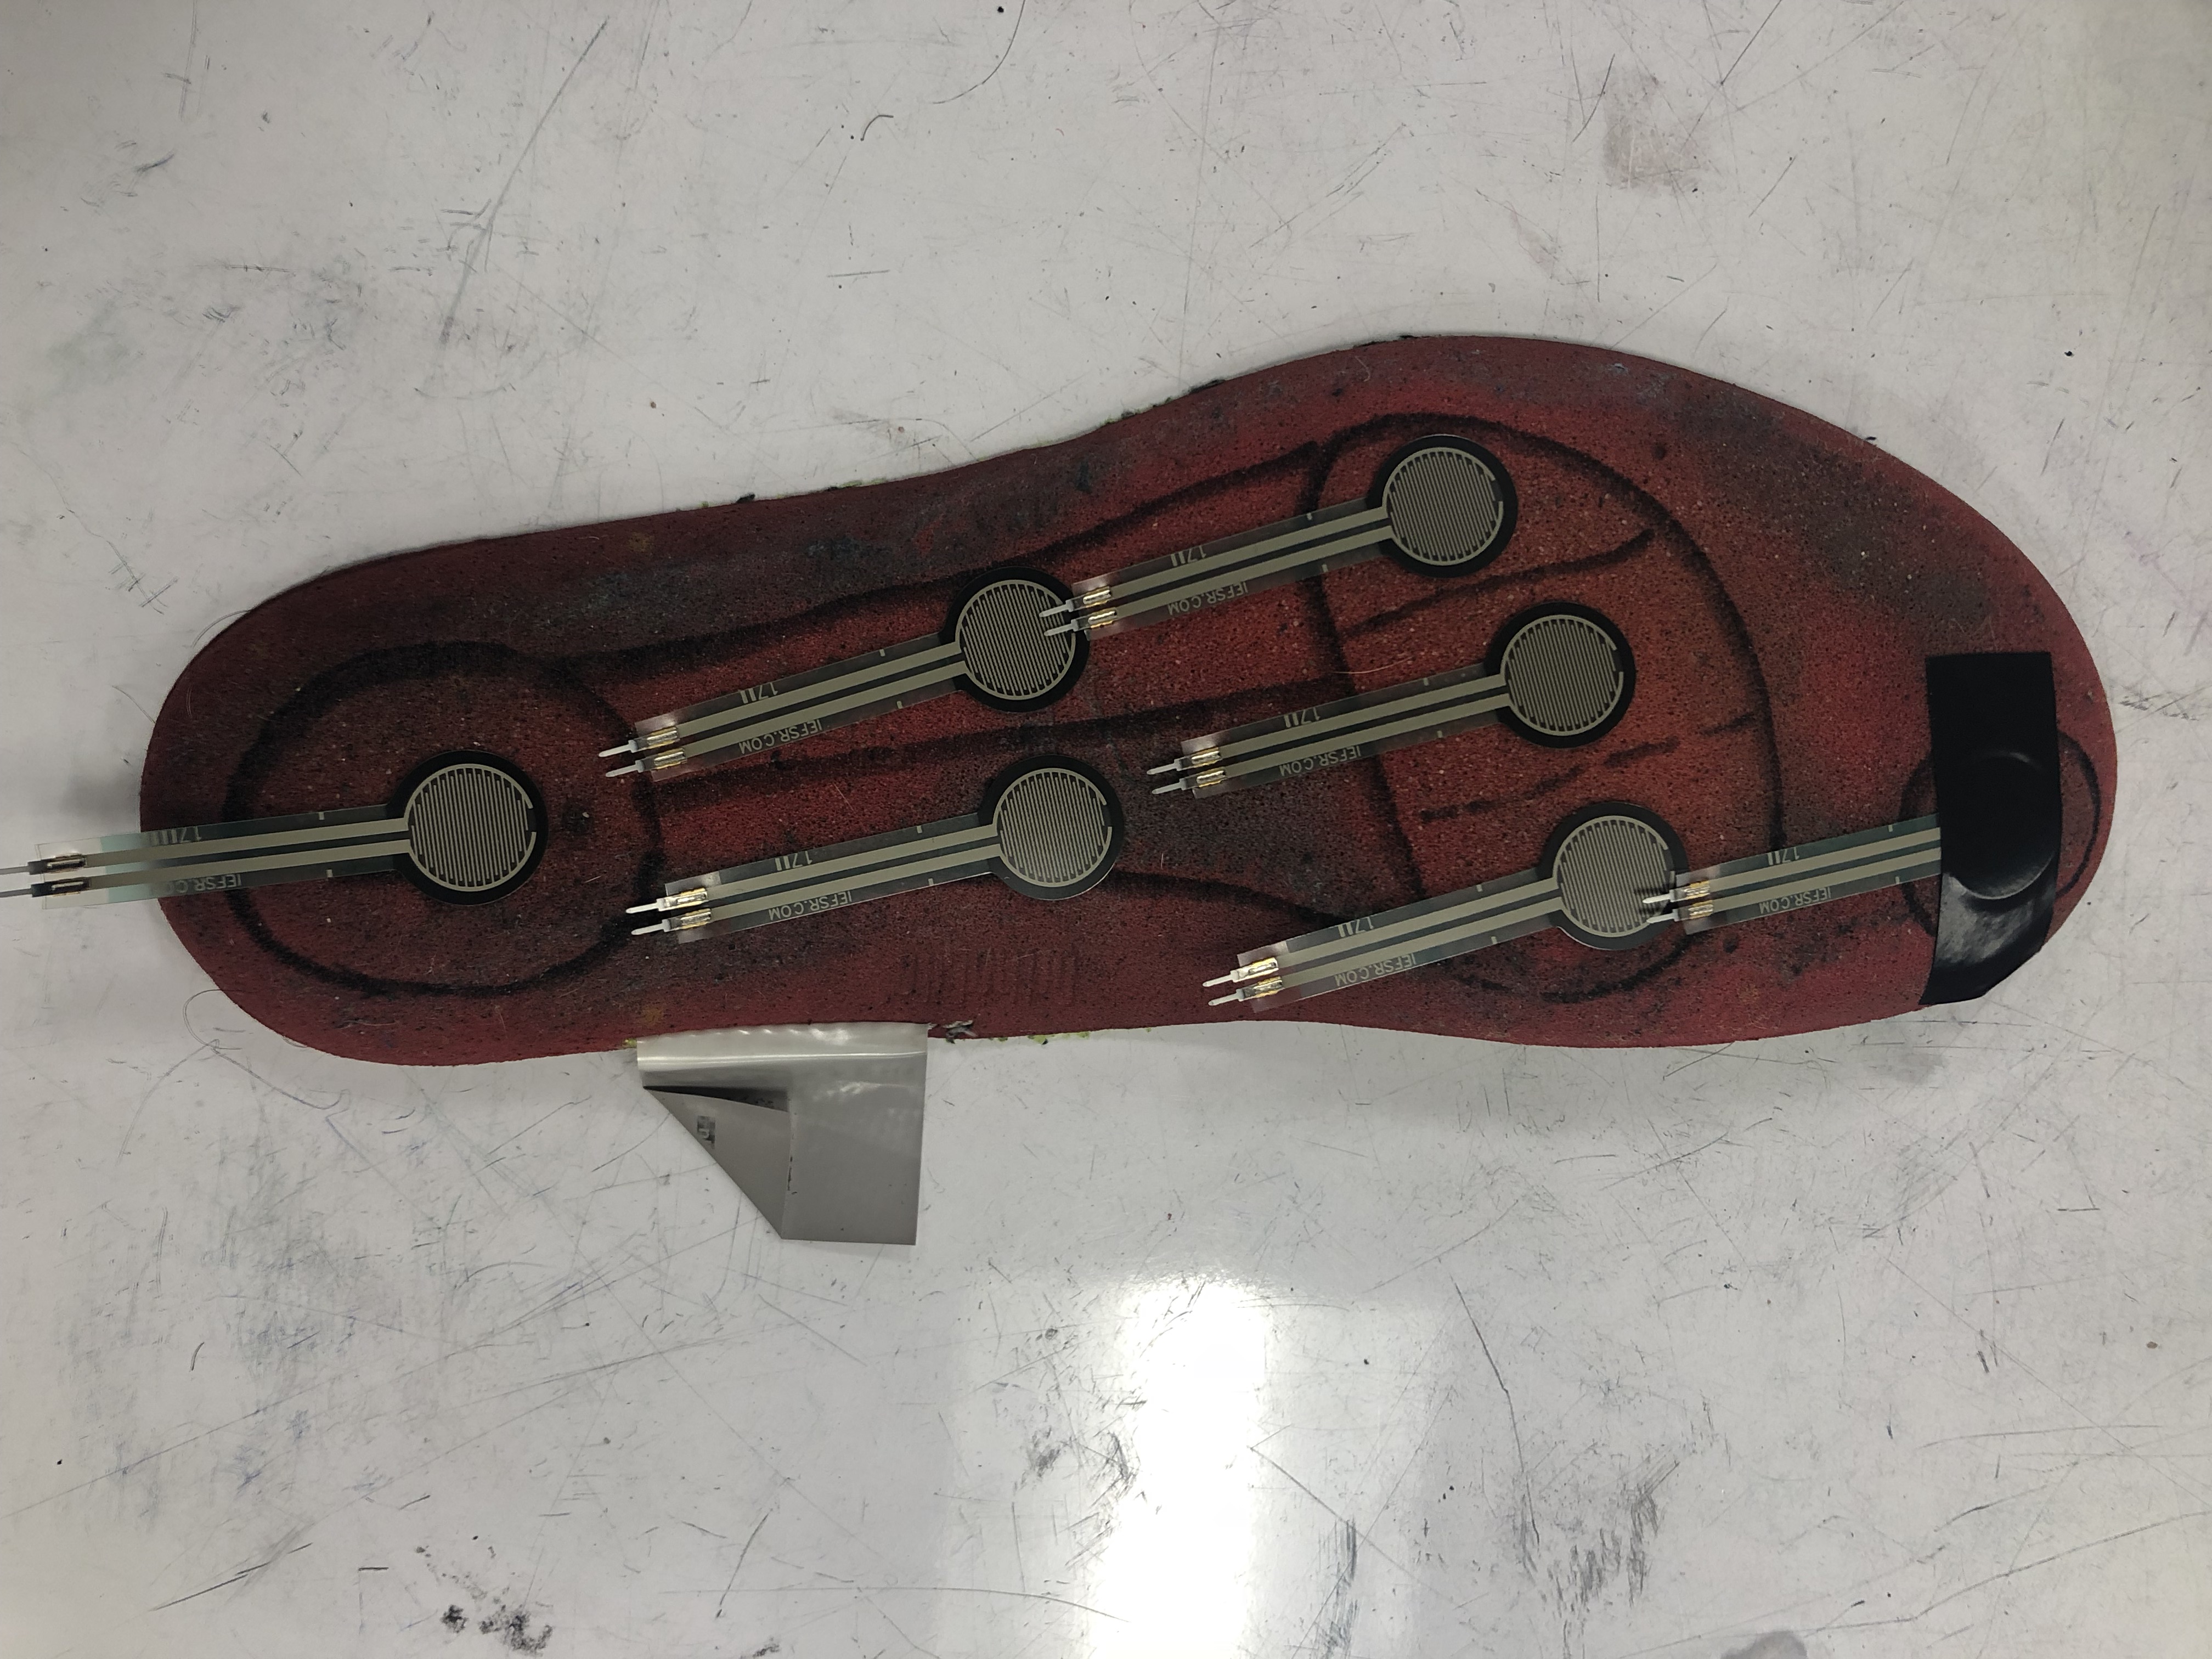
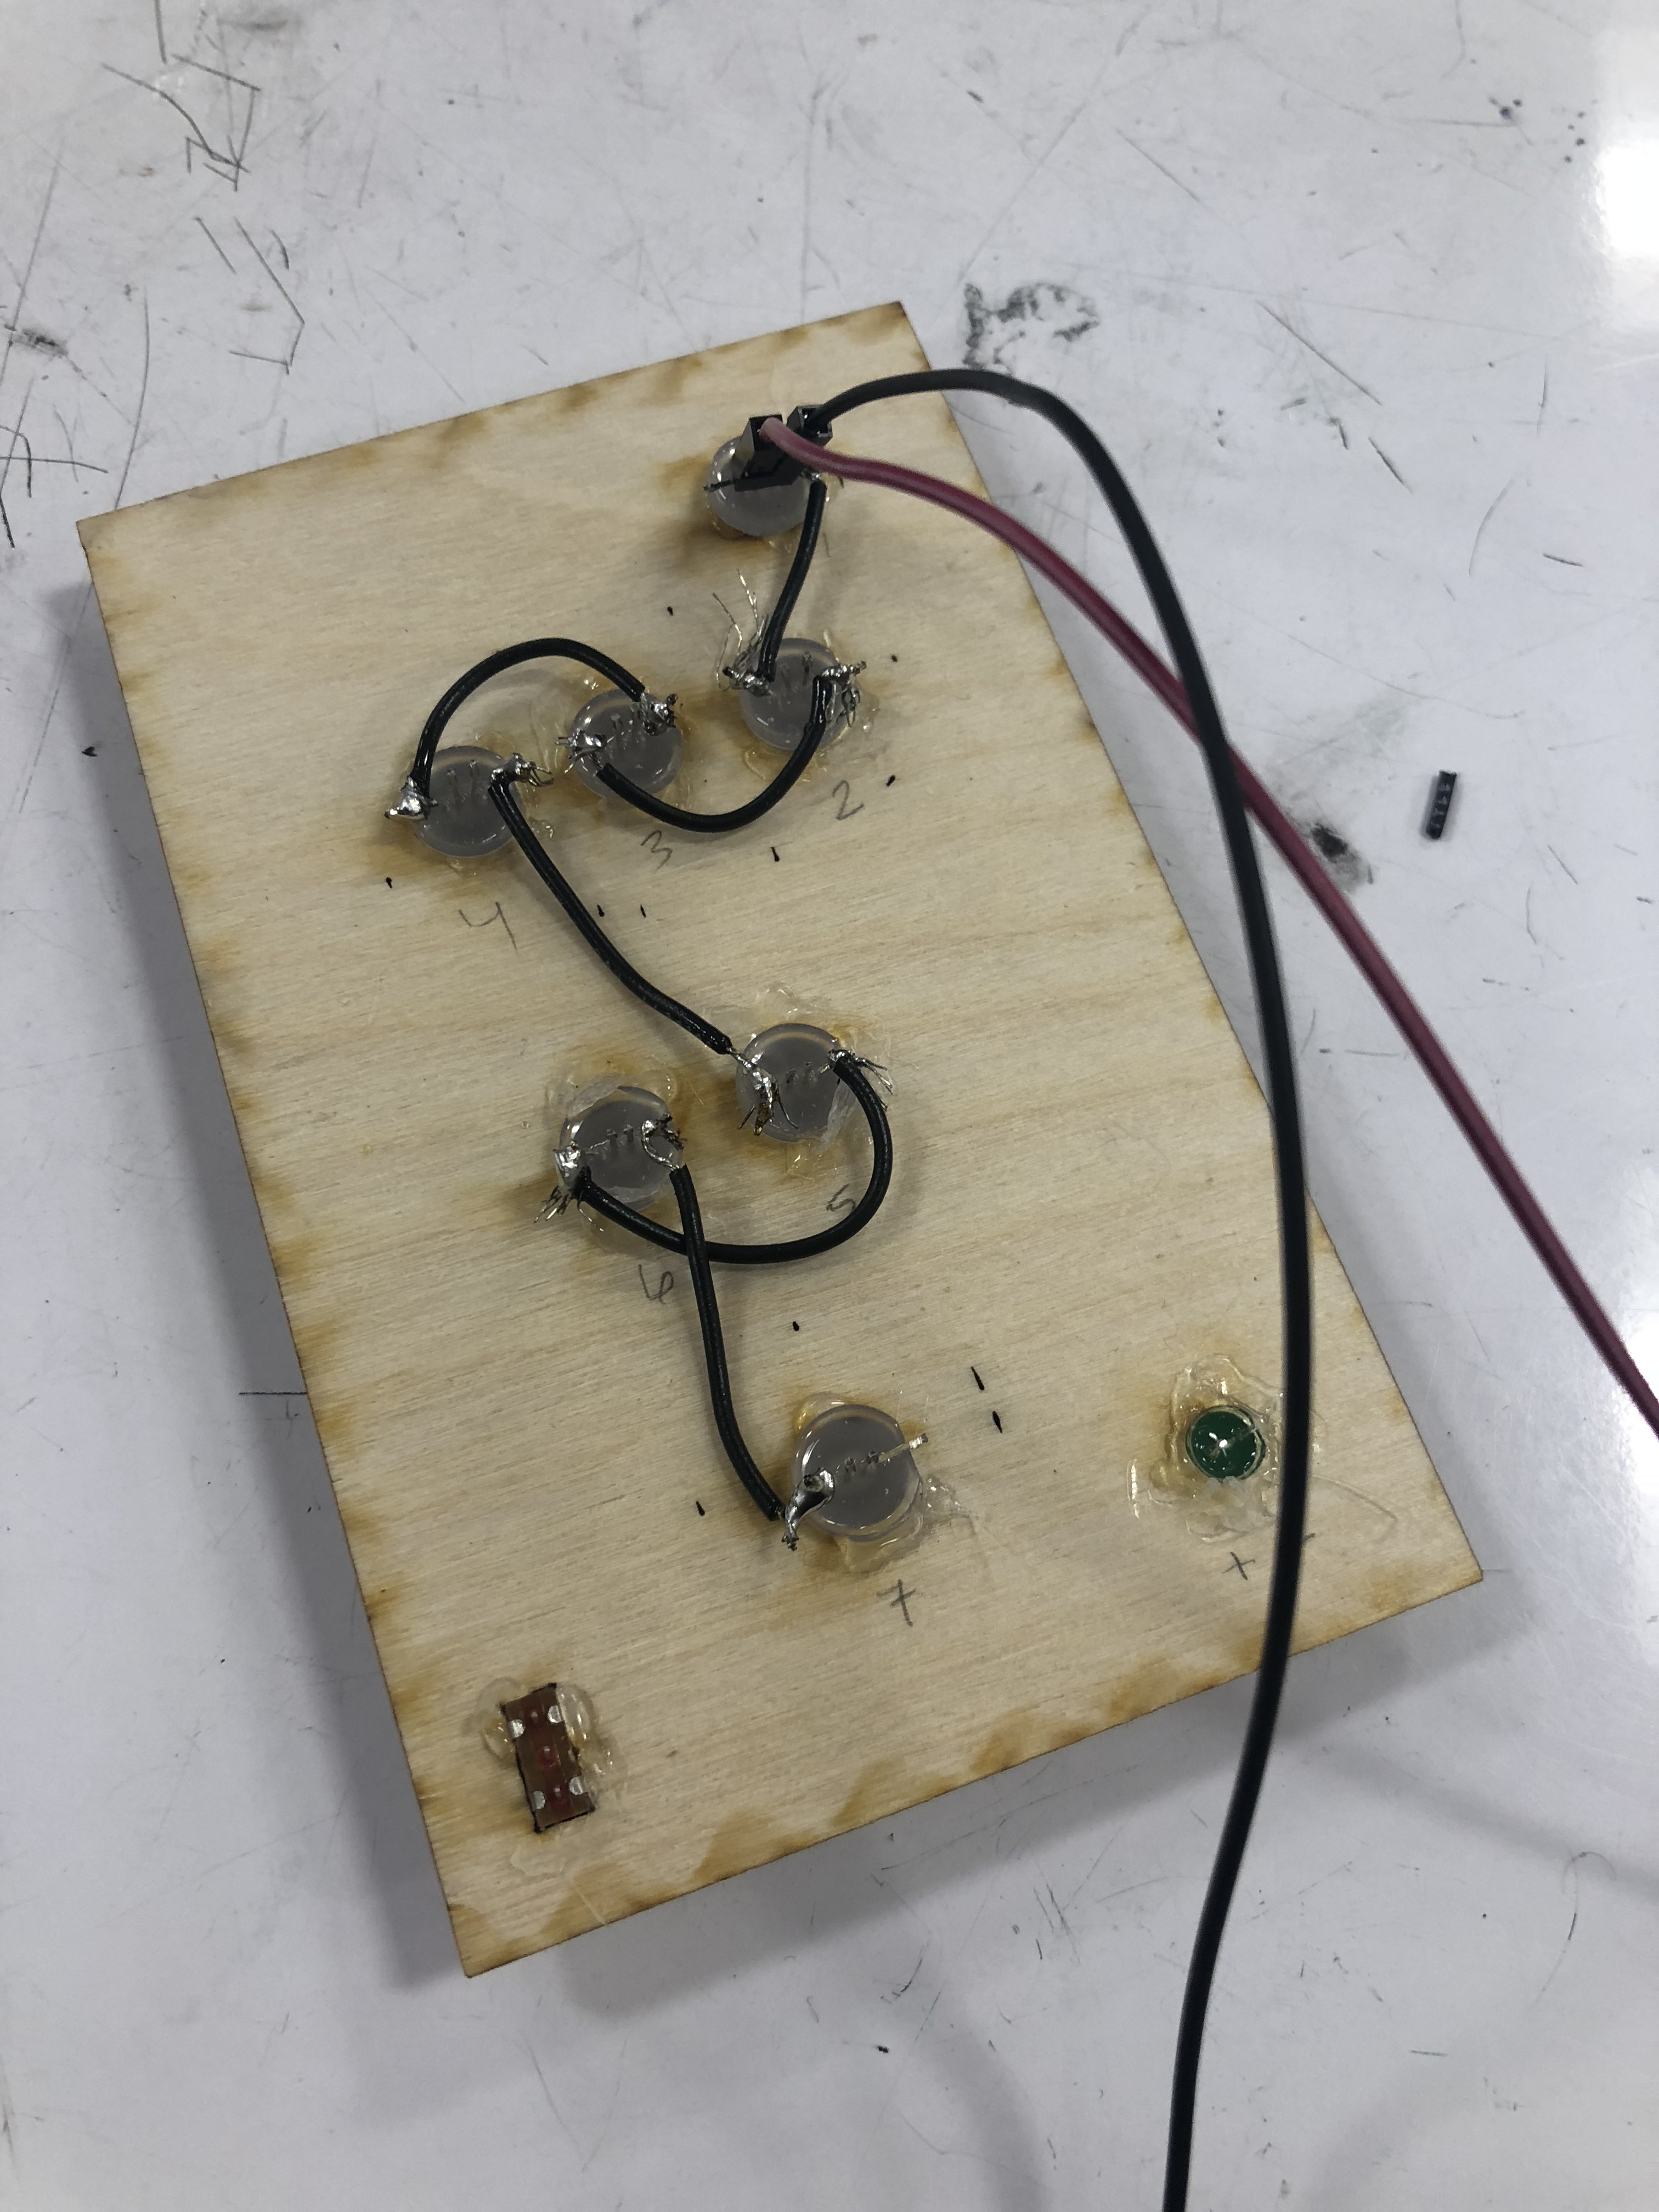
Adding one pressure sensor per zone.
Wiring them up to resisters, power and ground.
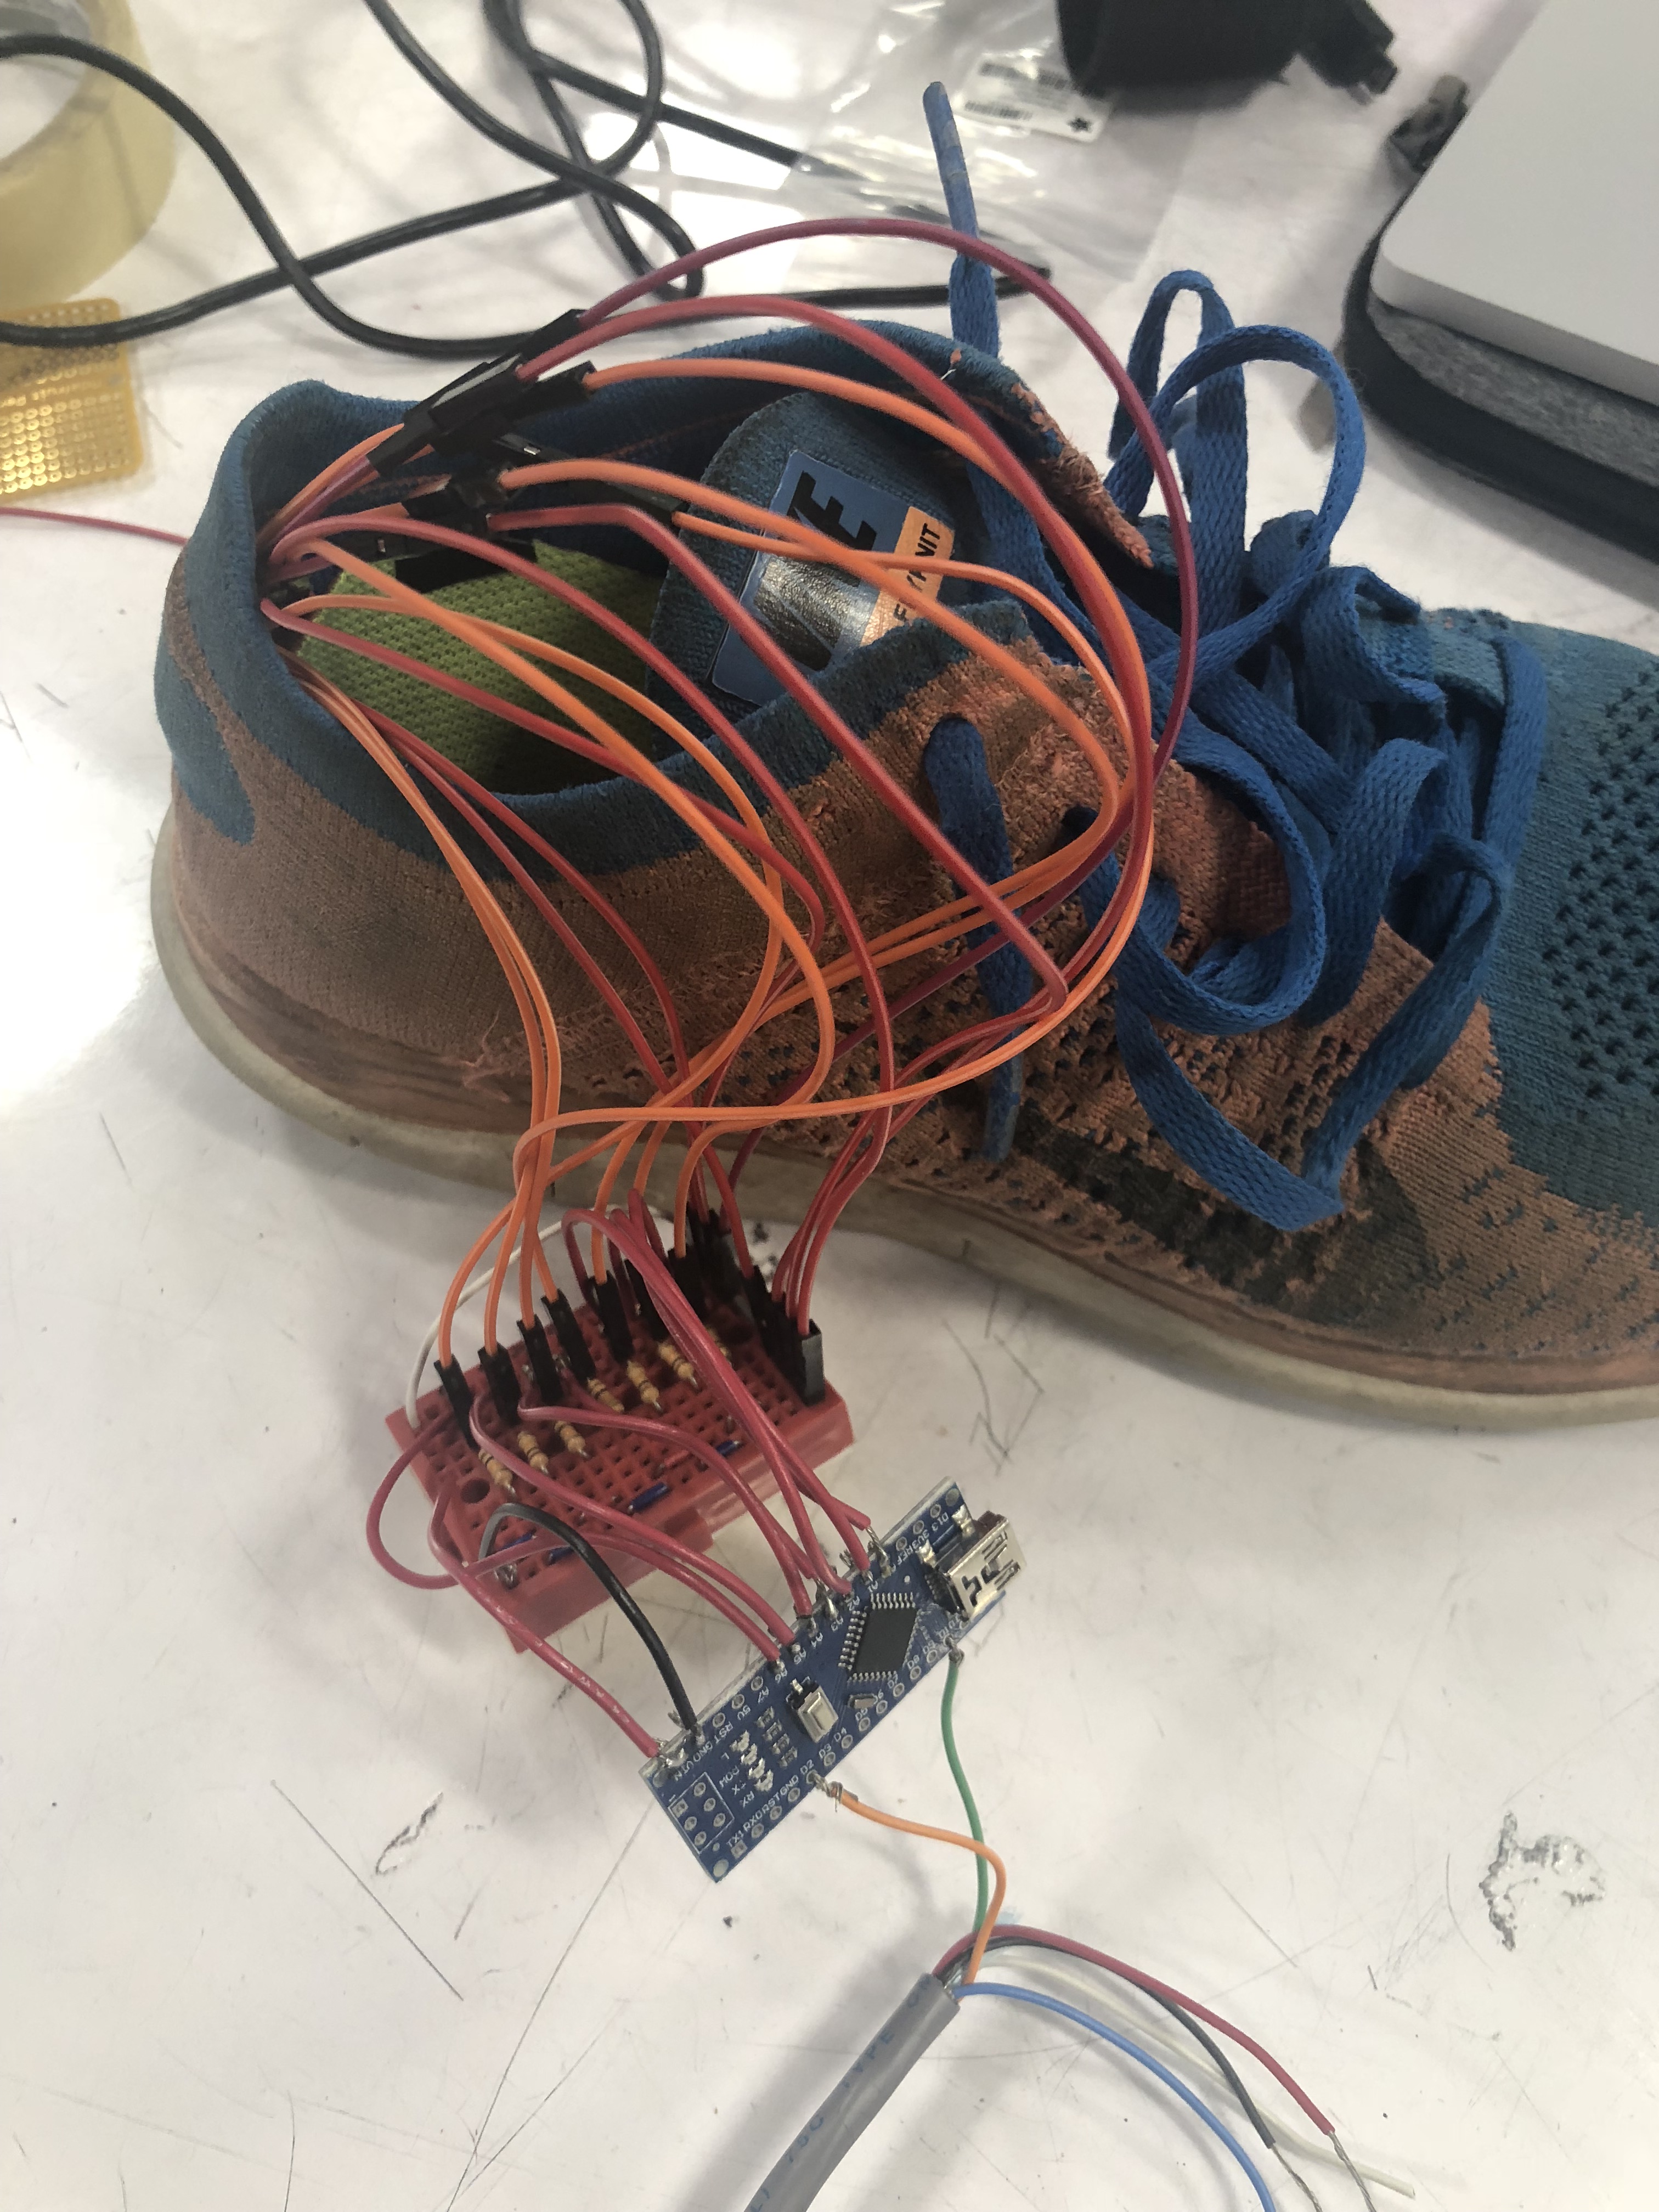
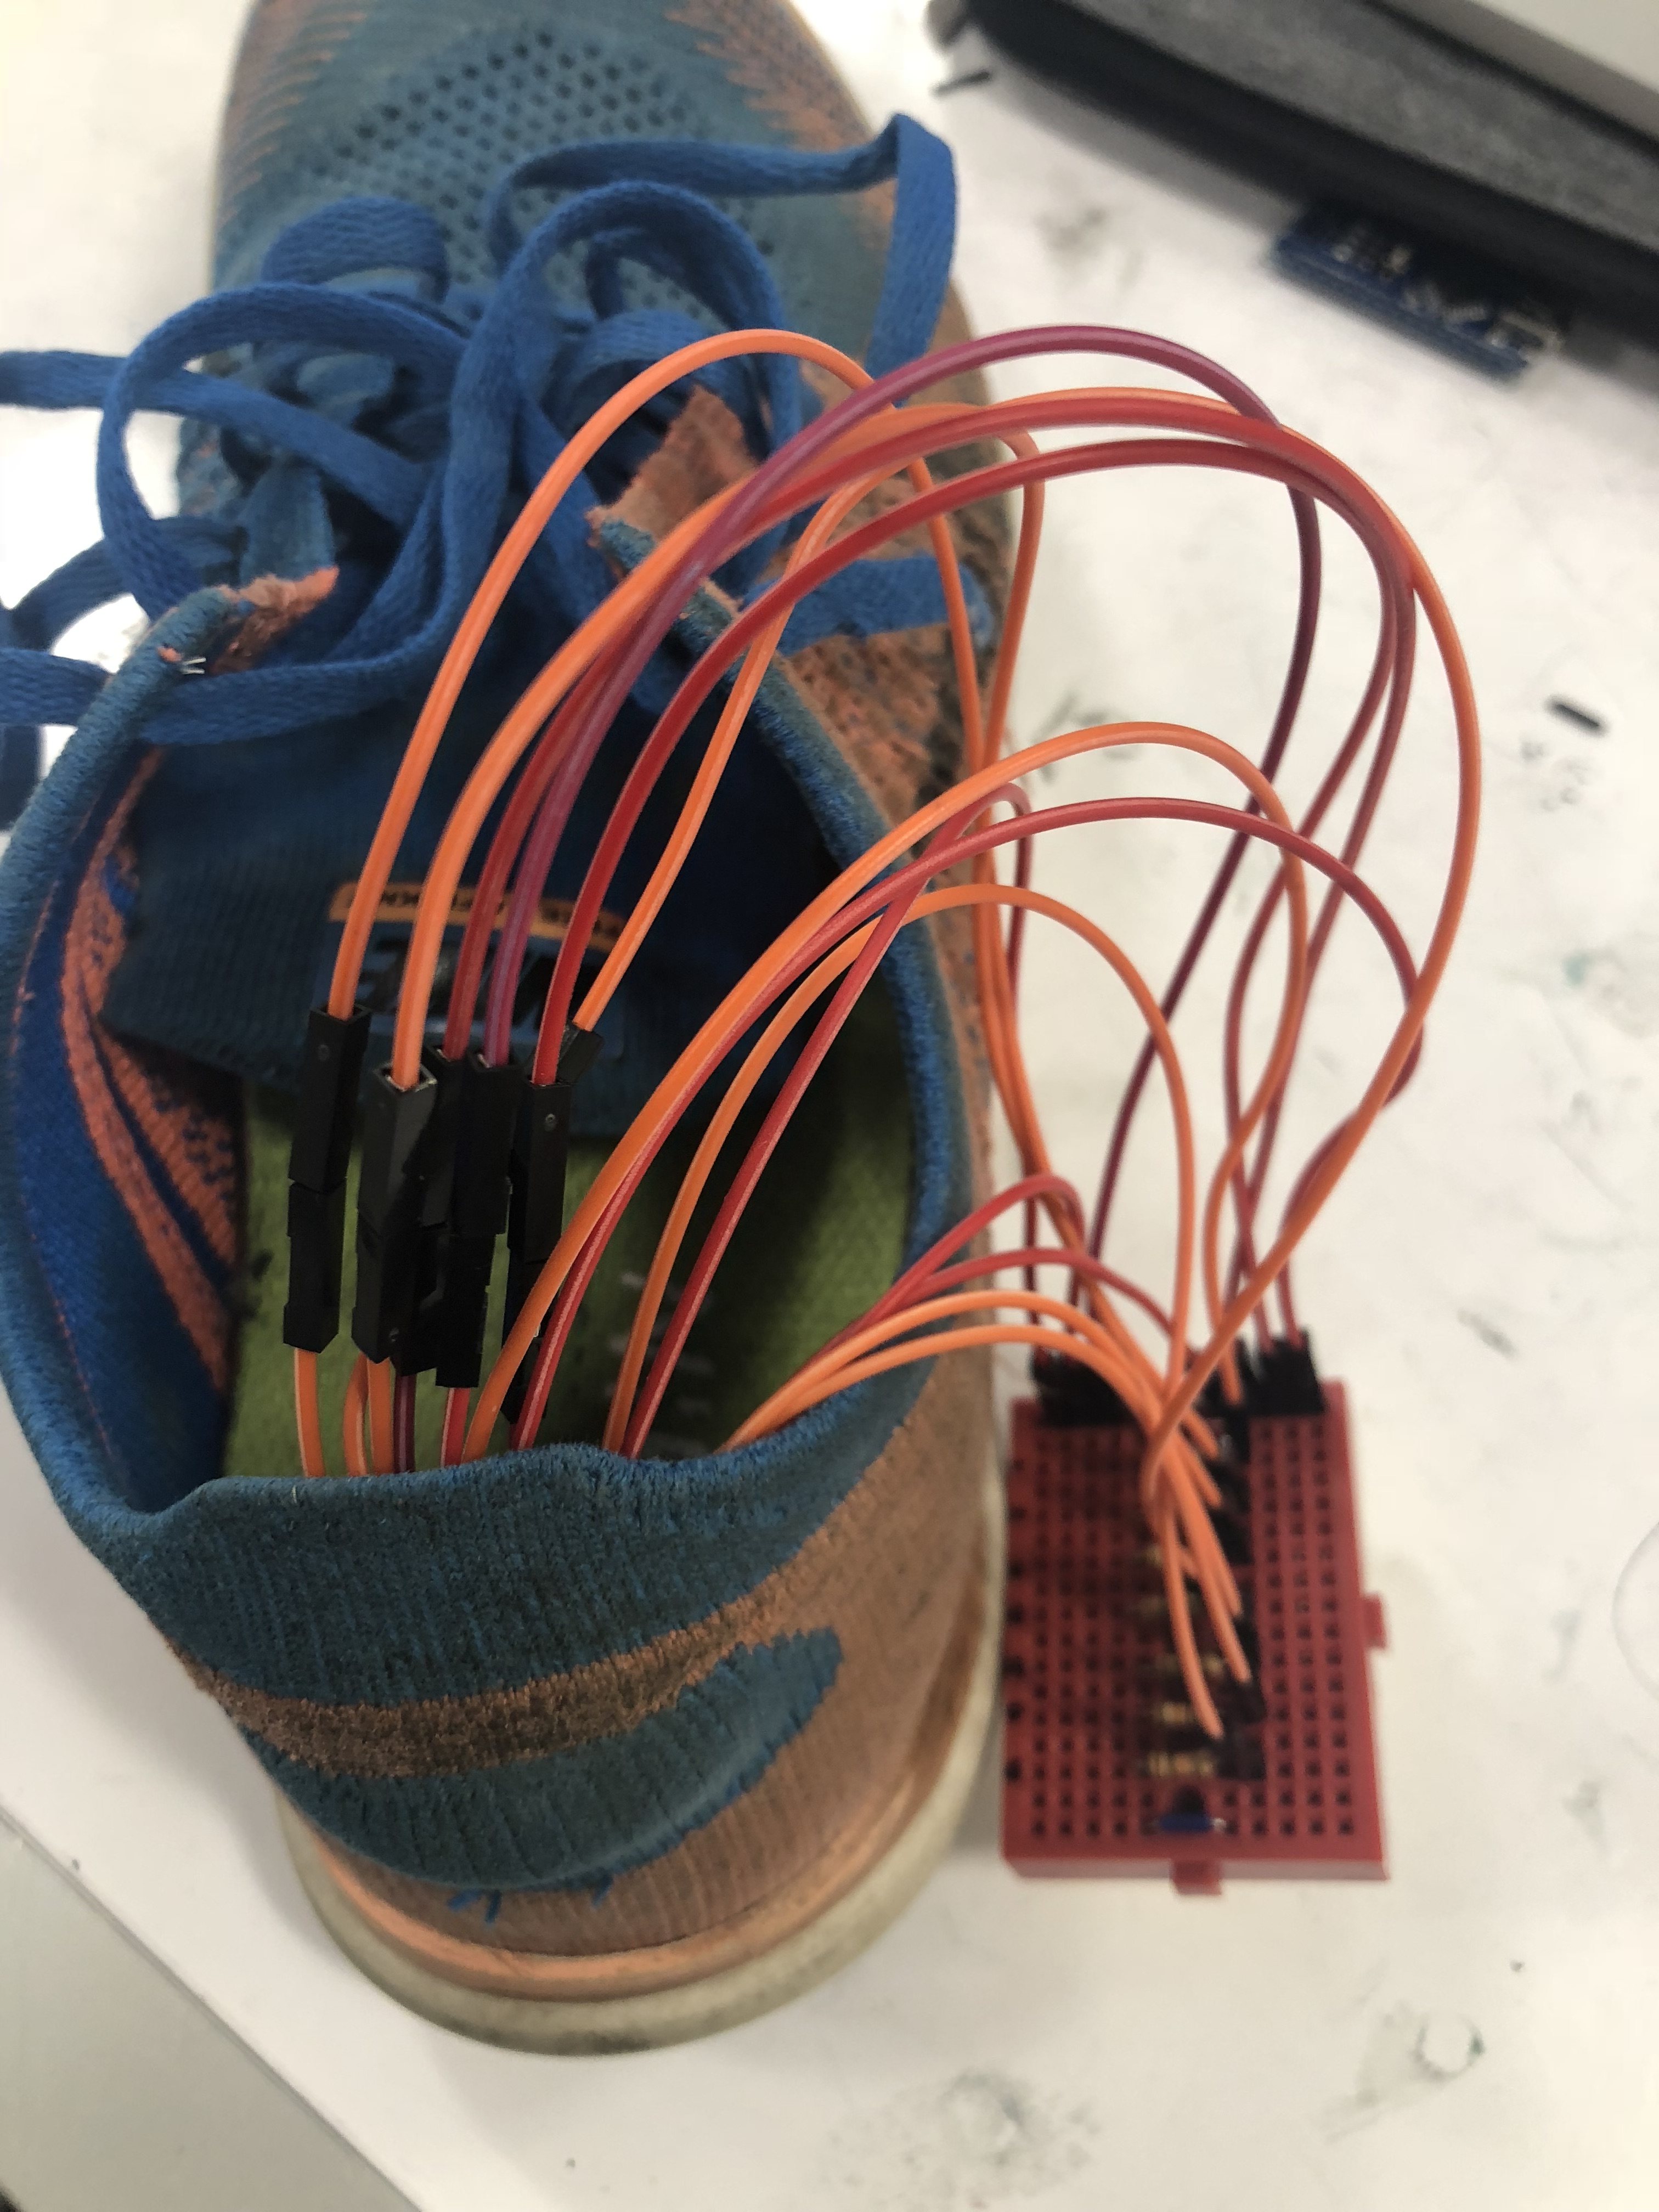
Connecting each sensor to its corresponding input pin.
The biggest issues I faced in this part was the fact that I was working with so many sensors and so some of them would shift out of place and disconnect, specifically, the ones higher up in the shoe.
Once the shoe part was working well, it was time to transfer the LEDs to a handheld housing
Part 3: building the LED housing
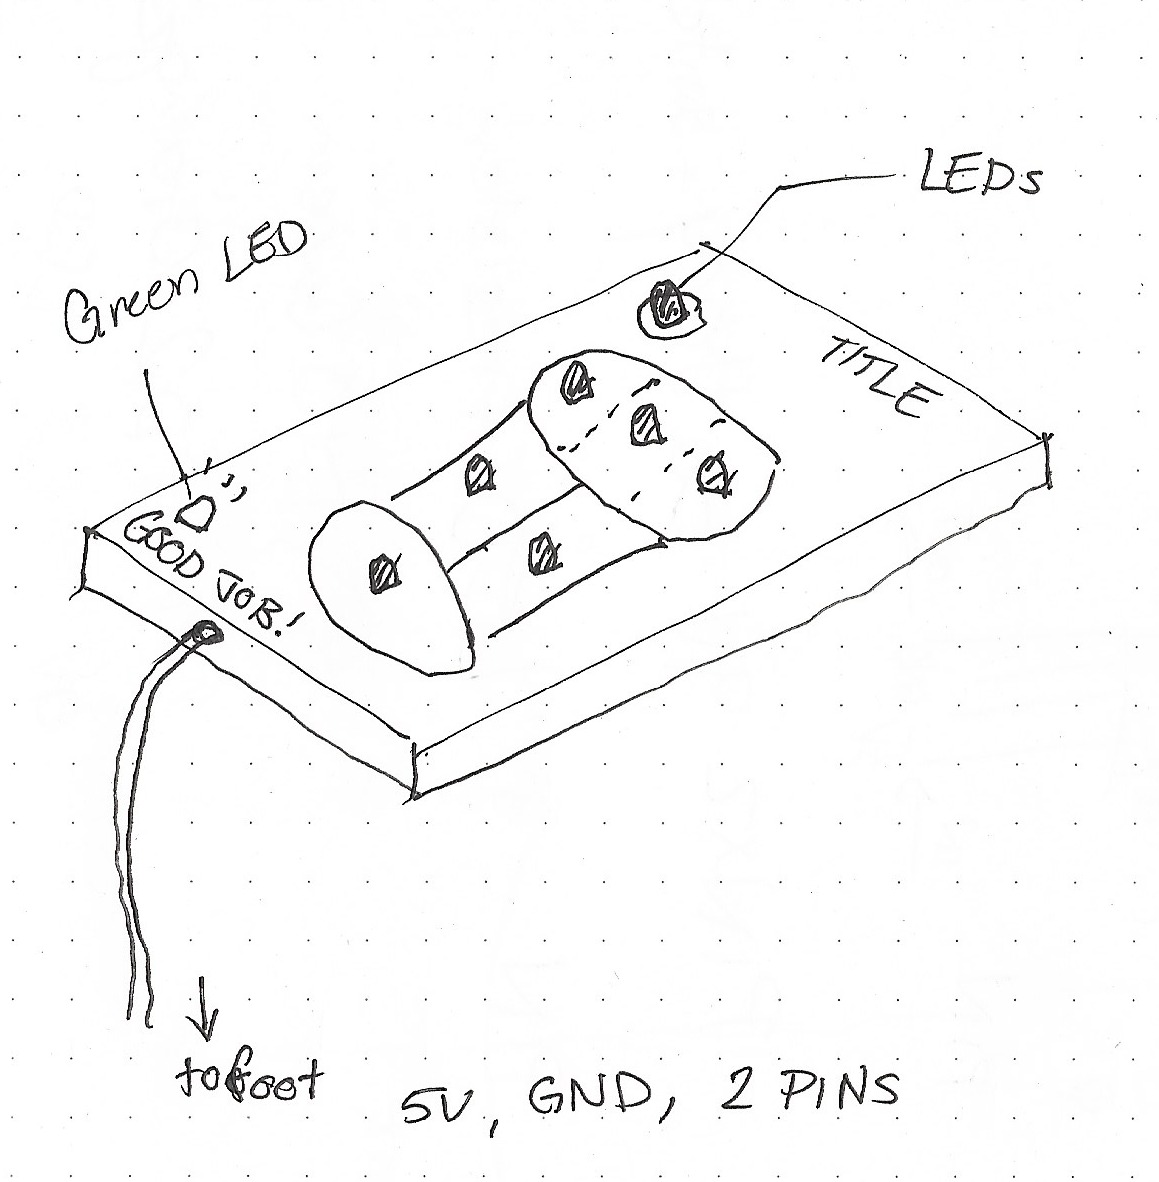
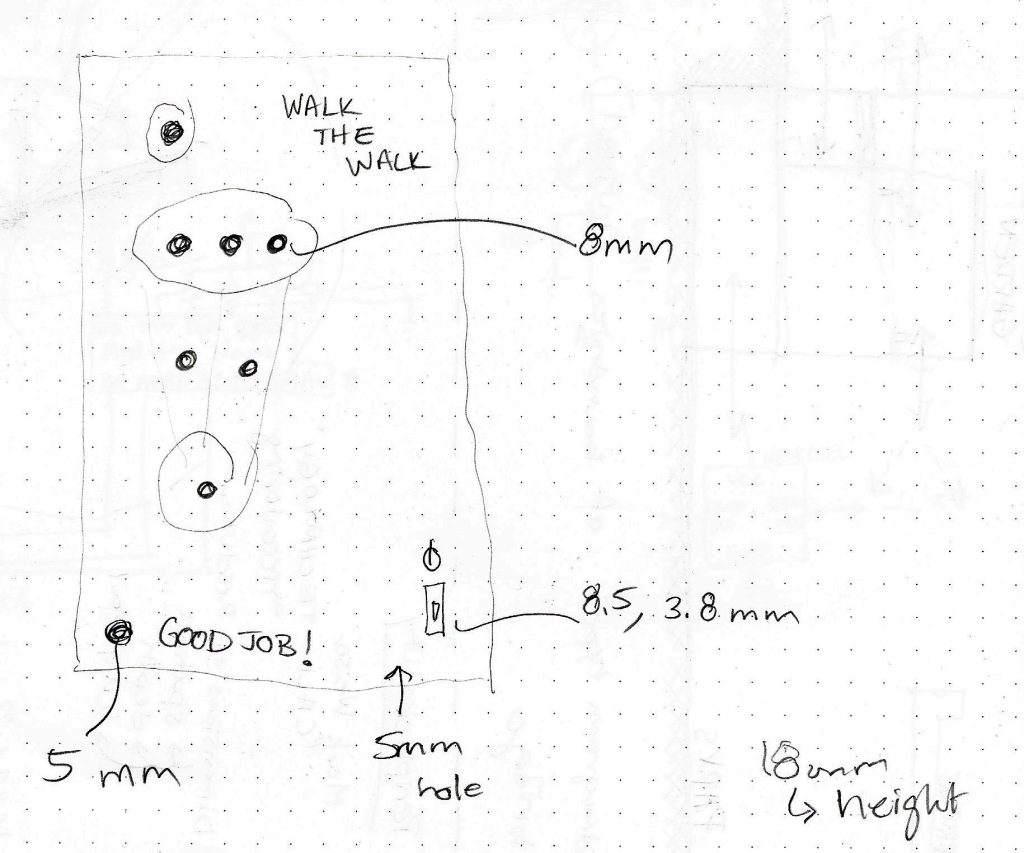
Sketch of the way I visualized the handheld device.
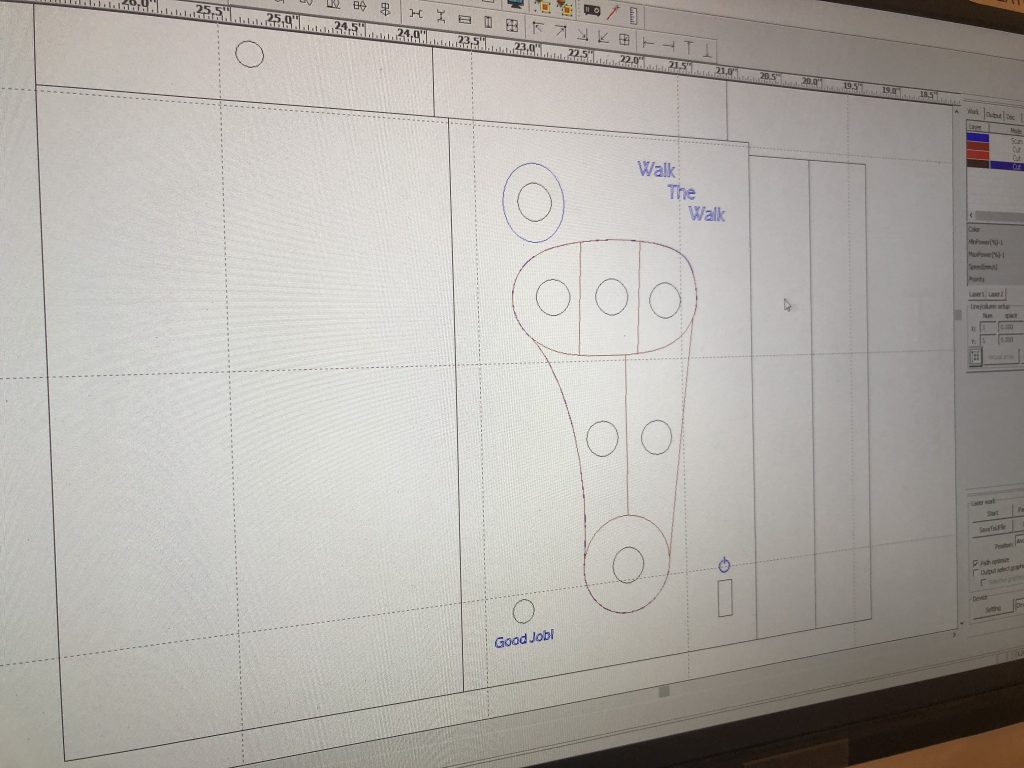
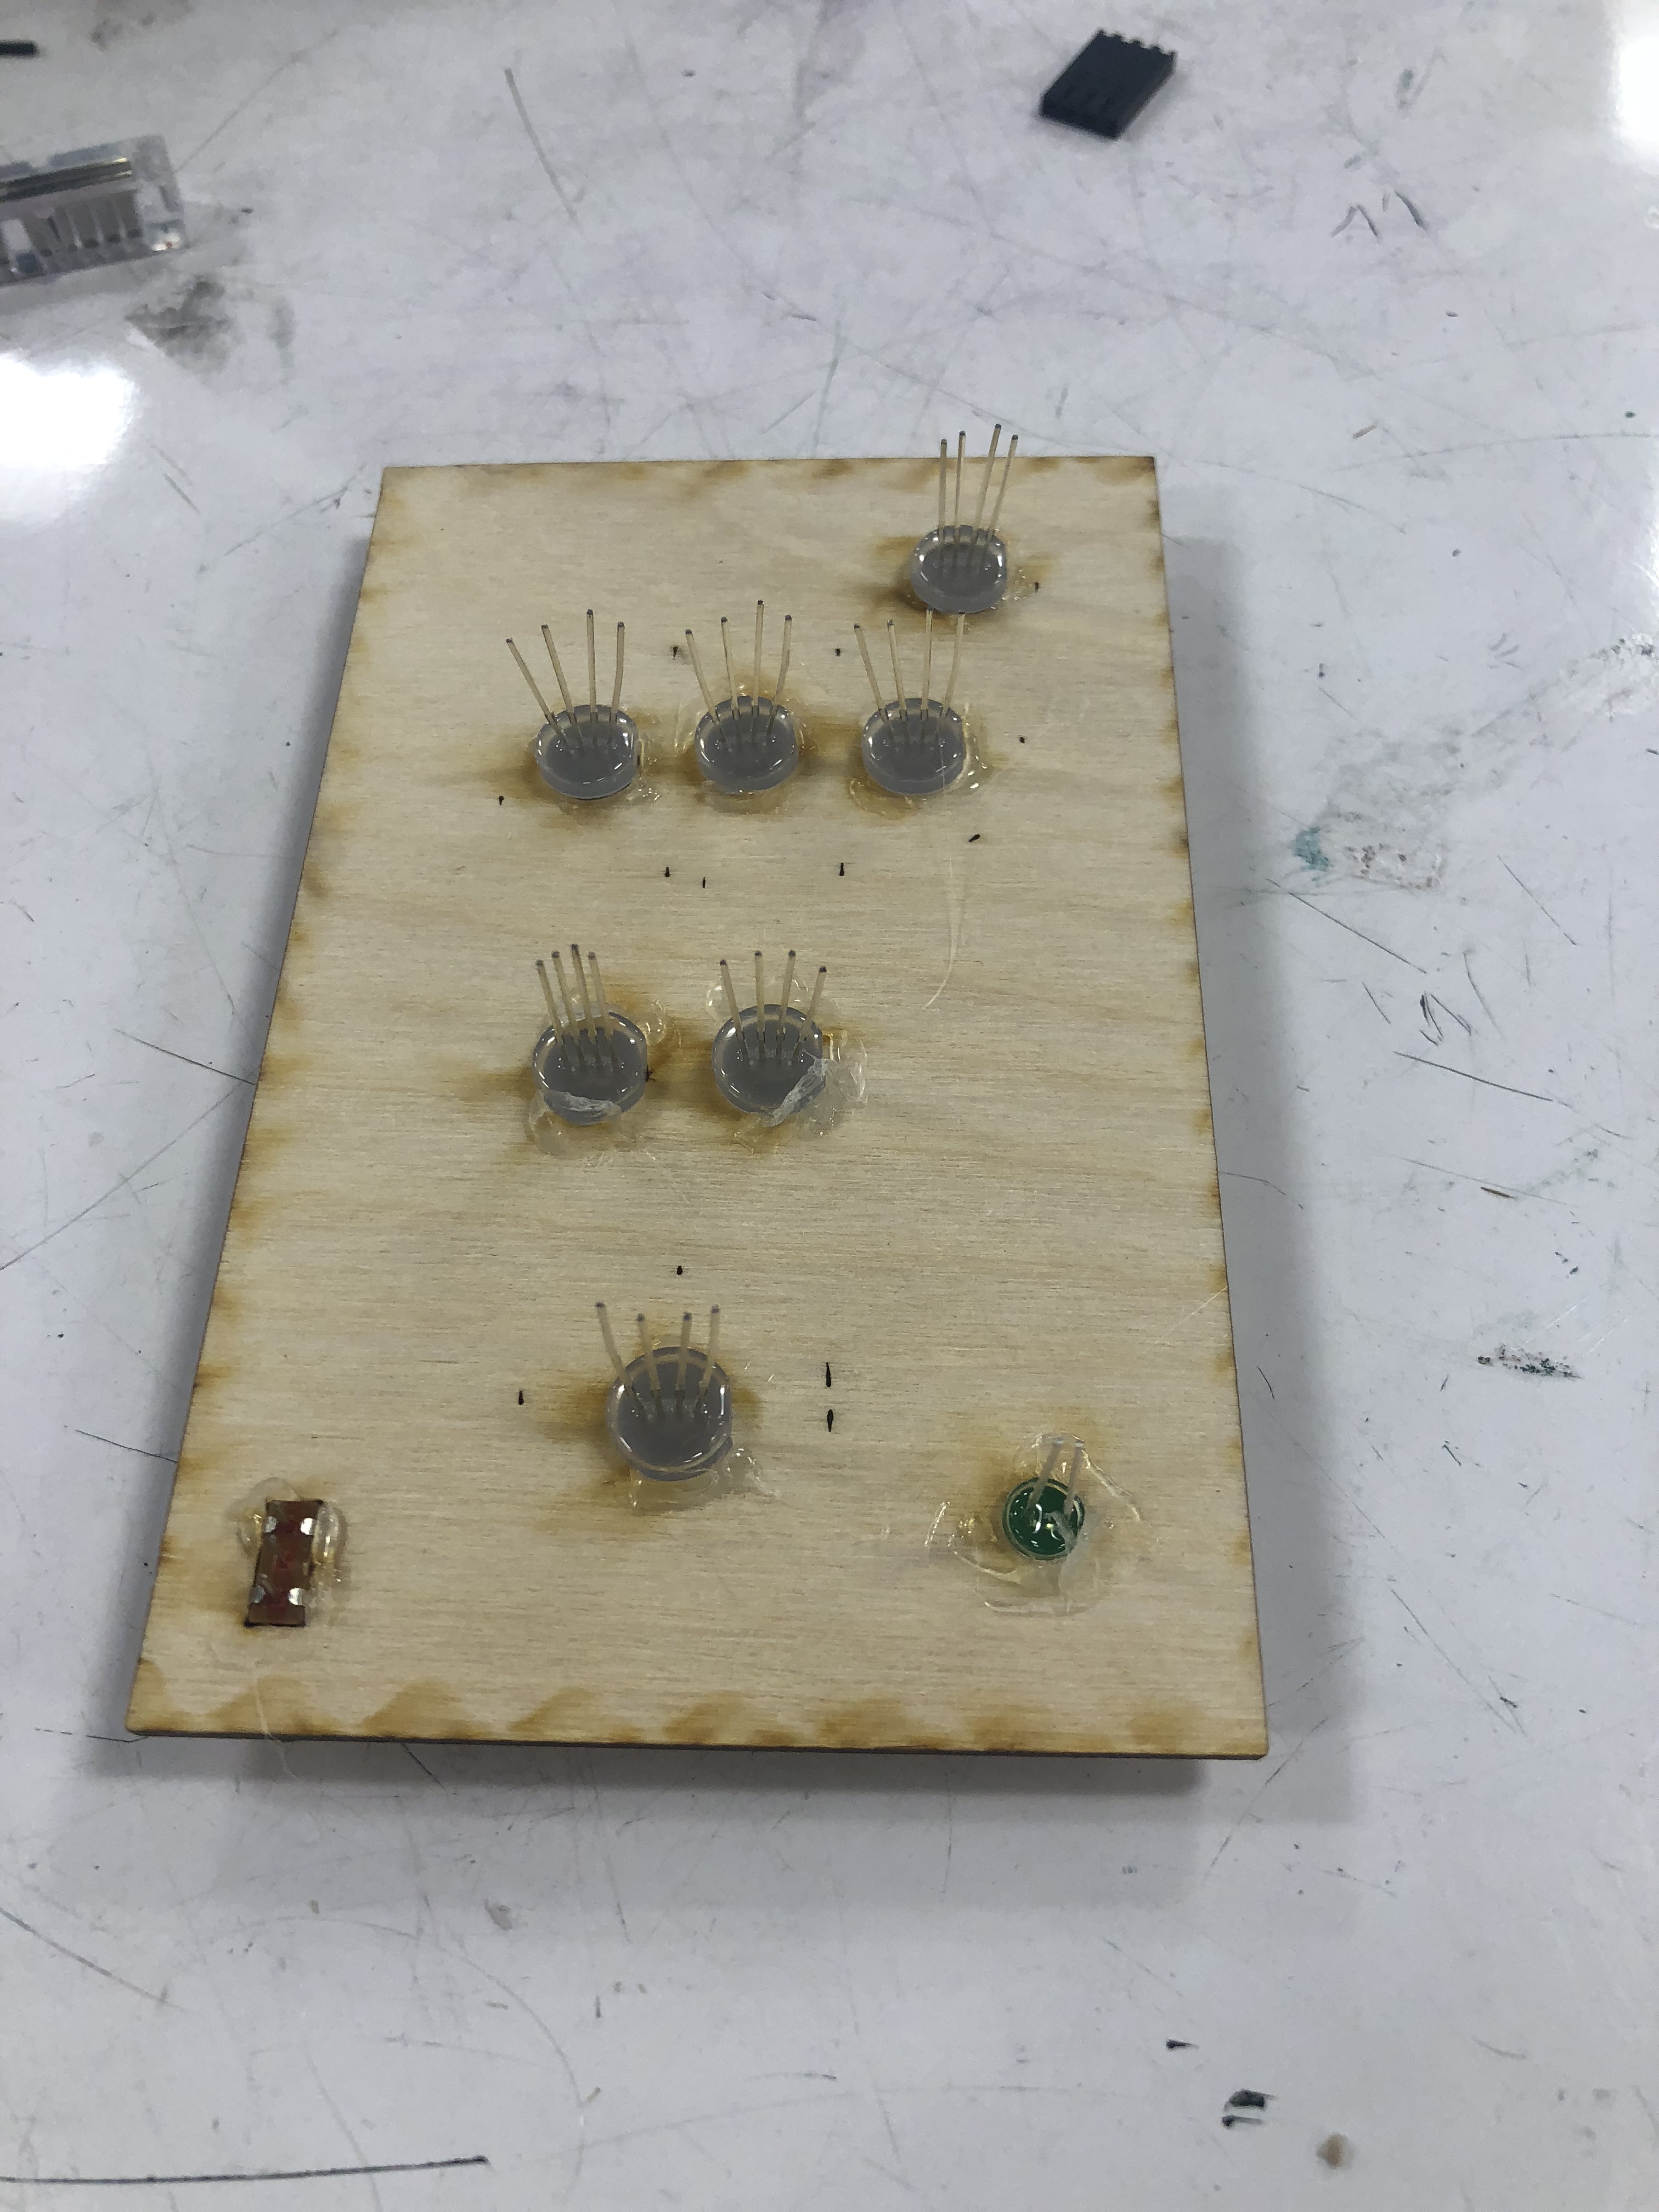
Digitization of sketches, and laser cutting the pieces.
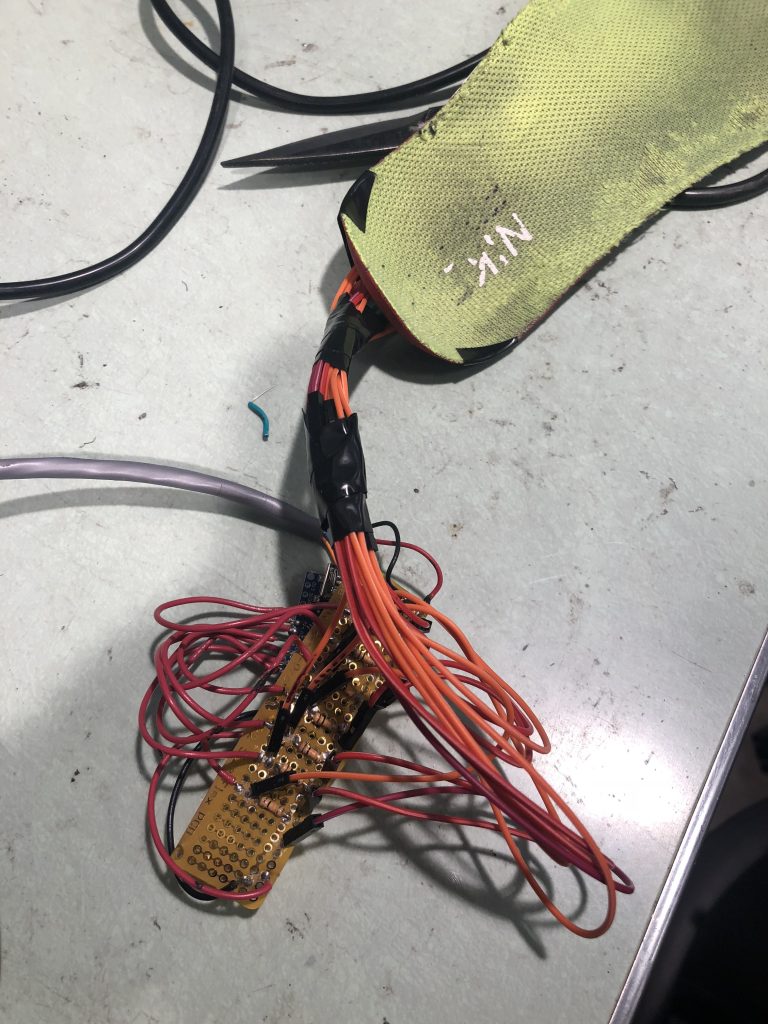
PART 4: making the anklet and combining the LEDs and the pressure sensor
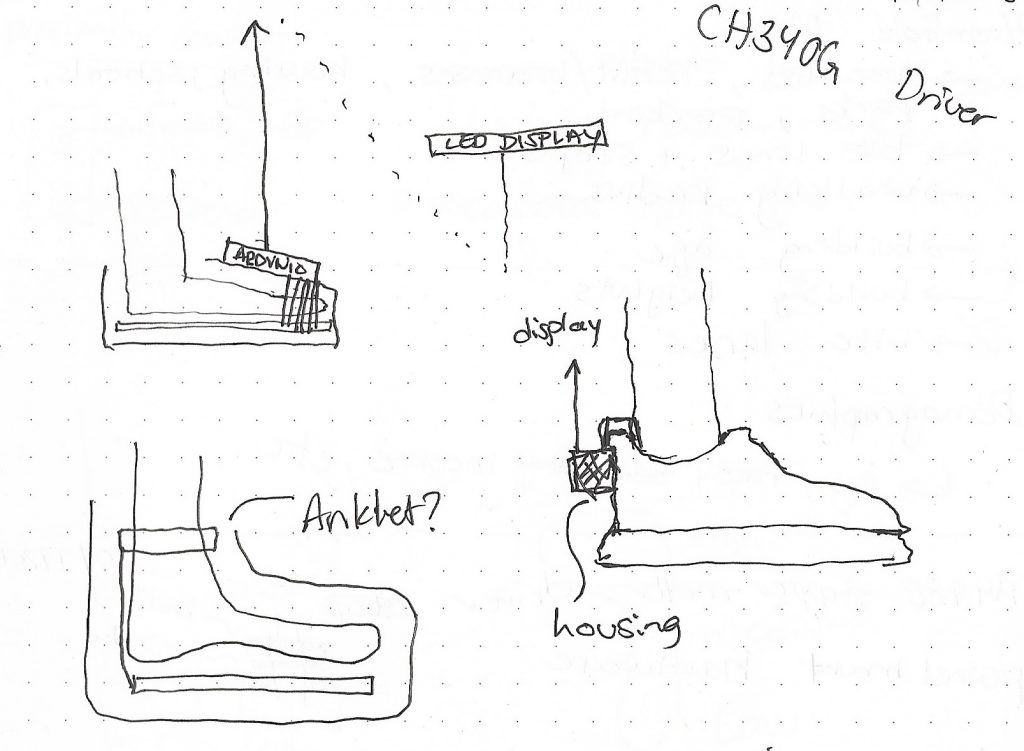
Figuring out where the best place to put the connecting housing.
Since this device involves a lot of user movement, I thought an anklet would be the best approach. I wanted to make the anklet as small and least intrusive as possible, so I used a flex soldering board.
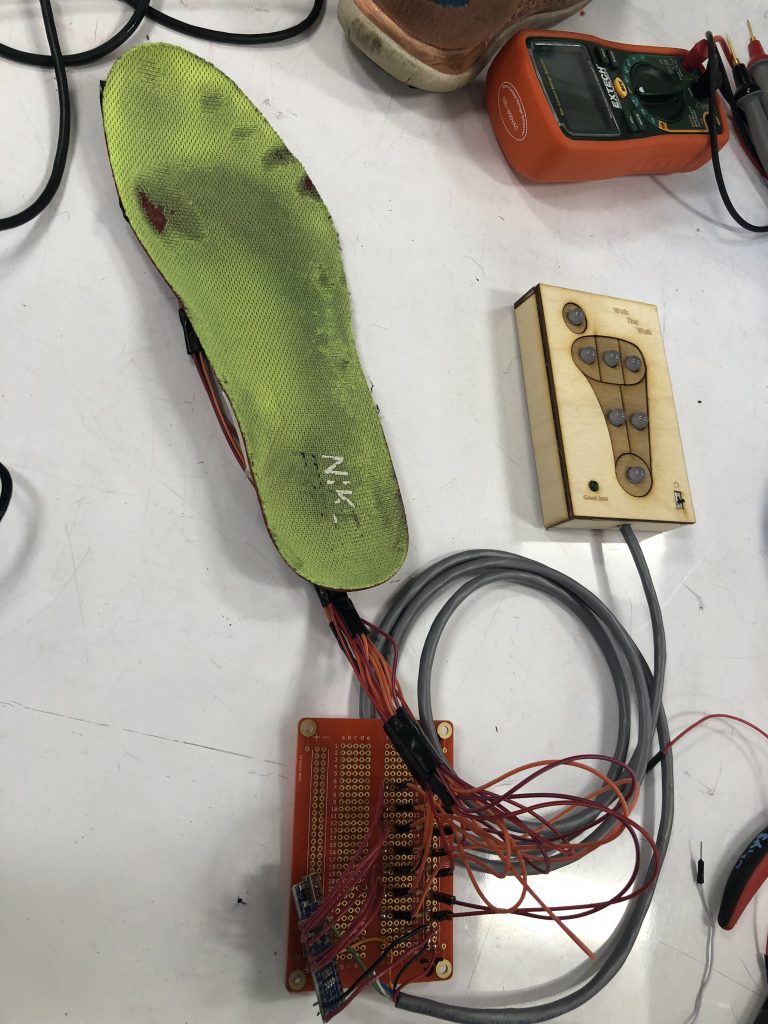
Connecting the shoe to the handheld device.
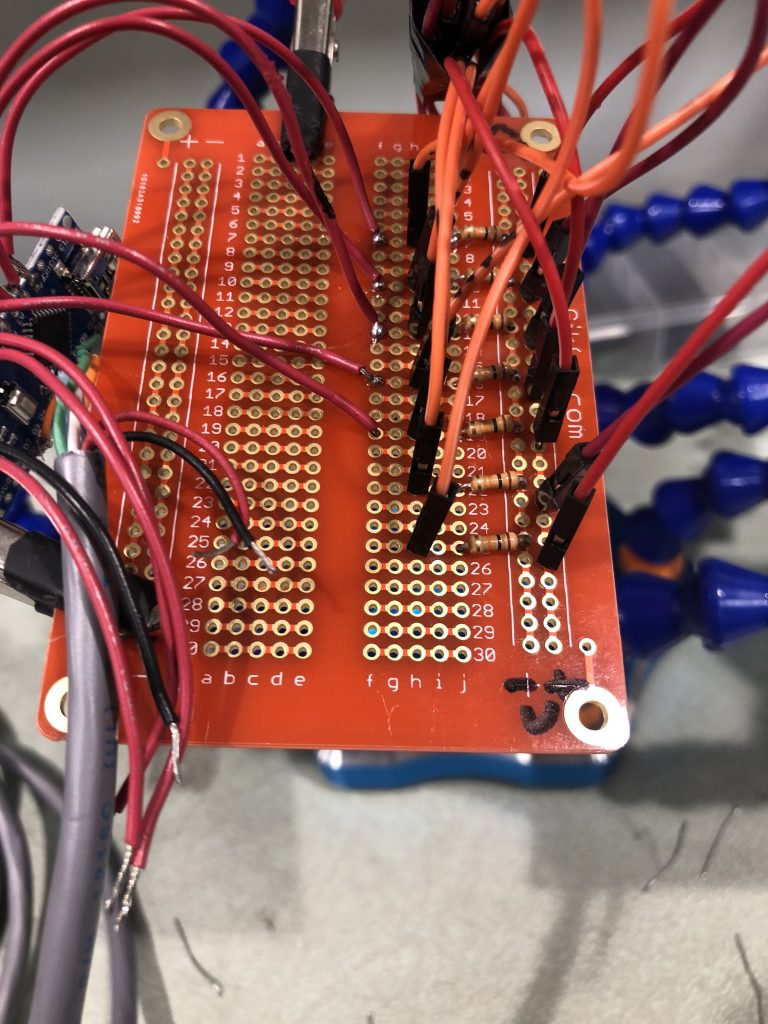
BIG MISTAKE!! The flex board was so flimsy and kept breaking and ripping. I kept having to fix it by soldering and re-soldering the connections on the board. At some point, I realized it would take more times to fix the flex board than to just start over with a new, more rigid board. I figured the anklet can grow a bit bigger if it meant the device worked more reliably. And so, I started over….
Soldering, soldering, and more soldering.
Connecting, connecting, and more connecting.
Making the anklet housing.

Alas! The anklet is complete, rigid, and the device works well.
The lights changing based on me moving the pressure I put on my foot.
Discussion
During the final presentation, one of the sensors disconnected and was not working. Moving forward, I want to figure out a way to connect the sensors more securely. Because of its flimsiness and flexibility, and just the fact that it’s placed in a shoe, soldering then taping the wires in place, still wasn’t a strong enough solution to prevent the sensors from disconnecting. The issue is the pins on the sensors are very small and close together, so there’s minimal area to work with. A suggestion given:
“The only electrical wiring that really needed to happen down at the foot level was tying the ground to one side of each of the sensors; the other side could simply take one of the wires up to the main junction board. Centralizing your wiring in this way is usually a good idea! “-RZ (instructor)
I think that is a good idea! I aimed to do that but because the sensors needed more connections than the LEDs (which only needed 2 connections to the arduino), I thought it would be easier to have the ardiuno near the FSRs. But definitely if I were to take the project further I would want to centralize everything one main box, and get rid of the ankle piece. Another suggestion giving during the final crit was:
“The shoe you are using is a Nike Free 4.0 which is very soft and flexible. Maybe you should use a flatter surface underneath the sensors to help read the pressure better.” -RG (classmate)
That is a very valid suggestion, and if implemented I think the sensors might read a bit better– but I wonder if it would make the shoe less comfortable? I think the bigger issue was not that the sensors were not reading well, but more that because of movement the sensors kept disconnecting. So maybe figuring out how to make the sensors stay in place is the direction to go. Also, this shoe was the only shoe I had to work with at the time.
When reflecting on the project, I find myself wondering if 7 sensors was too much? But also, I can’t see the device working the way it is supposed to if I had used any less sensors, because it is about the distribution of pressure and those 7 zones are distinctly separate.
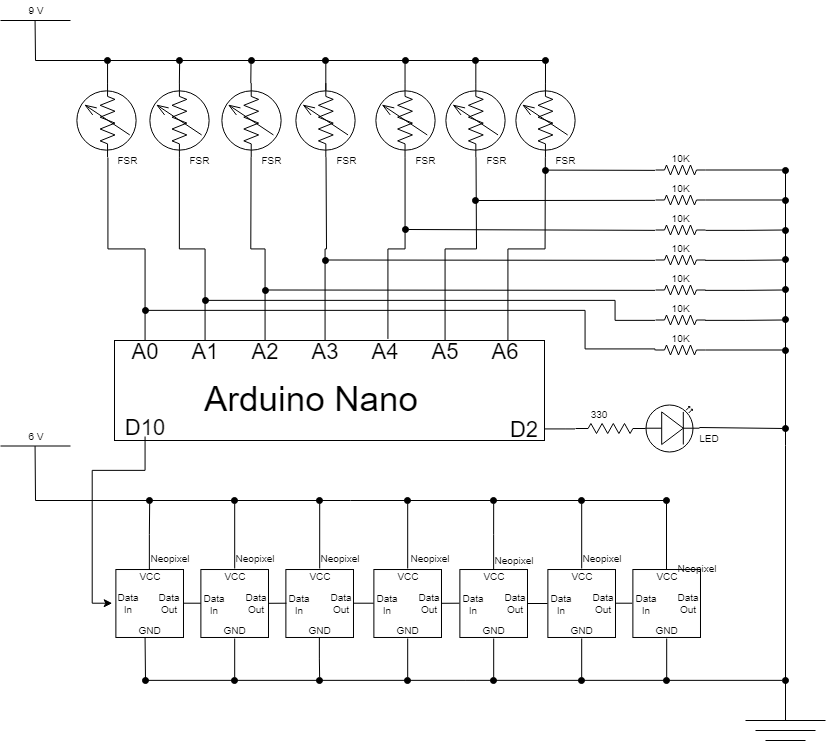
Adding to that, a small bump I ran into was that when I did the calculation, I needed a 9V battery. That voltage was working at first, but then when I moved the components to their respective housings, the arduino was only getting 3.6V and the LEDs were getting 3.3V. I’m guessing the rest of the voltage was lost to time and/or distance. So I needed to add 6 more volts of batteries. Please refer to the schematic for details. Basically, I had to split the power supply to 9V to the FSRs and 6V to the LEDs. I am still new to circuit building and electronics, but I learned a lot when making this project because of all the troubleshooting that needed to be done.
All in all, I like my new device and have already used it a handful of times when walking around. It has definitely made me more aware of the pressure distribution I put on my feet. I still haven’t been able to get the “Good Job!” light to turn on, but hopefully, one day, my walking will be better and I will be able to get that correct pressure distribution. I can already see and feel my walking getting better.
Schematic
 Code
Code
/*
 * Walk the Walk
 * by Ghalya Alsanea (galsanea)
 *
 * This project uses 7 pressure sensors in strategic locations in a shoe to visually display the pressure distribution someone puts on their feet.
 * The pressure is displayed using coresponding LEDs to map out the color based on the amount of pressure.
 * Also, if the right pressure is reached, then a green LED lights up.
 *
 *
 * Parts of this code is adopted from https://learn.adafruit.com/adafruit-neopixel-uberguide/arduino-library-use
 */

#include <Adafruit_NeoPixel.h>

int PRESSPIN1 = A0;
int PRESSPIN2 = A1;
int PRESSPIN3 = A2;
int PRESSPIN4 = A3;
int PRESSPIN5 = A4;
int PRESSPIN6 = A5;
int PRESSPIN7 = A6;

int PIN = 10;
int LED = 2;

int raw;
int n;
int red;
int green;
int blue;

// Parameter 1 = number of pixels in strip
// Parameter 2 = pin number (most are valid)
// Parameter 3 = pixel type flags, add together as needed:
//   NEO_KHZ800  800 KHz bitstream (most NeoPixel products w/WS2812 LEDs)
//   NEO_KHZ400  400 KHz (classic 'v1' (not v2) FLORA pixels, WS2811 drivers)
//   NEO_GRB     Pixels are wired for GRB bitstream (most NeoPixel products)
//   NEO_RGB     Pixels are wired for RGB bitstream (v1 FLORA pixels, not v2)
Adafruit_NeoPixel strip = Adafruit_NeoPixel(7, PIN, NEO_RGB + NEO_KHZ800);


void setup() {
  Serial.begin (9600);
  strip.begin();
  strip.show();                 // Initialize all pixels to 'off'

}

void loop() {

  // MEASUREMENT
  int pressVal1 = analogRead(PRESSPIN1);
  int pressVal2 = analogRead(PRESSPIN2);
  int pressVal3 = analogRead(PRESSPIN3);
  int pressVal4 = analogRead(PRESSPIN4);
  int pressVal5 = analogRead(PRESSPIN5);
  int pressVal6 = analogRead(PRESSPIN6);
  int pressVal7 = analogRead(PRESSPIN7);

//print sensor values for troubleshooting
Serial.print ("SENSORS: (");
Serial.print (pressVal1);
Serial.print (", ");
Serial.print (pressVal2);
Serial.print (", ");
Serial.print (pressVal3);
Serial.print (", ");
Serial.print (pressVal4);
Serial.print (", ");
Serial.print (pressVal5);
Serial.print (", ");
Serial.print (pressVal6);
Serial.print (", ");
Serial.print (pressVal7);
Serial.println (")");

//Set each measurement to it's corresponding LED

  if (pressVal1 > 0){
    raw = pressVal1;
    n = 0;
    COLOR ();
    pressVal1 = 0;        //exit the loop
  }

  if (pressVal2 > 0){
    raw = pressVal2;
    n = 1;
    COLOR ();
    pressVal2 = 0;        //exit the loop
  }

  if (pressVal3 > 0){
    raw = pressVal3;
    n = 2;
    COLOR ();
    pressVal3 = 0;       //exit the loop
  }

  if (pressVal4 > 0){
    raw = pressVal4;
    n = 3;
    COLOR ();
    pressVal4 = 0;       //exit the loop
  }

  if (pressVal5 > 0){
    raw = pressVal5;
    n = 4;
    COLOR ();
    pressVal5 = 0;       //exit the loop
  }

  if (pressVal6 > 0){
    raw = pressVal6;
    n = 5;
    COLOR ();
    pressVal6 = 0;       //exit the loop
  }

  if (pressVal7 > 0){
    raw = pressVal7;
    n = 6;
    COLOR ();
    pressVal7 = 0;       //exit the loop
  }

  //if you're putting the right amount of pressure, a green light comes on.
  //pressure values are estimates based on healthy pedobarography scans studies.

  if (200<pressVal1<700  &&  400<pressVal2<600  &&  pressVal3>800  &&  200<pressVal4<400  &&  pressVal5<100  &&  100<pressVal6<300  &&  pressVal7>700){
    digitalWrite(LED, HIGH);
  }

}


void COLOR(){
  //This function is to calculate which RGB values to use, based on the pressure sensors.
  //The gradient range is from blue to green to red, with red being the most pressure.


  // 20 is most blue, 600 is no blue anymore
  int blue = map(raw, 20, 600, 255,  0);     // note the mapping is reversed because blue decreases as pressure increases
  blue = constrain(blue, 0, 255);            // keep the values within limits, just in case the math is wrong

  // green is max at 800 and less in both directions
  int green =  255 - abs(raw - 800);
  green  = constrain(green,  0, 255);       // keep the values within limits

  // red increases from 950 to max.
  int red = map(raw, 950, 1023, 0, 255);
  red = constrain(red, 0, 255);             // keep the values within limits


  strip.setPixelColor(n, red, green, blue); //set the color
  strip.show ();                            //display that color

//print RGB value
  Serial.print ("RGB = ");
  Serial.print (red);
  Serial.print (", ");
  Serial.print (green);
  Serial.print (", ");
  Serial.println (blue);

}
Leave a Reply
You must be logged in to post a comment.