Overview:
For our final project, each group was paired with a client from CLASS (Community Living and Support Services), which is a “nonprofit organization that offers different services to individuals of varying abilities”. Our client is Bill, who has achromatopsia, which is the lack of cones in the eyes, so he is legally blind and 80% colorblind. For information on our interview with him, click here.
What We Built:
During our initial interview, we found that Bill has trouble picking out matching outfits in the morning because of his colorblindness. To make this process more convenient for Bill, we proposed the following product: a gadget senses the Red, Green, Blue values of a fabric or clothing when a button is pressed and prints out the color and the values for the user. Note: Red, Green, Blue Values are between 0 and 255 and they are a representation of how much of that color is present. For example pure red would be 255, 0, 0.
Final Overall Image
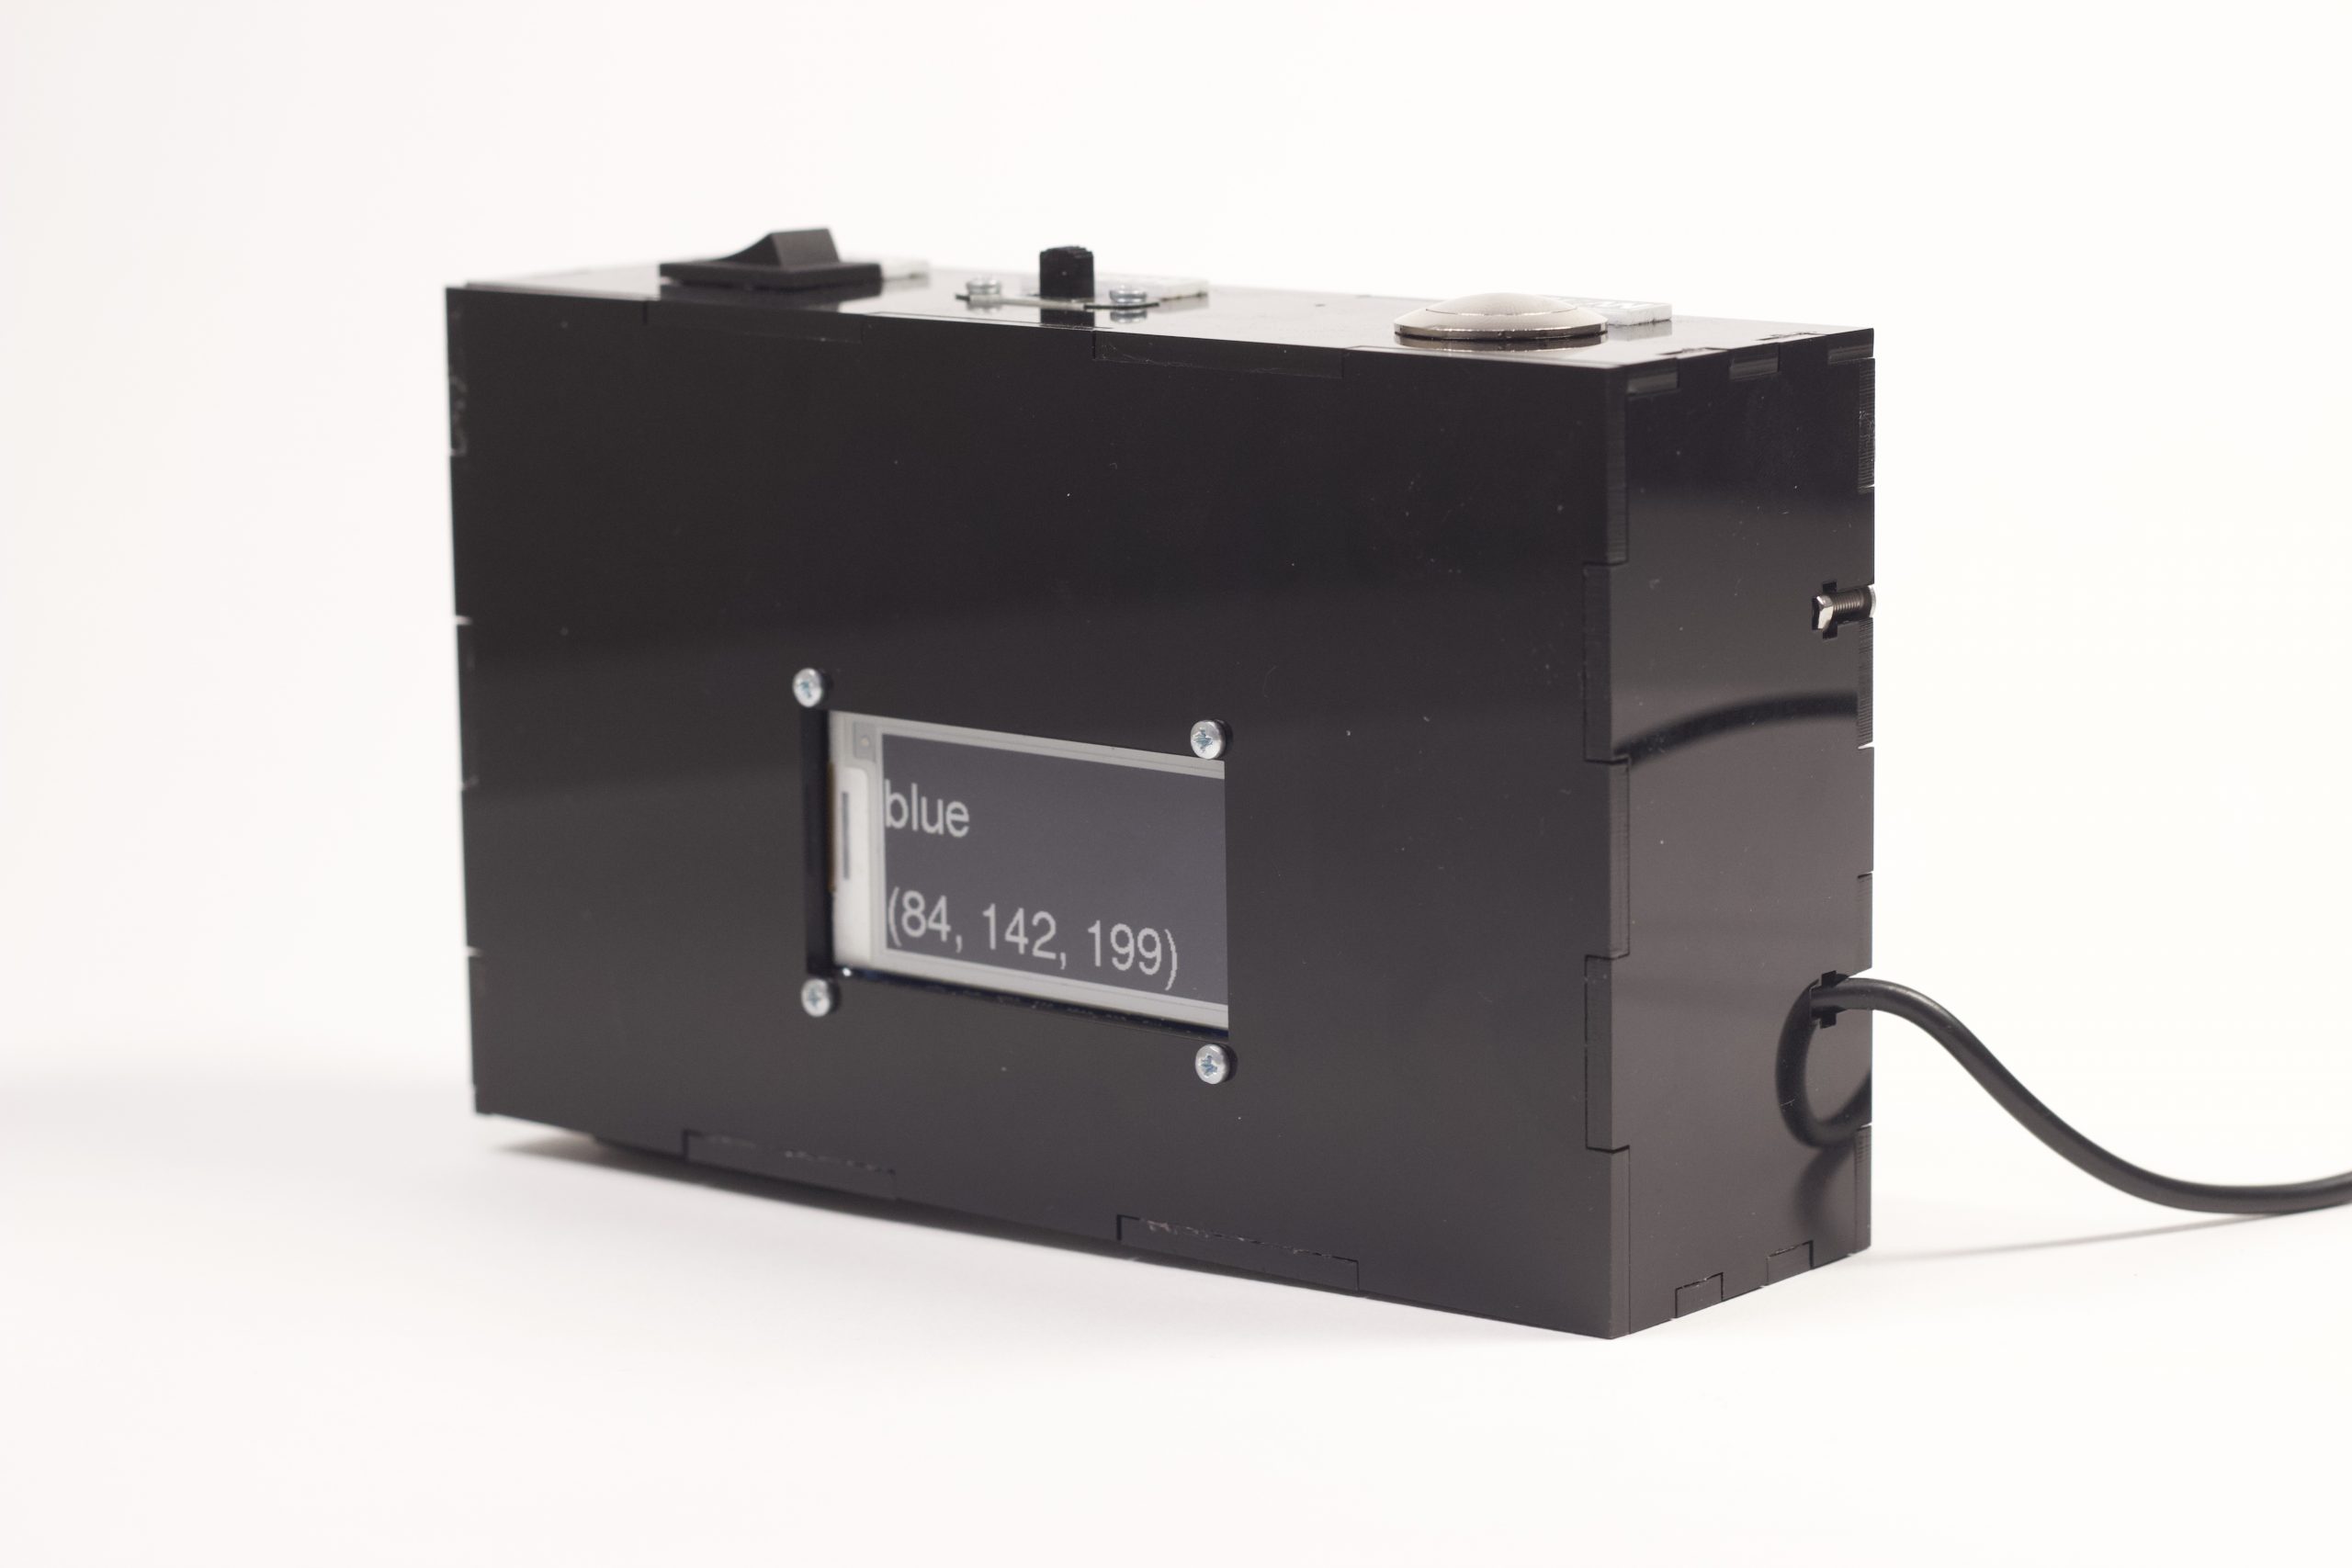
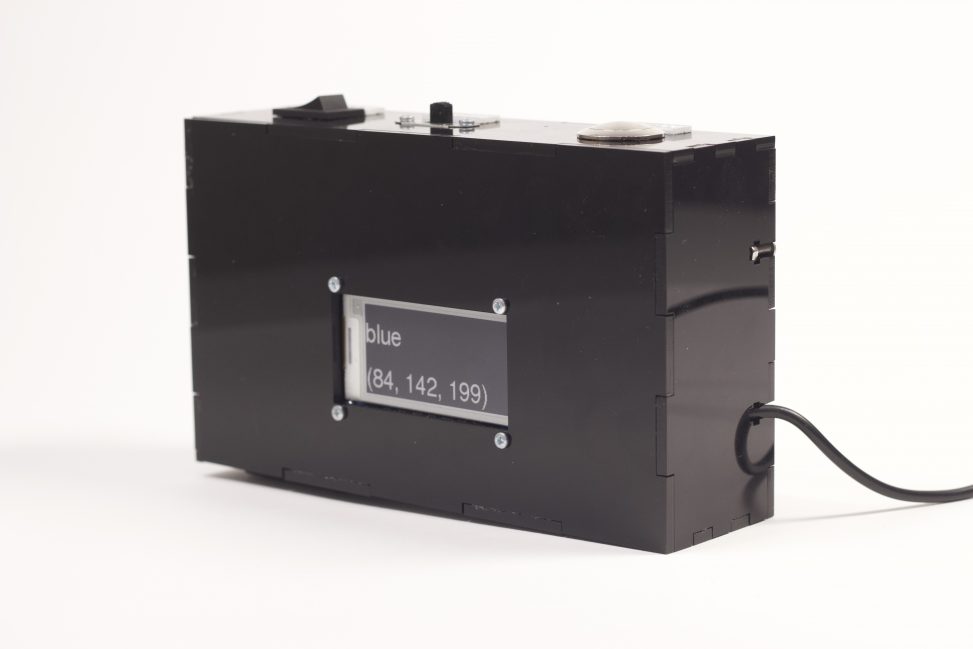
Final Overall Image of Our Project.
Detail Photos

Detail #1: Button for Scanning, A Light Switch, and Power.
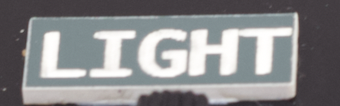
Detail Image #2: Laser Cut high contrast labels so our client can easily identify what each button does
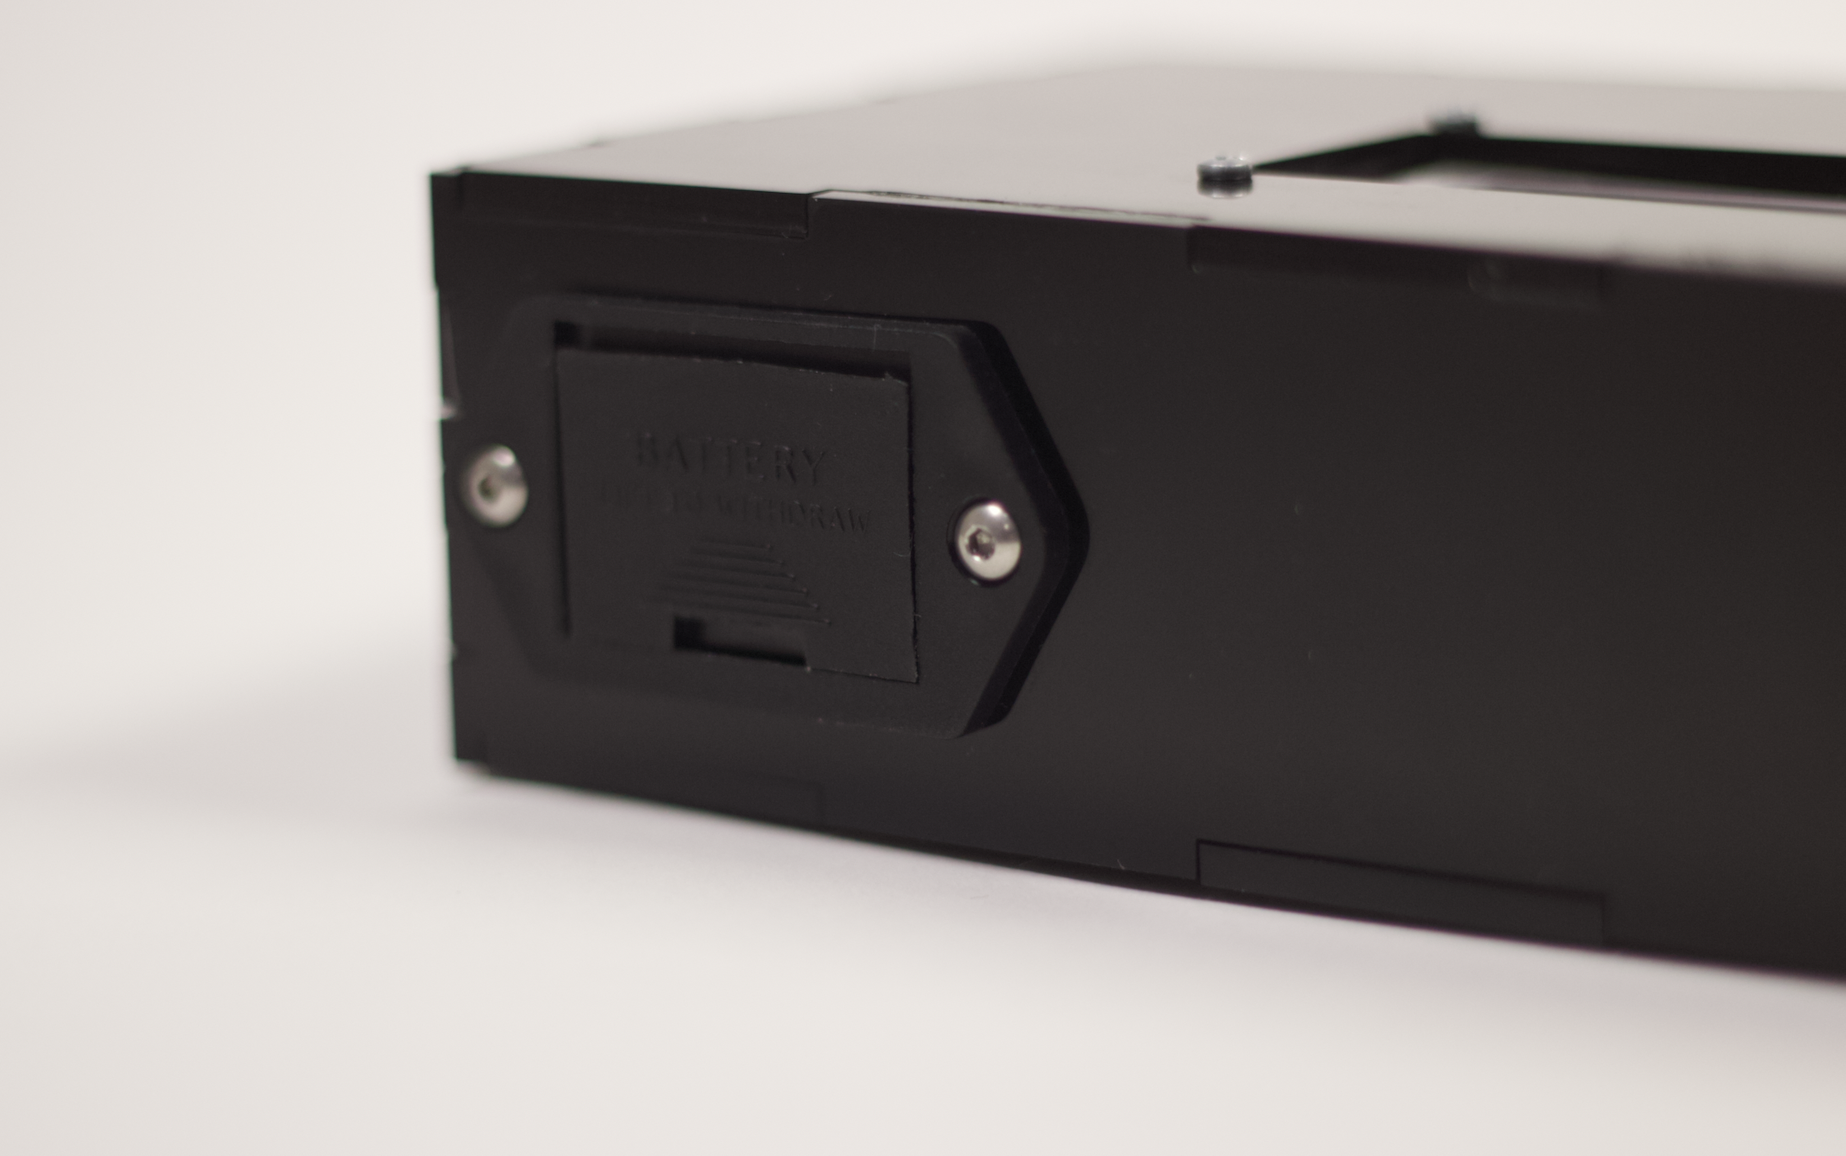
Detail #3: 9V Battery Pack so the device can be used unplugged.
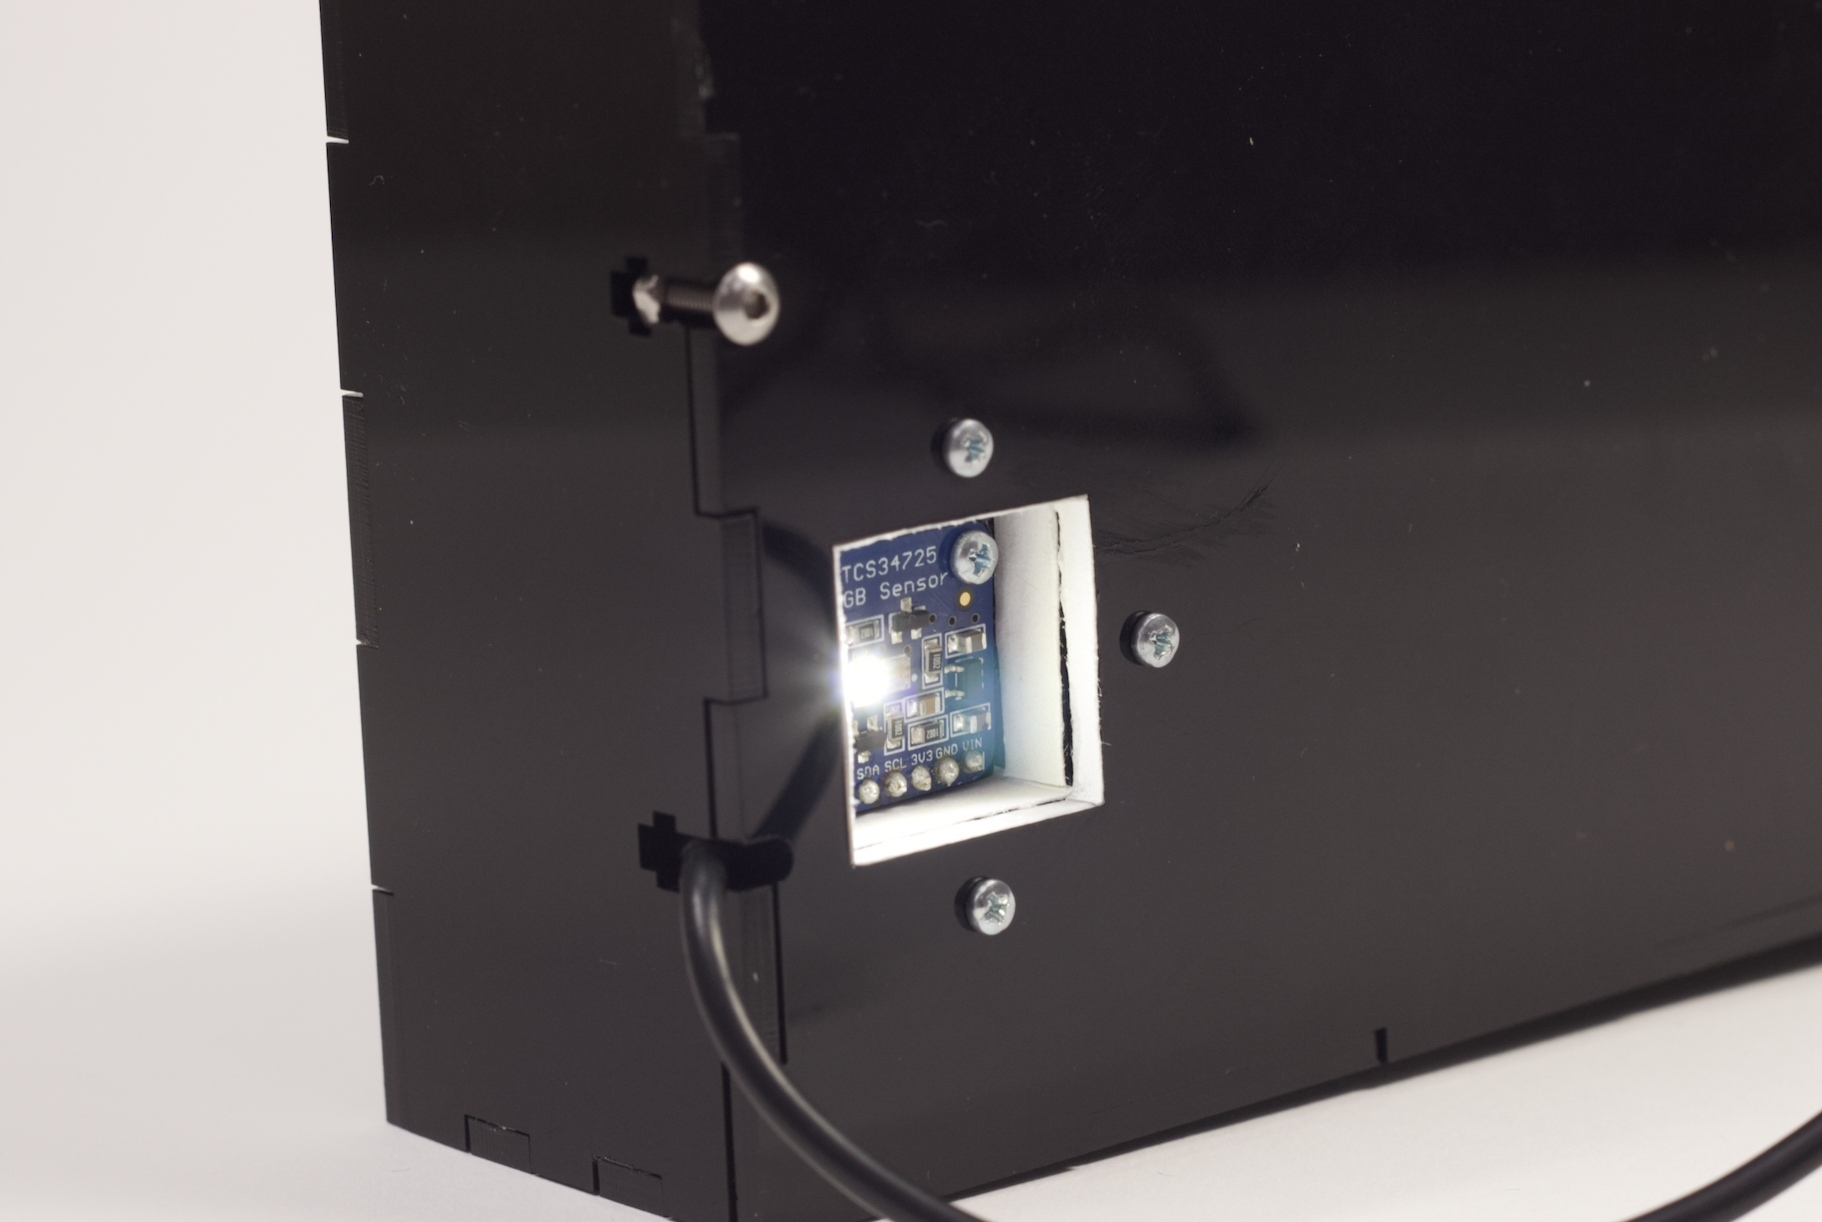
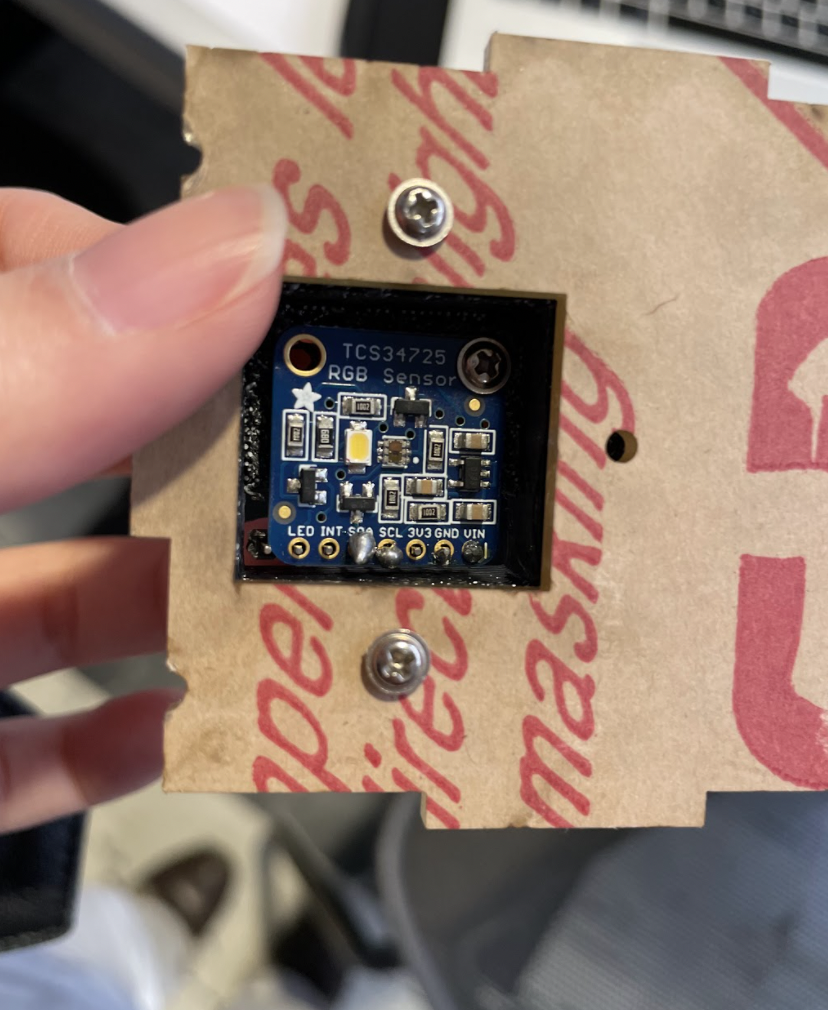
Detail #4: RGB Sensor cased in a 3D printed housing. White paper placed on the inside so it reflects the light and gets a better reading.
Detail #5: Adafruit EINK display to provide customizability and high contrast for our client to be able to easily read despite his issues with vision.
Final Working Video
Note: Our display does not update until the button is pressed so it will continue to display it’s previous scan. This is why it initially displays teal. Furthermore, due to the limitations of the EINK display it does take a some of time to update.
Narrative Sketch of How it Would Be Used
Bill wants to decide his outfit for the day, but he isn’t sure which colors he has in his wardrobe. He places a shirt on a flat surface, the device on top of it, and presses the button. The screen updates saying the shirt is a “dark green”. He then goes to grab a pair of pants to do the same. After scanning the pants the display reads “light orange”. Through his work with spreadsheets Bill has learned which colors go well together and how to decipher RGB values. So Bill knows light orange and dark green don’t match. He then grabs another pair of pants and after scanning the display reads “tan”. He thinks to himself “perfect!” and leaves for his day knowing that his outfit goes well together.
How We Got Here – Prototype & Process
Prototype
Our prototype was designed to help answer the design question: what are our boundaries for the colors? For example, at what point is green different from teal and teal different from blue? We also wanted to make sure Bill was happy with the new display that we have (E-ink) because he can’t see the traditional LCD screen colors (blue/white or green/black) very well.
Through our prototype we wanted to establish that the basic part of the device would function: Using the TCS34725 color sensor to read colors. We converted the RGB (Red, Green, Blue) reading from the sensor to HSV (Hue, Saturation, Value) values to make it more convenient for us to interpret and set the color boundaries. For the prototype, we focused on naming the hue (main color) correctly, since the saturation and value just add adjectives to that (light/dark). The boundaries were determined visually using the hue charts found online. We ended up with 9 main colors: pink, red, orange, yellow, green, teal, blue, purple, magenta.
Prototype Images:
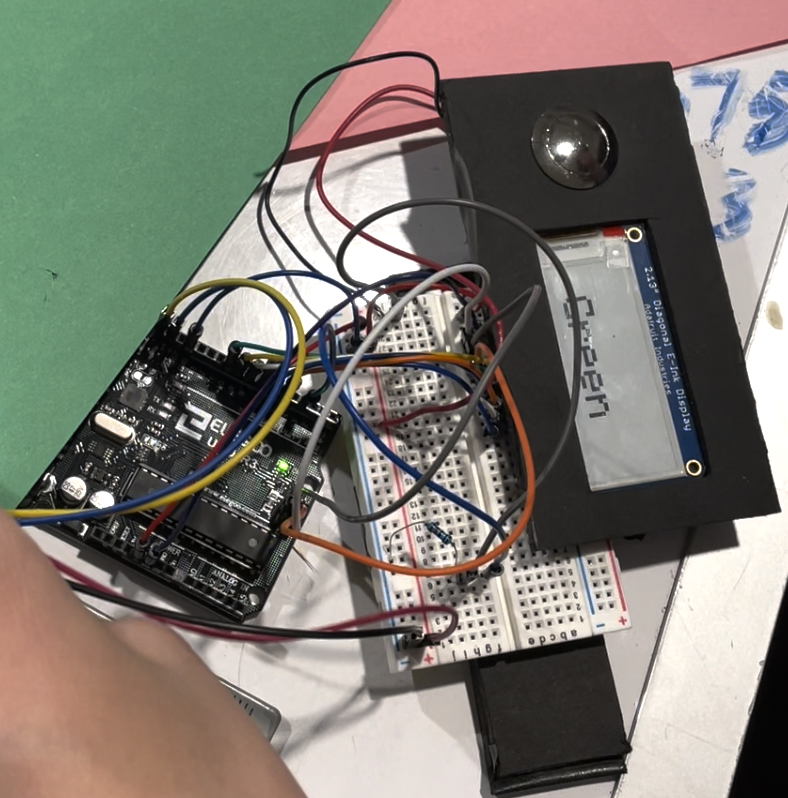
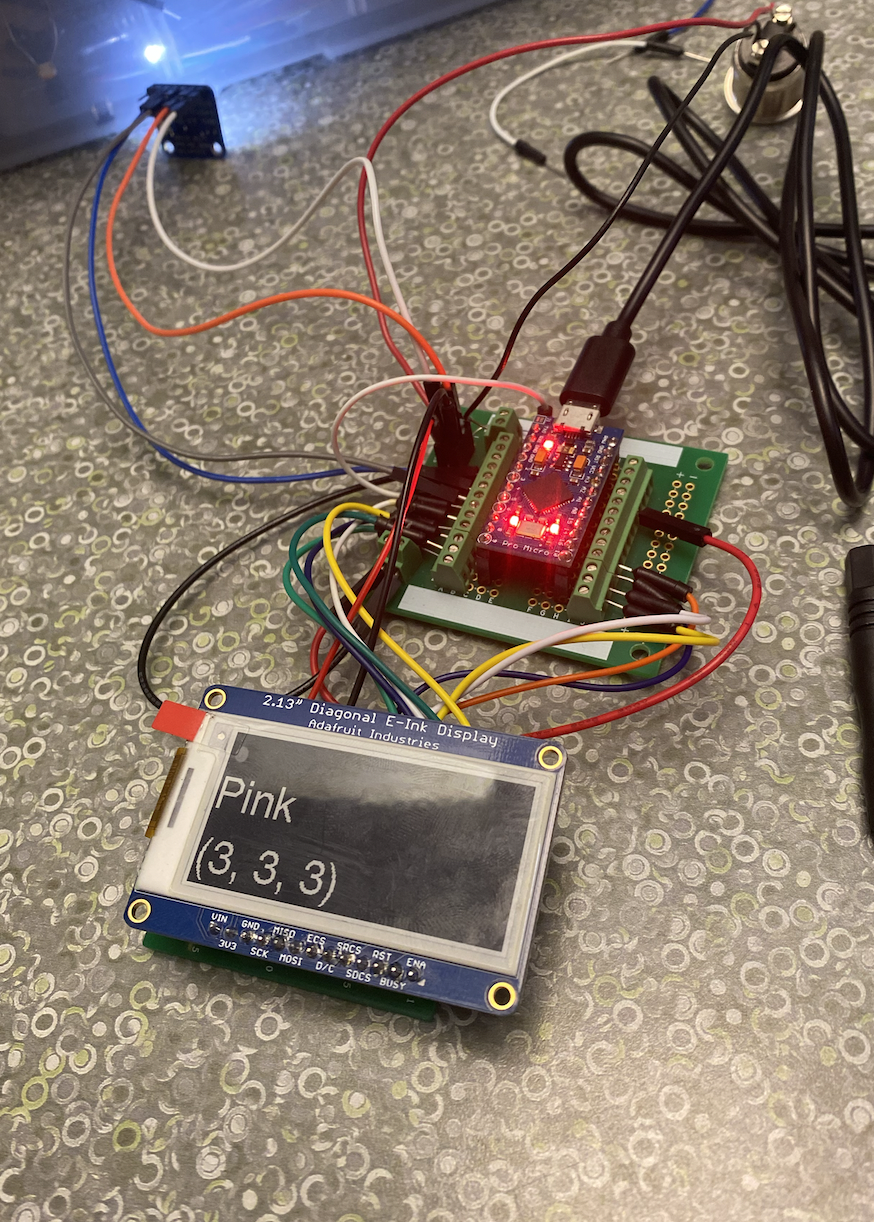
This is the final overall image of our prototype.
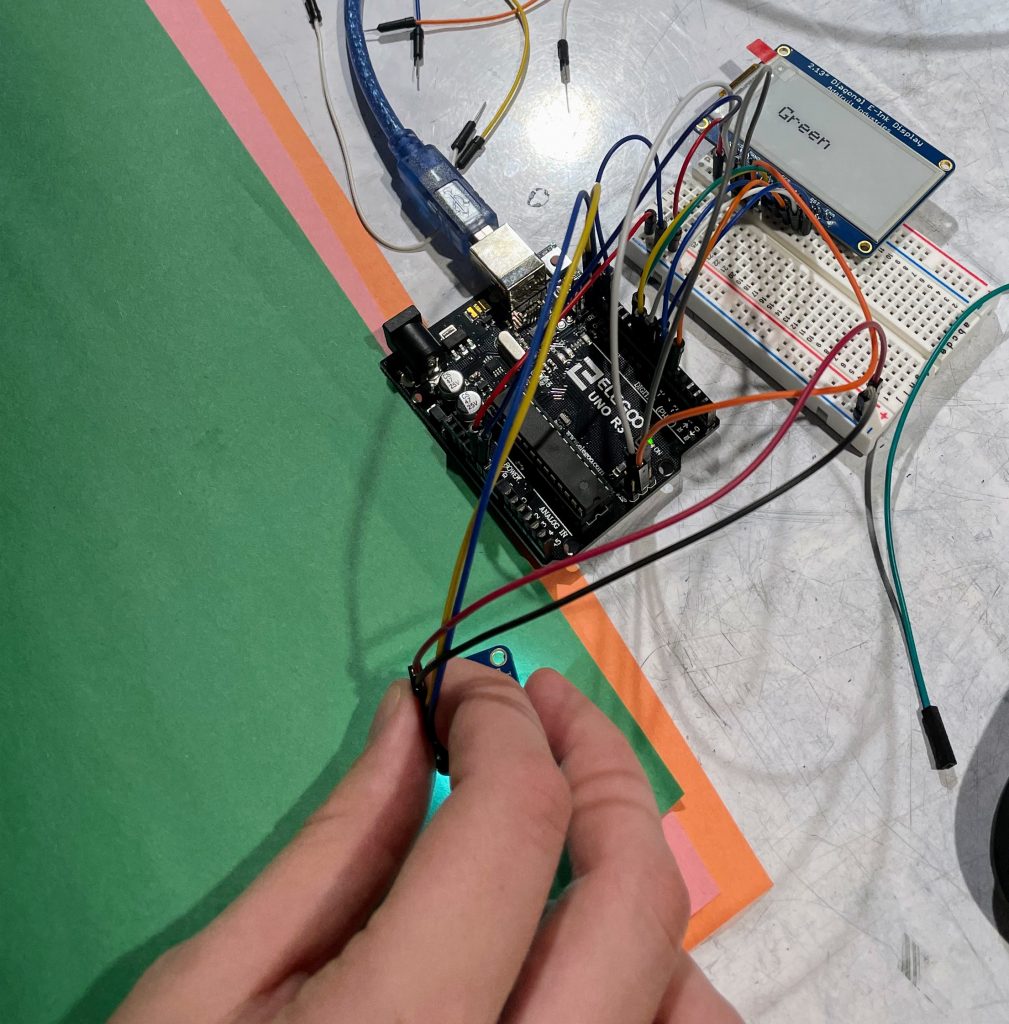
Zoomed out photo of the prototype being tested with three different colored papers (Green, Pink, Orange).
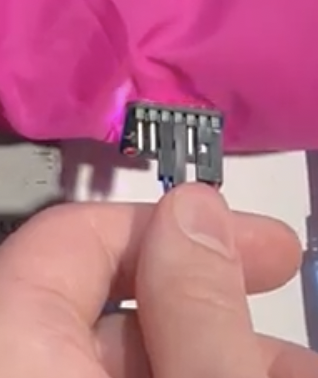
For our prototype the color sensor was loose so we had to hold it to articles of clothing of sheets of colored paper.
Our Prototype Working:
Findings, Feedback, and Surprises from our Prototype
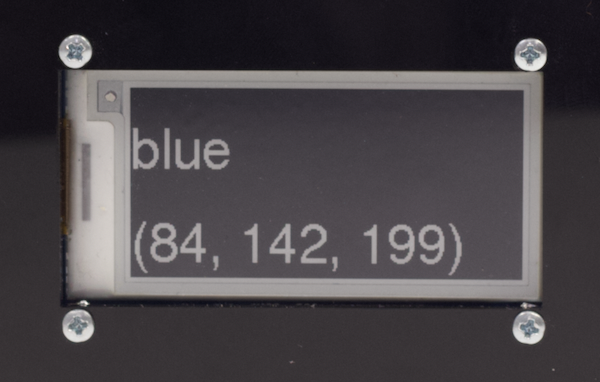
As for the answers to our questions, it was successful in terms of finding the right boundaries for each color so we moved to incorporating the saturation and value to the code as well. Bill was happy with the higher contrast in the E-ink display, but preferred a black background with white text for maximum contrast, which was the opposite of the prototype.
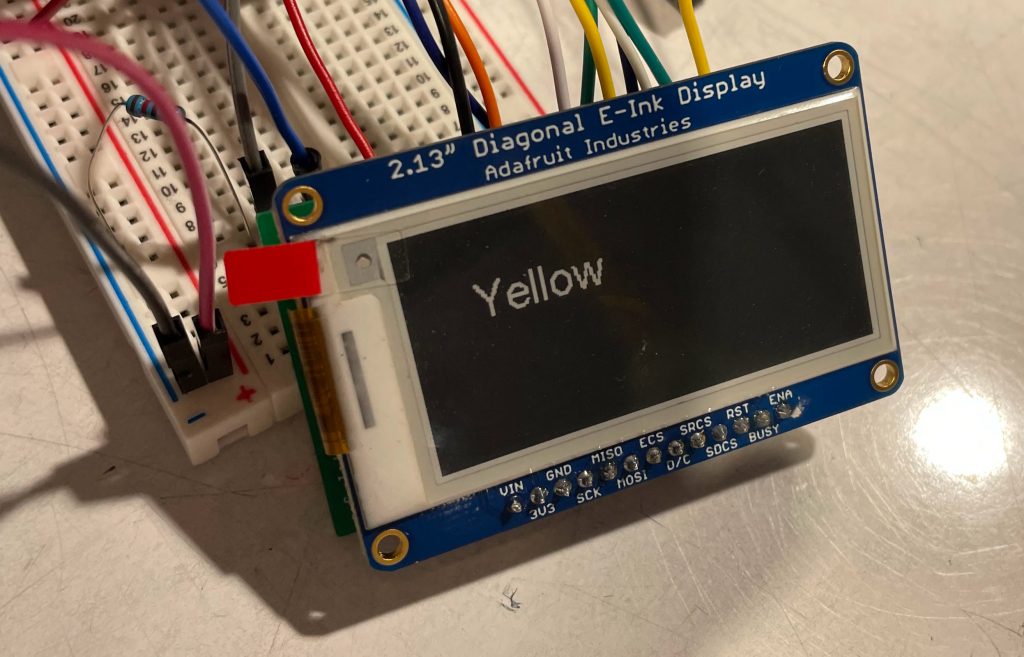
Successfully converting the background color to black and text color to white on the screen
During our prototype critiques we only had one scan button for the sensor, but after getting feedback we added another switch for the sensor light so that the client can turn on/off the light depending on the situation. Additionally, we were advised to place the sensor inside the box because then it will be less affected by outside light sources, so we 3D printed a case for the sensor. We also added a power switch because we planned to use batteries to make it more portable. Bill picked the placement of the switches, display, and sensor. He also picked the color and material of the box.
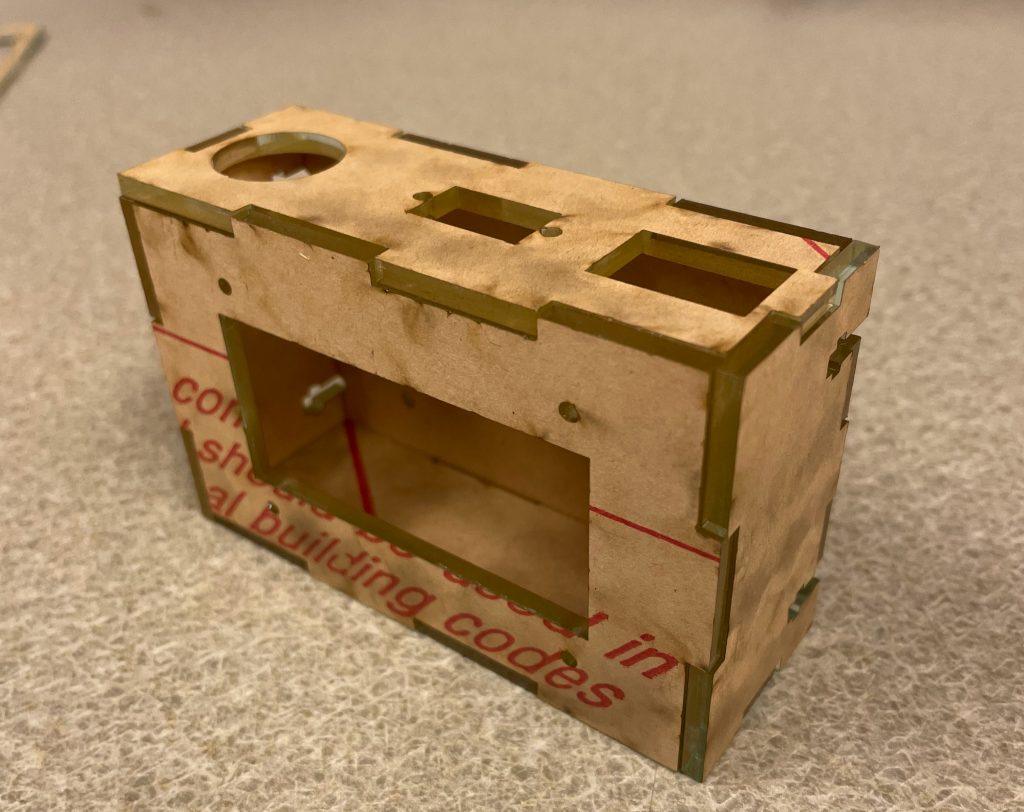
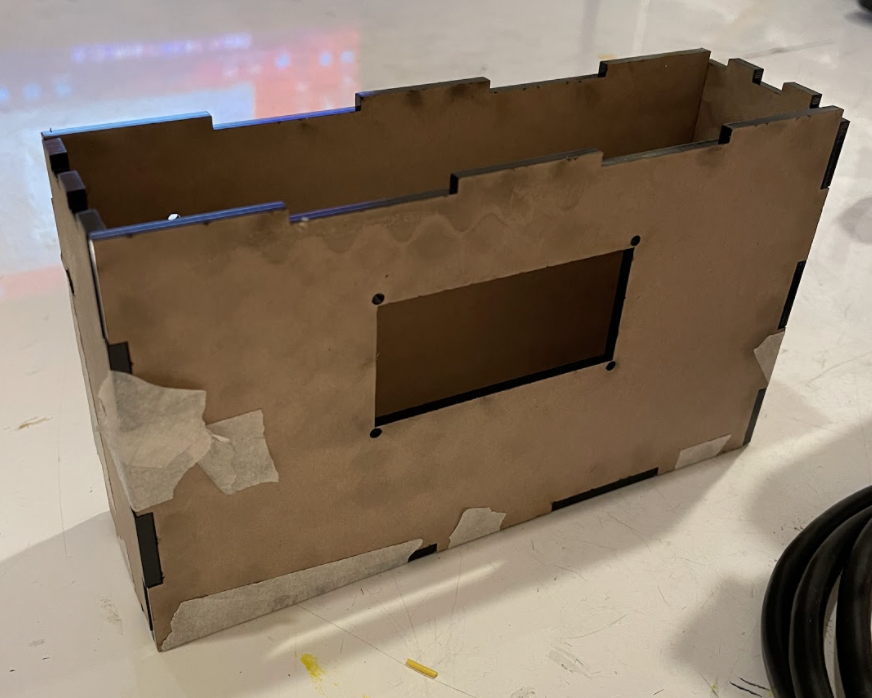
First draft of the 3D laser cut of the box after the prototype meeting
During our prototype critique session, we asked Bill if he would like an audio that would read the color out loud, list colors that go well with the detected color, or specify the grayscale colors for white, gray, and black. However, he wanted the design to be kept simple and just have the color sensing part working. He could also read RGB values so he could tell the shade of the grayscale if we were to just label the color “grayscale.”
Our biggest surprise was that Bill understands how to interpret RGB, which we think is less intuitive than HSV. He says it’s because he’s made presentations before, and picks colors for those by inputting the RGB directly, so he has figured out how it works. So we can add RGB to the display so he has more detailed information to work with, since a group of HSV inputs all map to the same color description.
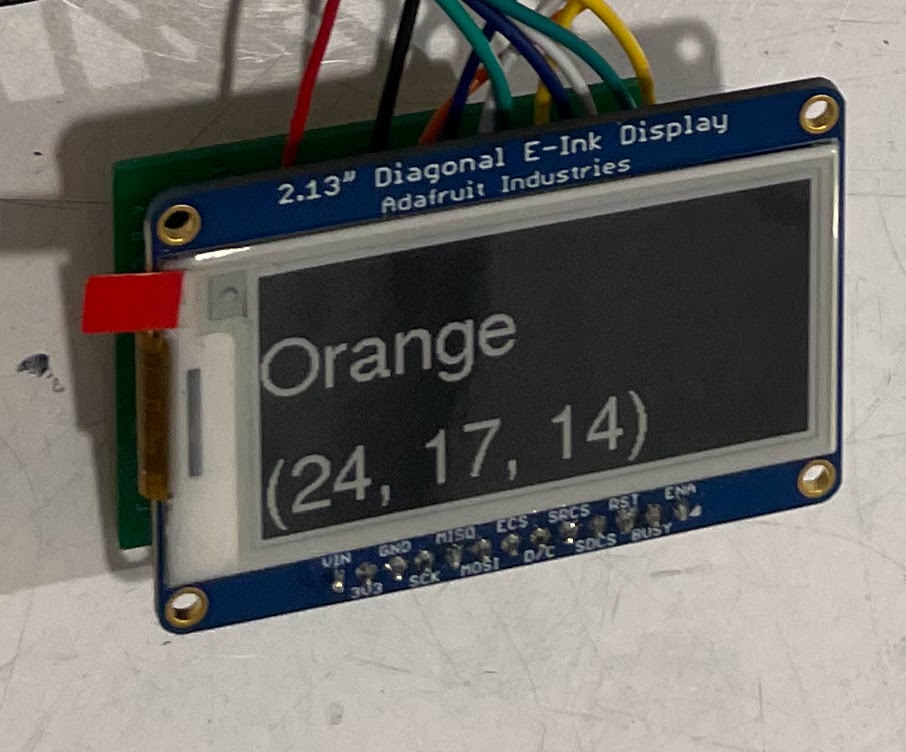
A close up photo of the screen displaying both the color name and its RGB values.
Process
Let’s start off with our small takeaways. We were able to increase the font size and invert the display colors by reading the documentation for Adafruit GFX, since it’s shared for the E ink display. Similarly for the sensor sensitivity: once we put it in the box, the environment became darker (even with the light on), so it was reading dark colors for too many things. So by increasing the sensitivity and increasing the reading time allotted, we were able to make it more accurate.
Software
For any hue, we can vary the saturation and value to get a large range of other colors. Specifically, how light/dark the color is, as you can see in the picture below.
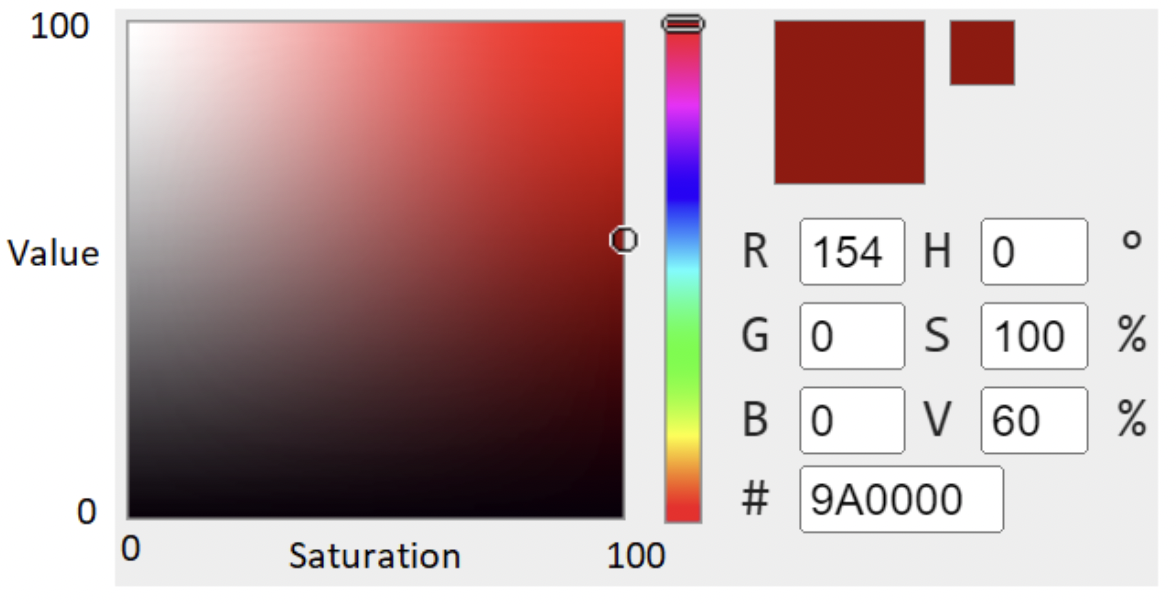
Example of HSV with hue = 0, and saturation and value from 0 to 100, which become the x and y axis of a coordinate plane.
Thus we have a nice coordinate system (x axis is saturation, y axis is value), which we can apply standard geometry math to. The first thing we noticed was the grayscale along the left edge and bottom: what we can see as the actual color somewhat fits within this boundary.
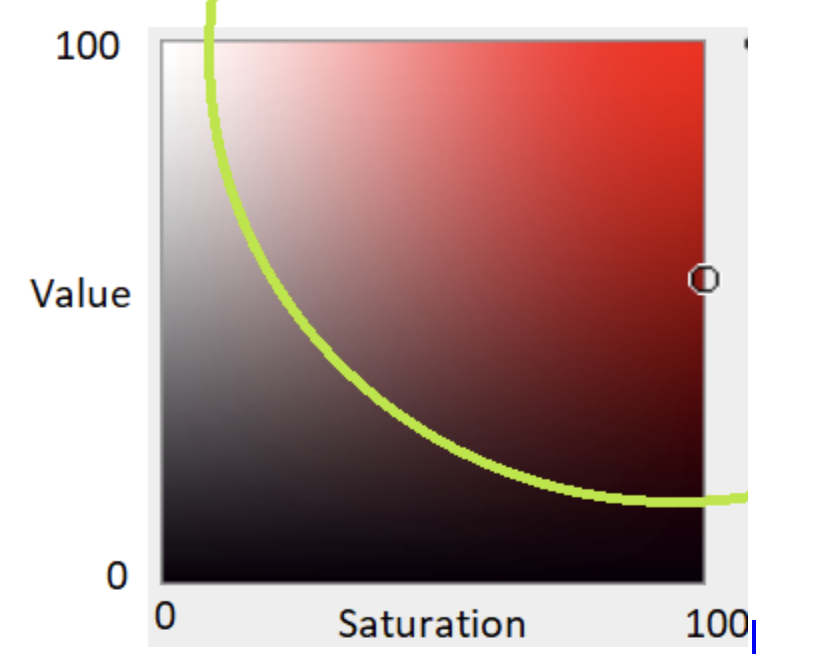
Boundary drawn to separate the colors vs grayscale (looks like a quarter circle).
This boundary is a quarter of a circle, with the center at (100,100), and a radius of about 98 (after testing). So our first step is to figure out if a point is within the circle or not. If it is in the circle, then it has a discernible color that we should categorize further. Otherwise, it’s grayscale and we can just display that.
A point (x,y) is within the circle if this equation is true: (x-100)2 + (y-100)2 ≤ 982
(this is just the standard circle equation with the center and radius as named above). So we plug in our given saturation (x) and value (y). If the point is within the circle, we need to categorize it further into light/dark. The medium category would be redundant (since we usually think of a medium level color as the standard color), so we don’t have the adjective.
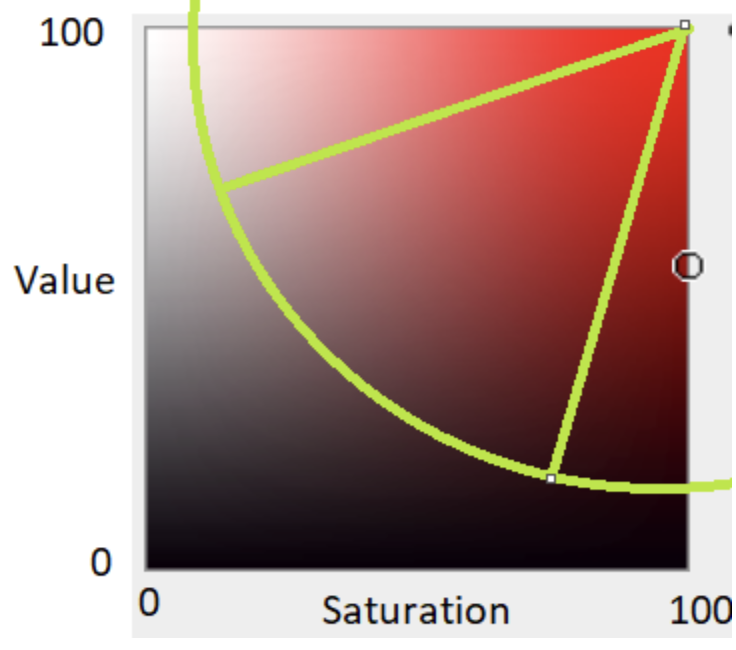
Boundaries drawn to give light/medium/dark options (look like pie slices).
The boundary cutoffs for light/dark look like pie slices. Each pie slice takes up some amount of angle space in the circle. Recall that a circle has 360° or 2π radians (equivalent forms of measurement) in it.
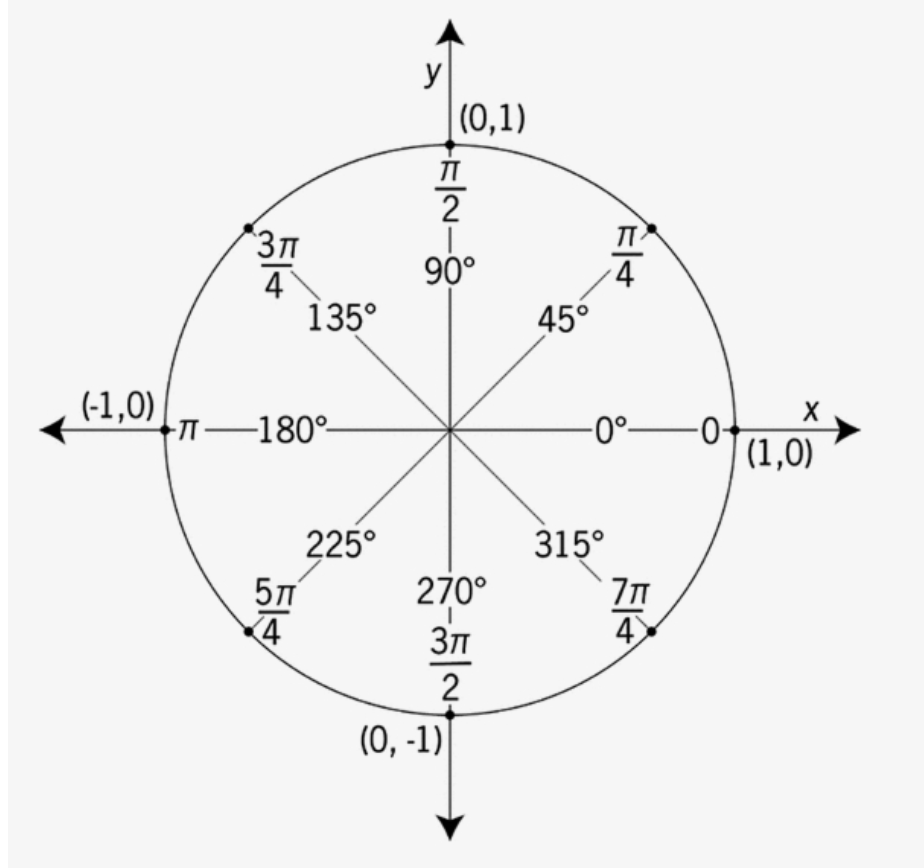
Circle in degrees and radians.
So we can tell which “pie slice” a point is in by looking at the angle the point makes. For example, if the point’s angle was 200° , we’d know it would belong to the pie slice on the left, just below the horizontal line (all angles between 180° and 225° belong to that pie slice).
How to determine the angle? We use the function atan2(y,x), which takes in the x and y coordinates and returns the angle in radians, between [-π, π]. Positive radians are measured counter clockwise, while negative radians are measured clockwise, so for example, 7π/4 would be the same angle as -π/4, and 3π/2 would be -π/2, and π would be -π. This is basically the top half of the circle, but reflected over the x-axis, and with an added negative sign.
Note: the x, y in atan2 aren’t saturation and value directly, but x = sat – 100 and y = val – 100, because atan2 assumes those x,y values are relative to a circle centered at (0,0), but since our circle is centered at (100,100) we need to offset it so the math will be correct. Finally, we used boundary angles of [-π, -7π/8] for light and [-5π/8, -π/2] for dark, which was found through testing.
Final caveat for angles: if x,y happen to be in the center of the circle, then it doesn’t really have an angle, so we know it’s a pure color and not light/dark so we don’t bother calculating the angle.
Brown/tan time! We want to include these colors because they are in Bill’s wardrobe. However, brown/tan aren’t in the main colors because you can’t tell if something is brown/tan just by looking at the hue. Instead, brown is a specific combo of a red through yellow range, with more medium saturation/value ranges. Tan is a small chunk of the brown range.
The pattern where the browns appear is that they can be found in this “pie crust” section.
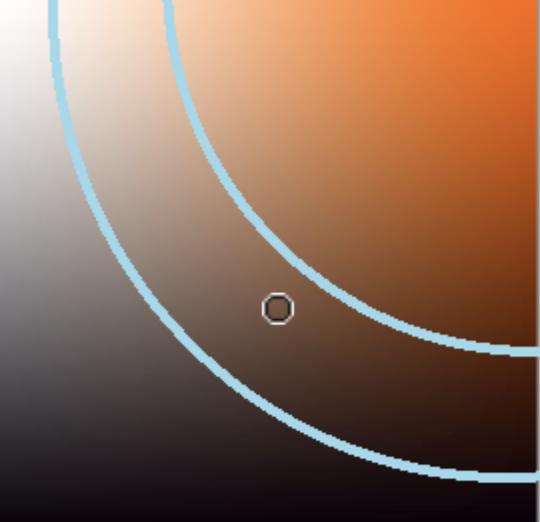
Concentric circles with different radii: the in between section is “brown” (looks like pie crust).
We have 2 concentric circles (same centerpoint), but with different radii. So the band between them is the pie crust. We can determine if it’s in the pie crust by calculating the distance between the center of the circles and the point (radius). The formula is r = (x2 + y2) .5 and again, x=sat – 100, y = val – 100 to adjust for the center of the circle not being at (0,0). We came up with the bounds for the smaller and larger radius as 60 and 75, which was determined visually.
Tan is a specific shade of brown, with HSV = (334, 33, 82) which we found online. But those exact coordinates are unlikely to be measured. In addition, coordinates that are “close enough” can still be visually interpreted as tan. We decided close enough in this case is ±10 in each of the HSV parameters. So we use the radius equation to check if we’re less than the radius of the tan circle (10), where x = sat – 33 and y = val – 82 to adjust for the center of the circle.
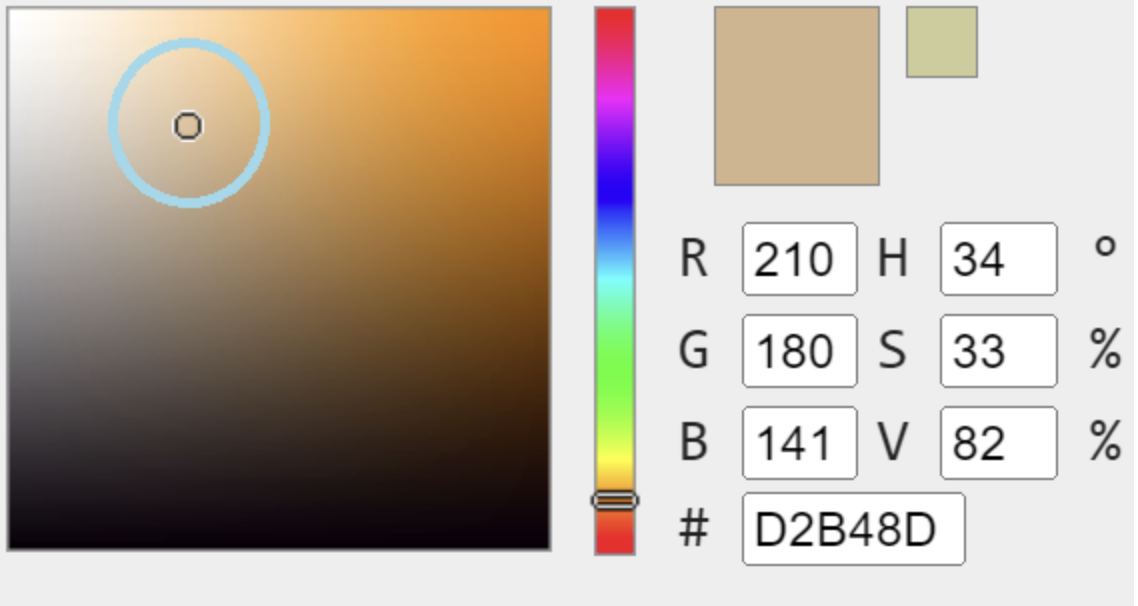
Tan location is the dot. Sufficiently close HSV can still be called “tan”, so the circle around it is the region where everything inside is “tan”.
The overall steps:
- Check light/dark/grayscale
- If not grayscale, tan/brown, hue
- Print all relevant information
Reducing Memory & Transitioning to Arduino Micro
We chose the Arduino Micro because it would be smaller and more compact for the box. However, that also means less memory storage for the code. With the original code, it took up about 106% of total space in the Micro, even though there was plenty of space left over in the Arduino Uno. The main culprits were data types and Strings. For instance, variables were int or double, which can represent a very large range of positive and negative values as well as decimals. However, we know saturation and value are in [0,100]. Thus, we can reduce the saturation and value data types to bytes (can represent [0,255]), which takes a lot less space than int. Same goes for some of the x, y, radius variables used earlier. The other strategy was to decrease the length of strings, or delete Serial.print statements (since those aren’t on the screen anyways). For example, the checkSatVal function that names if a color is light/dark (or medium or grayscale) used to return “grayscale”. The main function would check if the return value is “grayscale” to decide whether to print the hue/other information. However, this means “grayscale” is just being used as a flag, so we can reduce the return string to “g”, since we know what it corresponds to, and just check for “g”, thus saving some character space. Similar thing with returning “medium”; by rearranging the if statement logic, it can return an empty string since we weren’t planning to print medium either way, so the empty string actually makes it easier to concatenate the display output later. With these modifications we now use 95% of the storage space.
Hardware:
For Hardware changes we transitioned from the project being breadboarded to it being 100% soldered. We largely did this with headers that can screw in wires to allow us to still make changes while still being able to move wires around and troubleshoot issues.
Fully soldered circuit for our final project
Soldered backboard for E-INK so it can be held in place and properly wired while still allowing for us to remove the screen for measurements
One of the main issues we ran into with the soldering aspect was getting the screen to work properly. Troubleshooting with the E-INK display was difficult as it was hard to tell if it was issues with wiring, code, or the screen itself. The screen only updates when its given a signal, and at the start even the demo code (example code given with library) wasn’t working with the soldered connections. After many hours of troubleshooting and re-soldering joints to make them more solid the screen was finally able to work and run the demo code which is shown in the video below.
We also managed to get the device battery powered. This was difficult as the screen didn’t seem to want to boot up properly off solely battery power. This lead to our slightly wacky solution. To boot up the device it needs to be plugged into a computer but then if you flip the power switch and unplug the device it will work perfectly until it is powered off again. We are still slightly unsure why exactly this is but after doing research on the E-INK displays we noticed that they need A/C power or a Computer to boot up properly and the battery simply provides DC power. This is why it couldn’t boot up the screen but it could keep it running after it was already booted.
Design Process:
The box design was finalized after our prototype meeting because we got to ask Bill where he would like the buttons located, the type of buttons, material of the box and other features he might want on the box like a handle or a hook. As for the buttons, we did some test trials as to which worked better. We decided to have labels for the buttons because we had three on the top side and they were all for different purposes. He did not mind too much for the material of the box but something like black could work. He planned on keeping the device on a shelf near his closet so he did not need a hook or a handle. The back side of the device is also removable by screws so if there happens to be any hardware issues or if a part breaks we can easily remove the face and make the changes.
The sensor holder was 3D printed instead of laser cutted because it was so small. We initially decided on black plastic for the material but after testing the sensor we found that due to the darkness of the holder walls, the color values read darker than its actual value. Therefore, we had to line the inside of the holder with white paper walls so that the led light from the small bulb that is part of the sensor would have a surface to bounce the light off of.
Front View of our 3D printed color sensor housing.
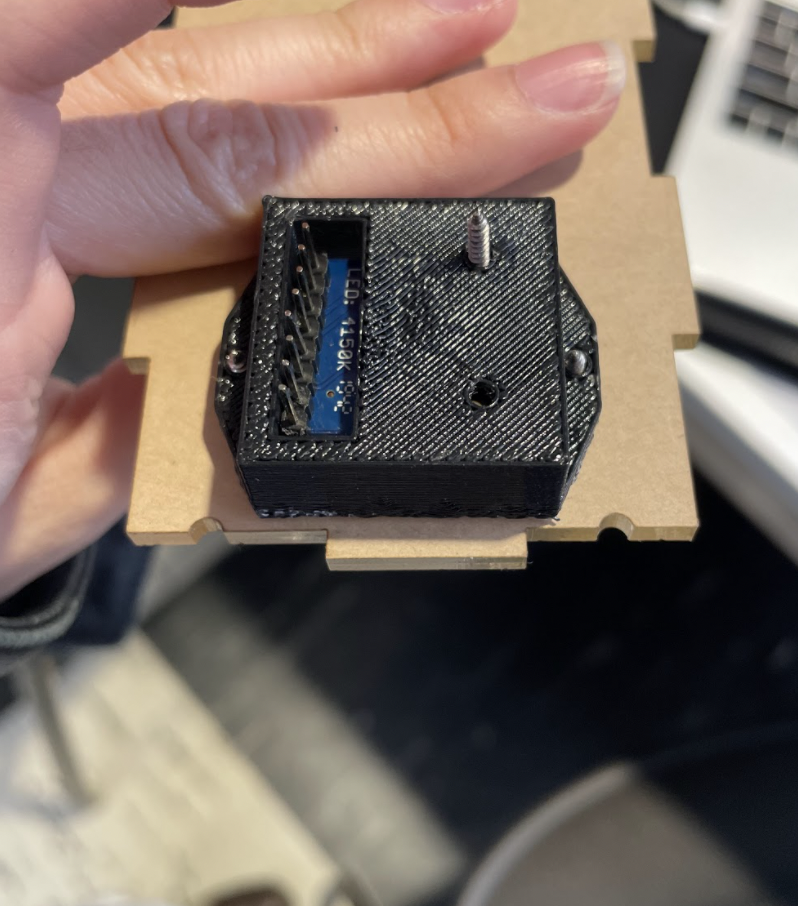
Back view of our 3D printed sensor housing
A preliminary model of our housing to test if all the electrical components fit properly.
Schedule
As expected, we got the basic color coding done early and kept making minor adjustments as we put the device together and started adding components like buttons, battery, etc. The box design was also done on time, but adjusting the measurements took longer because there were a lot of parts cased inside the box that needed to fit and not break inside the box. For the hardware, soldering was done on time however it took longer than expected because adding the external power source had some issues with our screen as we explained in the hardware section of our process.
Conclusion

We learned a lot from interacting with Bill and the other clients from CLASS. Overall we gained a much bigger appreciation for people living with disabilities and how influential and life changing technology is in their lives.
If we were to redo this project we would definitely choose a different screen. During our feedback session, we received a lot of comments on the “time delay for color identification.” And, although we checked with Bill during our prototype meeting and he said he didn’t mind the delay, it was a component we wanted to fix in future designs. The E-Ink display provides the high contrast we needed, however, a screen with similar contrast that doesn’t take as long to display would speed up the process of scanning and allow us to display more feedback to the user.
We think most of the problems we face with the nature of the device such as the “flashing lights” and requiring “AC power” could be fixed simply by finding a different screen to work with. However, because these problems were realized during the process of creating the device, it was difficult to start from scratch with a new screen when we didn’t have all the other components ready. Therefore, if we were to take this project further we would like to get a variety of screens and by plugging it into our now well made system and just testing which screen is the most appropriate to do the task in the most effective way possible.
Also something we didn’t consider was only turning on the light when the button was pressed. We had a light switch but in hindsight that switch was largely unnecessary as the encasing completely closes off the scanners from external light. This makes it so when the light is off it simply reads black. So, during our in-person feedback, one comment regarding how to modify this feature was to add a “photocell or contact switch to know if it’s on a surface to trigger the light” of the sensor.
A simple change that we implemented immediately after receiving feedback was observation about the “sharp edges”. It was the last finishing detail of the box we completely blanked out on, and we agreed that it is definitely ideal to sand down the acrylic edges so that the box is more holdable.
There are definitely other factors that could be modified such as adding a “sound” or a “handle”, but we really wanted this project to be about Bill and what he wanted on the device. These ideas did come up in our prototype meeting, but Bill wanted to keep the device simple and just be able to read color so that is what we created. Our main goal of the project was not only making a successful output, but creating something that might actually be helpful for Bill and something he will make use of on a daily basis. We are so thankful that we could work with Bill for this project and we learned a lot from him, so we really wanted to make a positive contribution to Bill’s life and just make him happy. 🙂
Block Diagram & Schematic

Electrical Schematic of our Color Sensor

Block Diagram for our Project
Code
/*
Color Sensor by Team Lacerta
by Jonathan Lindstrom, Sarah Yun, Freda Su

Reads the color as RGB using the TCS34725 sensor, then converts it to HSV for easier interpretation.

Hue can easily be divided into sections because a certain range of hue goes with a certain color.
However, the sat/val (decides light/dark/grayscale) doesn't have straight cutoffs, so we use circle
math to divide a hue into pie slices (for light/medium/dark adjective), and the sat and val coordinates
will determine which pie slice it lands on. If it lands outside the pie, then it must be grayscale. We
also manually check for brown/tan since that's a color in Bill's wardrobe that doesn't naturally occur
in the hue spectrum (hue is red to yellow, with a sat and val that ends up on the crust of the pie).

Finally, we send all of this info to the eink display, which is only updated when the button is pressed
to prevent it from constantly refreshing, which is bad for the lifespan. We also have a light switch to
help control the power use if he wants to leave the power on for a while.

pinouts reference: https://learn.adafruit.com/adafruit-2-13-eink-display-breakouts-and-featherwings/pinouts

    Name     | Arduino pin |       Sensor Pin      | description
 ------------|-------------|-----------------------|----------------------------------------------------
  EPD_CS     |      9      |  ECS on EINK          | E-Ink Chip Select, required for controlling the display
  EPD_DC     |      10     |  EDC on EINK          | Data/Command pin, required for controlling the display
  SRAM_CS    |      6      |  SRCS on EINK         | SRAM Chip Select, required for communicating with the onboard RAM chip.
  EPD_RESET  |      8      |  RST on EINK          | This is the E-Ink Reset pin, can set to -1 and share with microcontroller Reset
  EPD_BUSY   |      7      |  BUSY on EINK         | this is the e-Ink busy detect pin, and is optional if you don't want to connect the pin
  BUT        |      4      |  Push Button          | Used to tell the screen when to display a color
  LIGHT      |      A0     |  LIGHT on RGB Sensor  | Used to be able to switch this light on/off to conserve power
  SWITCH     |      A2     |  Slide Switch         | Used to tell the light when to turn on/off
  SCK        |      15     |  SCK on EINK          | SPI Clock Pin required for EINK and SRAM
  MOSI       |      14     |  MOSI on EINK         | SPI Microcontroller Out Serial In pin, it is used to send data to SRAM and e-Ink display
  MISO       |      16     |  MISO on EINK         | SPI Microcontroller In Serial Out pin, its used for the SRAM
  SDA        |      2      |  SDA on RGB Sensor    | Used to provide SDA connection to Adafruit Color Sensor
  SCL        |      3      |  SCL on RGB Sensor    | Used to provide SCL connection to Adafruit Color Sensor


documentation/resources referenced:
https://www.geeksforgeeks.org/program-change-rgb-color-model-hsv-color-model/?ref=gcse
https://learn.adafruit.com/adafruit-gfx-graphics-library
https://learn.adafruit.com/adafruit-eink-display-breakouts/overview
https://learn.adafruit.com/adafruit-color-sensors/library-reference
*/

#include <Wire.h>
#include "Adafruit_ThinkInk.h"
#include "Adafruit_TCS34725.h"
#include "Adafruit_GFX.h"
#include "Fonts/FreeSans18pt7b.h"

#define EPD_CS 9
#define EPD_DC 10
#define SRAM_CS 6
#define EPD_RESET 8
#define EPD_BUSY 7
#define BUT 4
#define LIGHT A0
#define SWITCH A2

//Makes it so the screen only tried to update once everytime the button is pressed
bool buttonOnce = false;

ThinkInk_213_Mono_BN display(EPD_DC, EPD_RESET, EPD_CS, SRAM_CS, EPD_BUSY);
Adafruit_TCS34725 tcs = Adafruit_TCS34725(0x00, TCS34725_GAIN_16X);
//700ms integration time, gain <16x (sensitivity of sensor, adjust to enviro)


void setup() {

  pinMode(BUT, INPUT);
  pinMode(LIGHT, OUTPUT);
  Serial.begin(115200);
  while (!Serial) {
    delay(10);
  }
  //Set up EINK display
  display.begin(THINKINK_MONO);
  if (tcs.begin()) {
    Serial.println("Found");
  } else {
    Serial.println("No TCS34725 found ... check your connections");
    while (true)
      ;
  }

  display.setTextColor(EPD_WHITE);
  display.setFont(&FreeSans18pt7b);
  digitalWrite(LIGHT, HIGH);
}

void loop() {
  display.clearBuffer();

  //Set up color Sensor
  uint16_t r, g, b, c, colorTemp, lux;
  tcs.getRawData(&r, &g, &b, &c);
  colorTemp = tcs.calculateColorTemperature_dn40(r, g, b, c);
  lux = tcs.calculateLux(r, g, b);

  r = r >> 8; //Convert rgb down to 8 bits in binary
  g = g >> 8;
  b = b >> 8;
  rgb_to_hsv(r, g, b);
}

//convert rgb to hsv, calls helper fxn to compute color and adjectives to display, along w rgb
void rgb_to_hsv(uint16_t r2, uint16_t g2, uint16_t b2) {

  double r = r2 / 255.0;
  double g = g2 / 255.0;
  double b = b2 / 255.0;

  // h, s, v = hue, saturation, value
  double cmax = max(r, max(g, b));  // maximum of r, g, b
  double cmin = min(r, min(g, b));  // minimum of r, g, b
  double diff = cmax - cmin;        // diff of cmax and cmin.
  double h = -1, s = -1;

  // if cmax and cmax are equal then h = 0
  if (cmax == cmin) {
    h = 0;
  }

  // if cmax equal r then compute h
  else if (cmax == r) {
    h = fmod(60 * ((g - b) / diff) + 360, 360);
  }

  // if cmax equal g then compute h
  else if (cmax == g) {
    h = fmod(60 * ((b - r) / diff) + 120, 360);
  }

  // if cmax equal b then compute h
  else if (cmax == b) {
    h = fmod(60 * ((r - g) / diff) + 240, 360);
  }

  // if cmax equal zero
  if (cmax == 0) {
    s = 0;
  } else {
    s = (diff / cmax) * 100;
  }
  // compute v
  double v = cmax * 100;

  if (digitalRead(SWITCH))
  {
    digitalWrite(LIGHT, HIGH);
  }
  else
  {
    digitalWrite(LIGHT, LOW);
  }

  while (digitalRead(BUT)) {
    buttonOnce = true;
  }
  if (buttonOnce) {
    display.fillScreen(EPD_BLACK);
    String sn = checkSatVal(s + .5, v + .5);  //crude rounding function
    display.setCursor(0, display.height()/2 - 10);  //have more space default 1 line
    if (sn == "g")
    {
      display.println("grayscale");
    }
    else
    {
      String brown = checkBrown(h + .5, s + .5, v + .5);
      String color = pickColorHue(h + .5);

      if (brown.length() + sn.length() + color.length() <= 16)  //max num char per line
      {
        display.print(sn);
        display.print(brown);
      }
      else  //reformat to be 2 lines (dont overflow characters)
      {
        display.setCursor(0, display.height()/3 - 10);  //top left corner ish
        display.print(sn);
        display.println(brown);
        display.setCursor(0, display.getCursorY() - 5);
      }
      display.println(color);
    }

    //rgb display under the color name
    display.setCursor(0, (display.height() + 100) / 2);
    display.print("(");
    display.print(r2);
    display.print(", ");
    display.print(g2);
    display.print(", ");
    display.print(b2);
    display.print(")");
    display.display();
    buttonOnce = false;
    delay(5000);  //prevent fast button presses to protect screen life
  }
}

//determine "base" color
String pickColorHue(int hue) {
  if (hue >= 0 && hue <= 9) {
    return ("pink");
  } else if (hue <= 30) {
    return ("orange");
  } else if (hue <= 70) {
    return ("yellow");
  } else if (hue <= 160) {
    return ("green");
  } else if (hue <= 200) {
    return ("teal");
  } else if (hue <= 255) {
    return ("blue");
  } else if (hue <= 300) {
    return ("purple");
  } else if (hue <= 340) {
    return ("pink");
  } else if (hue <= 350) {
    return ("magenta");
  } else if (hue <= 360) {
    return ("red");
  } else {
    return ("");  //wont happen bc hue range 0 to 360
  }
}

//check for brown specifically bc not in main colors of hue spectrum
String checkBrown(int hue, byte sat, byte v) {
  if ((0 <= hue) && (hue <= 50)) {
    //brownish area, also check for tan area
    byte tanRad = 10;  //determine radius visually online
    //core tan color: (34, 33, 82)
    if ((24 <= hue) && (hue <= 44))  //hue is within +/-10 of tan hue
    {
      //circle around core color
      int x = sat - 33;  //saturation = x
      int y = v - 82;    //val = y
      byte r = sqrt(pow(x, 2) + pow(y, 2));
      if (r <= tanRad) {
        return "tan ";
      }  //otherwise, fall thru to normal brown case
    }

    byte lowRad = 60; //boundaries for the crust of pie
    byte highRad = 75;
    int x = sat - 100;  //saturation = x
    int y = v - 100;    //val = y
    byte r = sqrt(pow(x, 2) + pow(y, 2));
    if ((lowRad <= r) && (r <= highRad))  // in "crust" of pie
    {
      return "brown ";
    } else {
      return "";
    }
  } else {
    return "";
  }
}

//determine light/dark/grayscale for color
String checkSatVal(byte sat, byte v) {
  int circleEq = pow((sat - 100), 2) + pow((v - 100), 2);

  byte rad = 98;  //inside pie radius

  if (circleEq <= (pow(rad, 2))) {
    int x = sat - 100;  //saturation = x
    int y = v - 100;    //val = y
    double angle = atan2(y, x);
    byte r = sqrt(pow(x, 2) + pow(y, 2));
    //edge case: not in a pi slice if in the corner
    if ((r == 0) || ((-7 * M_PI / 8 <= angle) && (angle <= -5 * M_PI / 8))) return "";  //just pure color
    if (angle < -7 * M_PI / 8)                                                          // between -pi and -7pi/8
    {
      return "light ";
    } else  // between -5pi/8 and -pi/2
    {
      return "dark ";
    }
  } else {  //outside of pie: grayscale

    return "g";  //flag to remove for display: dont put adjectives for white/gray/black
  }
}
Link for Files:
DXF files for the box and 3D model for the sensor housing: Files