grape – FinalProject


This system transcribes your pitch into a plot in realtime.

Some inspirations.

This idea was primarily inspired by the music synced tracks made by people in the Line Rider community such as this track created by DoodleChaos, which took them 3 months to complete by hand and this track by Rabid Squirrel, which took them a whole 18 months to complete (I highly recommend watching this one).

After hearing Golan talk about asemic writing systems, I began to reevaluate my idea as an archival practice rather than a visual accompaniment. Sweetcorn also suggested that I take a look at cursive shorthand, and I was particularly blown away by tersive shorthand and zhong hua yu zi(中华语字).

Process.

I first got Max MSP’s monophonic pitch detection working to send pitch data to Processing.

The patch sends over the note detected relative to C. This means, for example, that if it detects a D it will send over 1 as opposed to a B where it will send over a 12.

I then began drafting an alphabet for my processing sketch. My first impulse was a draft a geometric alphabet consisting of 12 different symbols. I think one issue I encountered was trying to figure out which features I wanted to preserve, such as pitch, duration, octave, whether it was an incident or not, and dynamics. At this stage, I was influenced by my familiarity with traditional Chinese musical notation (工尺).

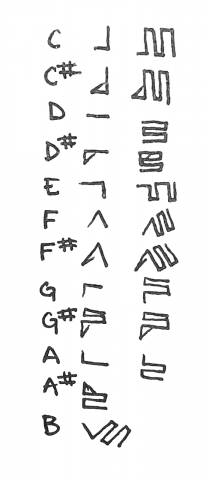
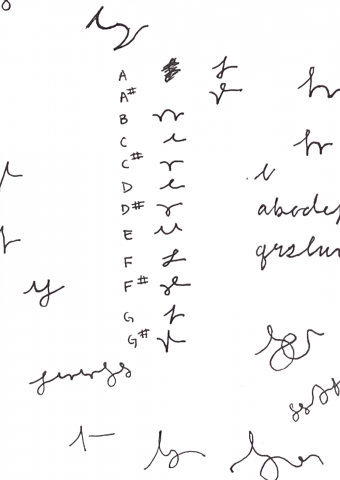
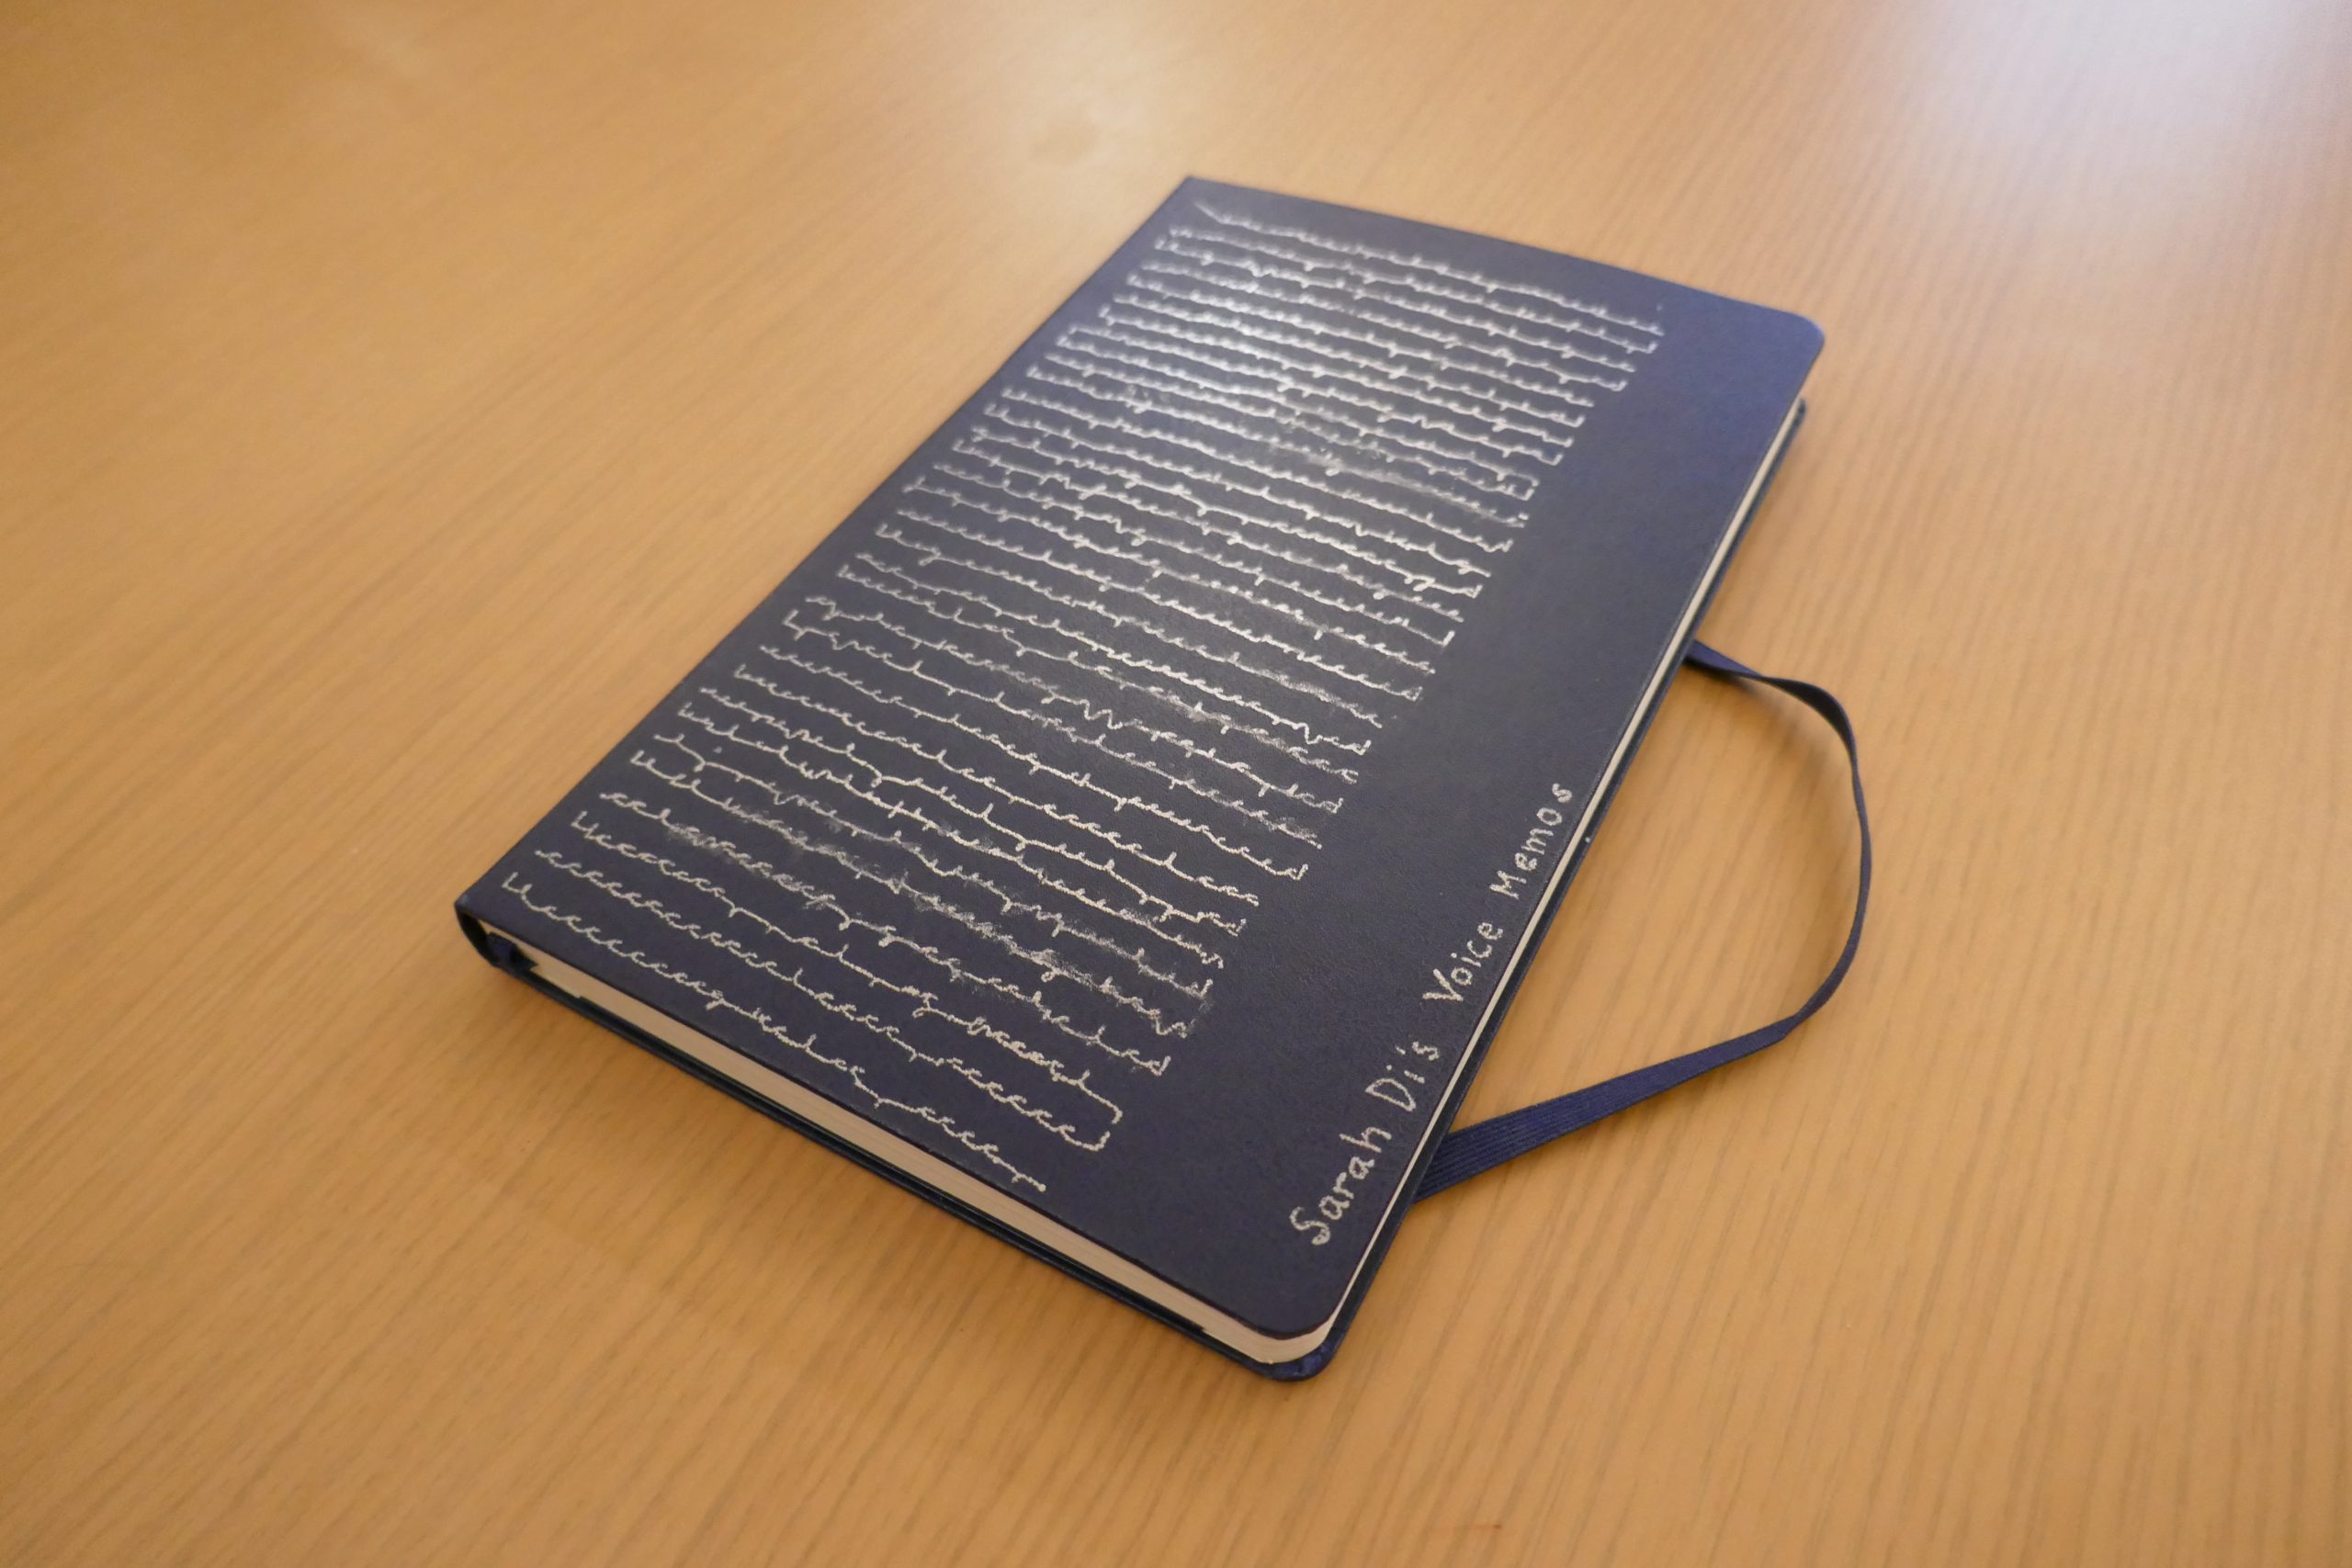
Ultimately, I settled on this alphabet.

Each note corresponds to a symbol. I ignore flats in favor of sharps, and indicate that a note is a sharp with a serif.

To preserve duration, every time my program reevaluates the current pitch, it adds a small snaking line, so that the length of the snake tacked onto each symbol represents how long that note was held.

Rests are denoted by whitespace, but the length of rests are ignored.

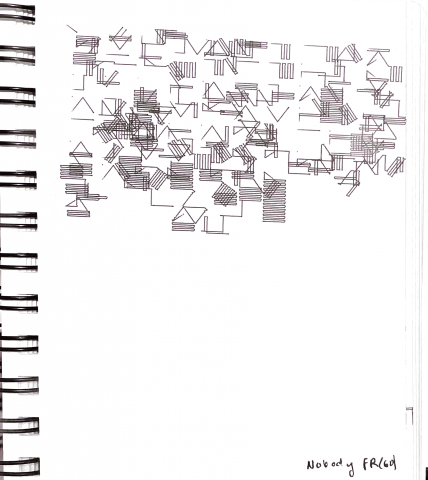
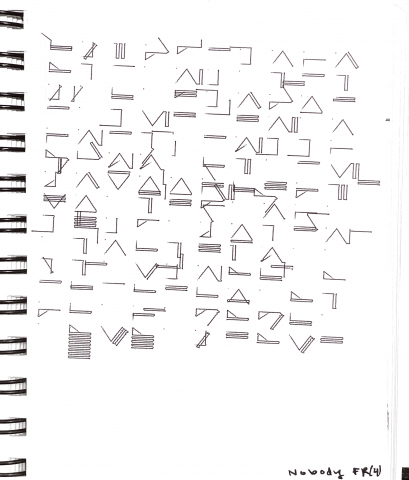
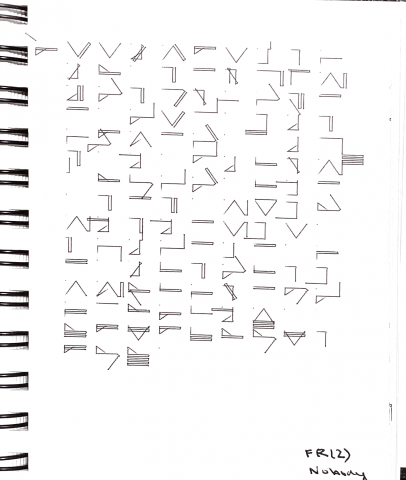
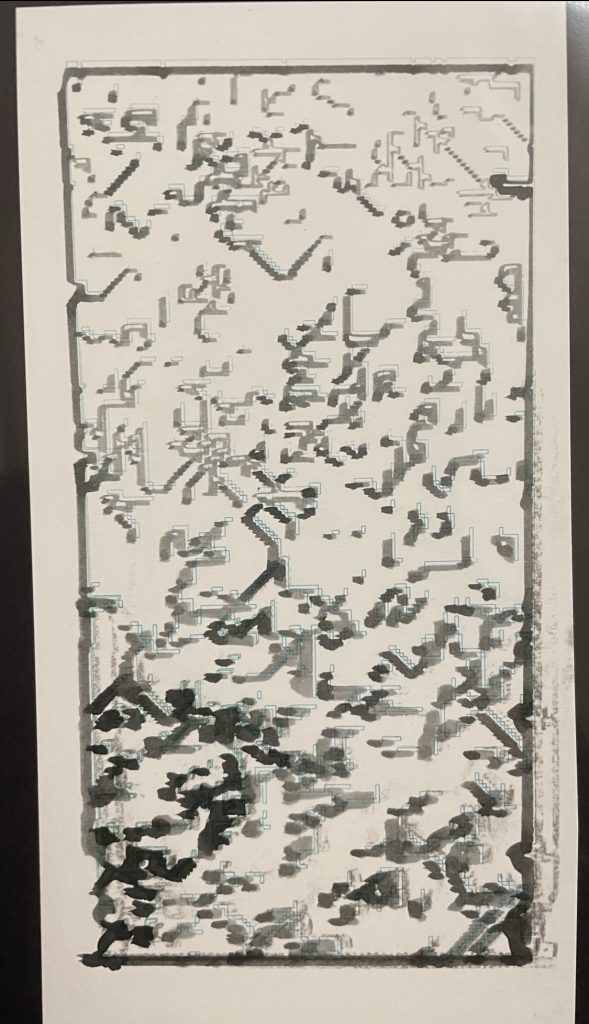
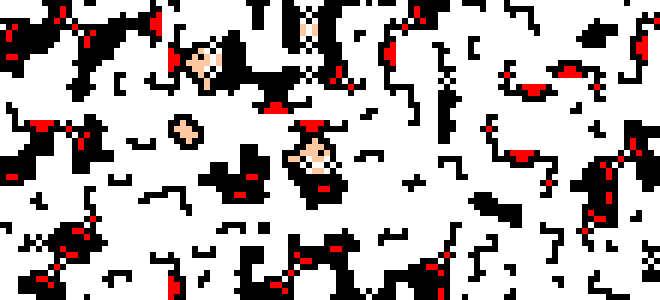
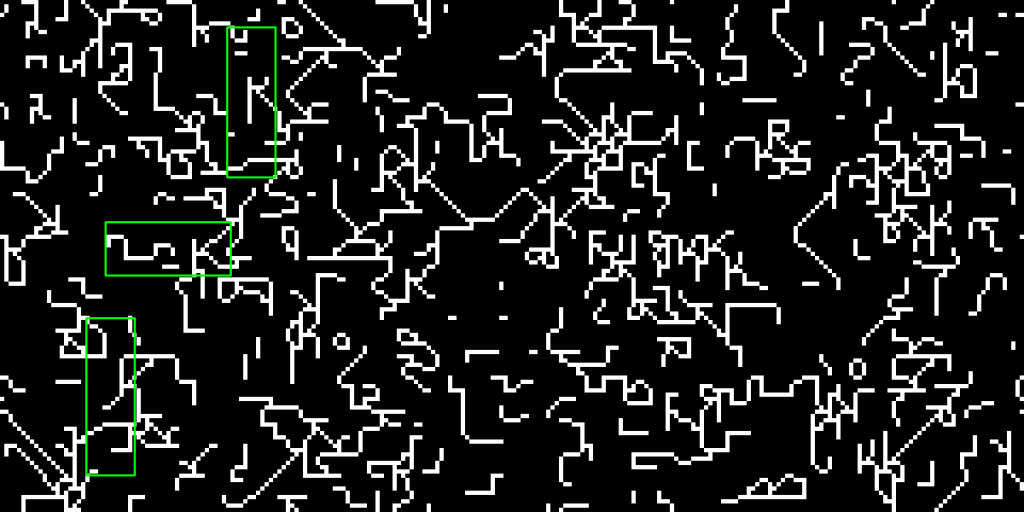
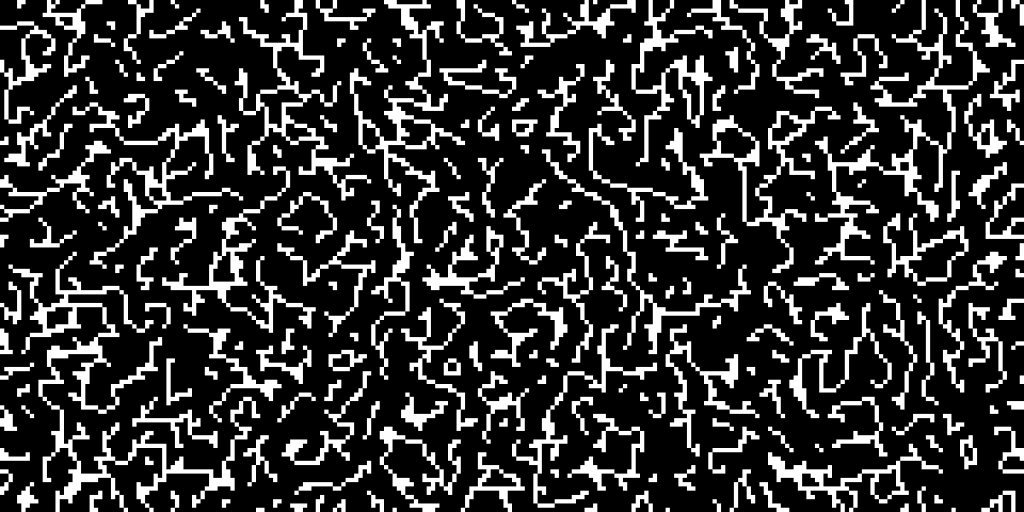
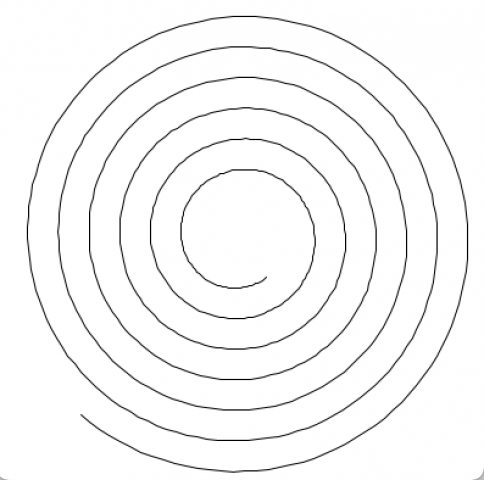
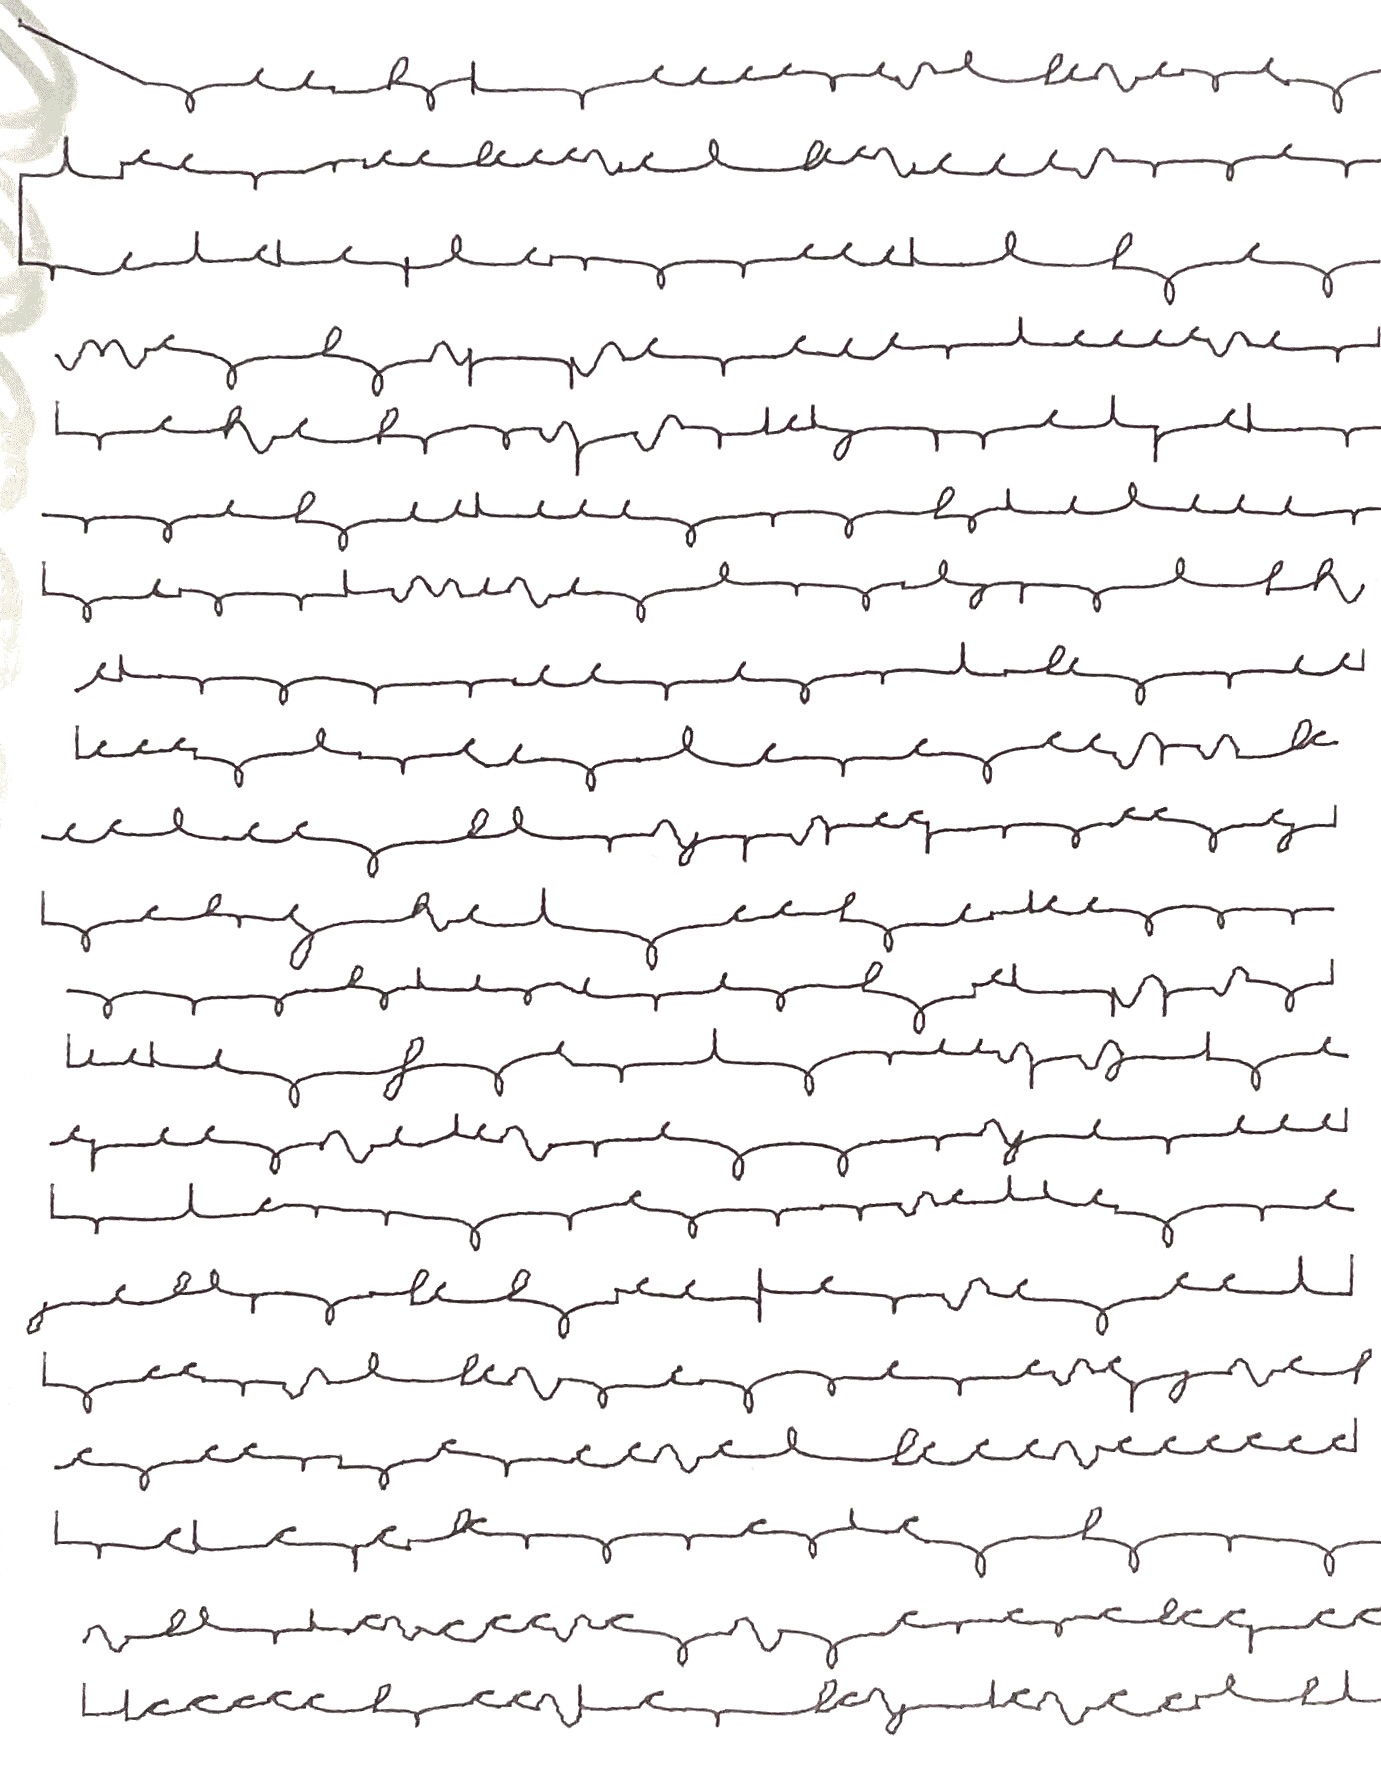
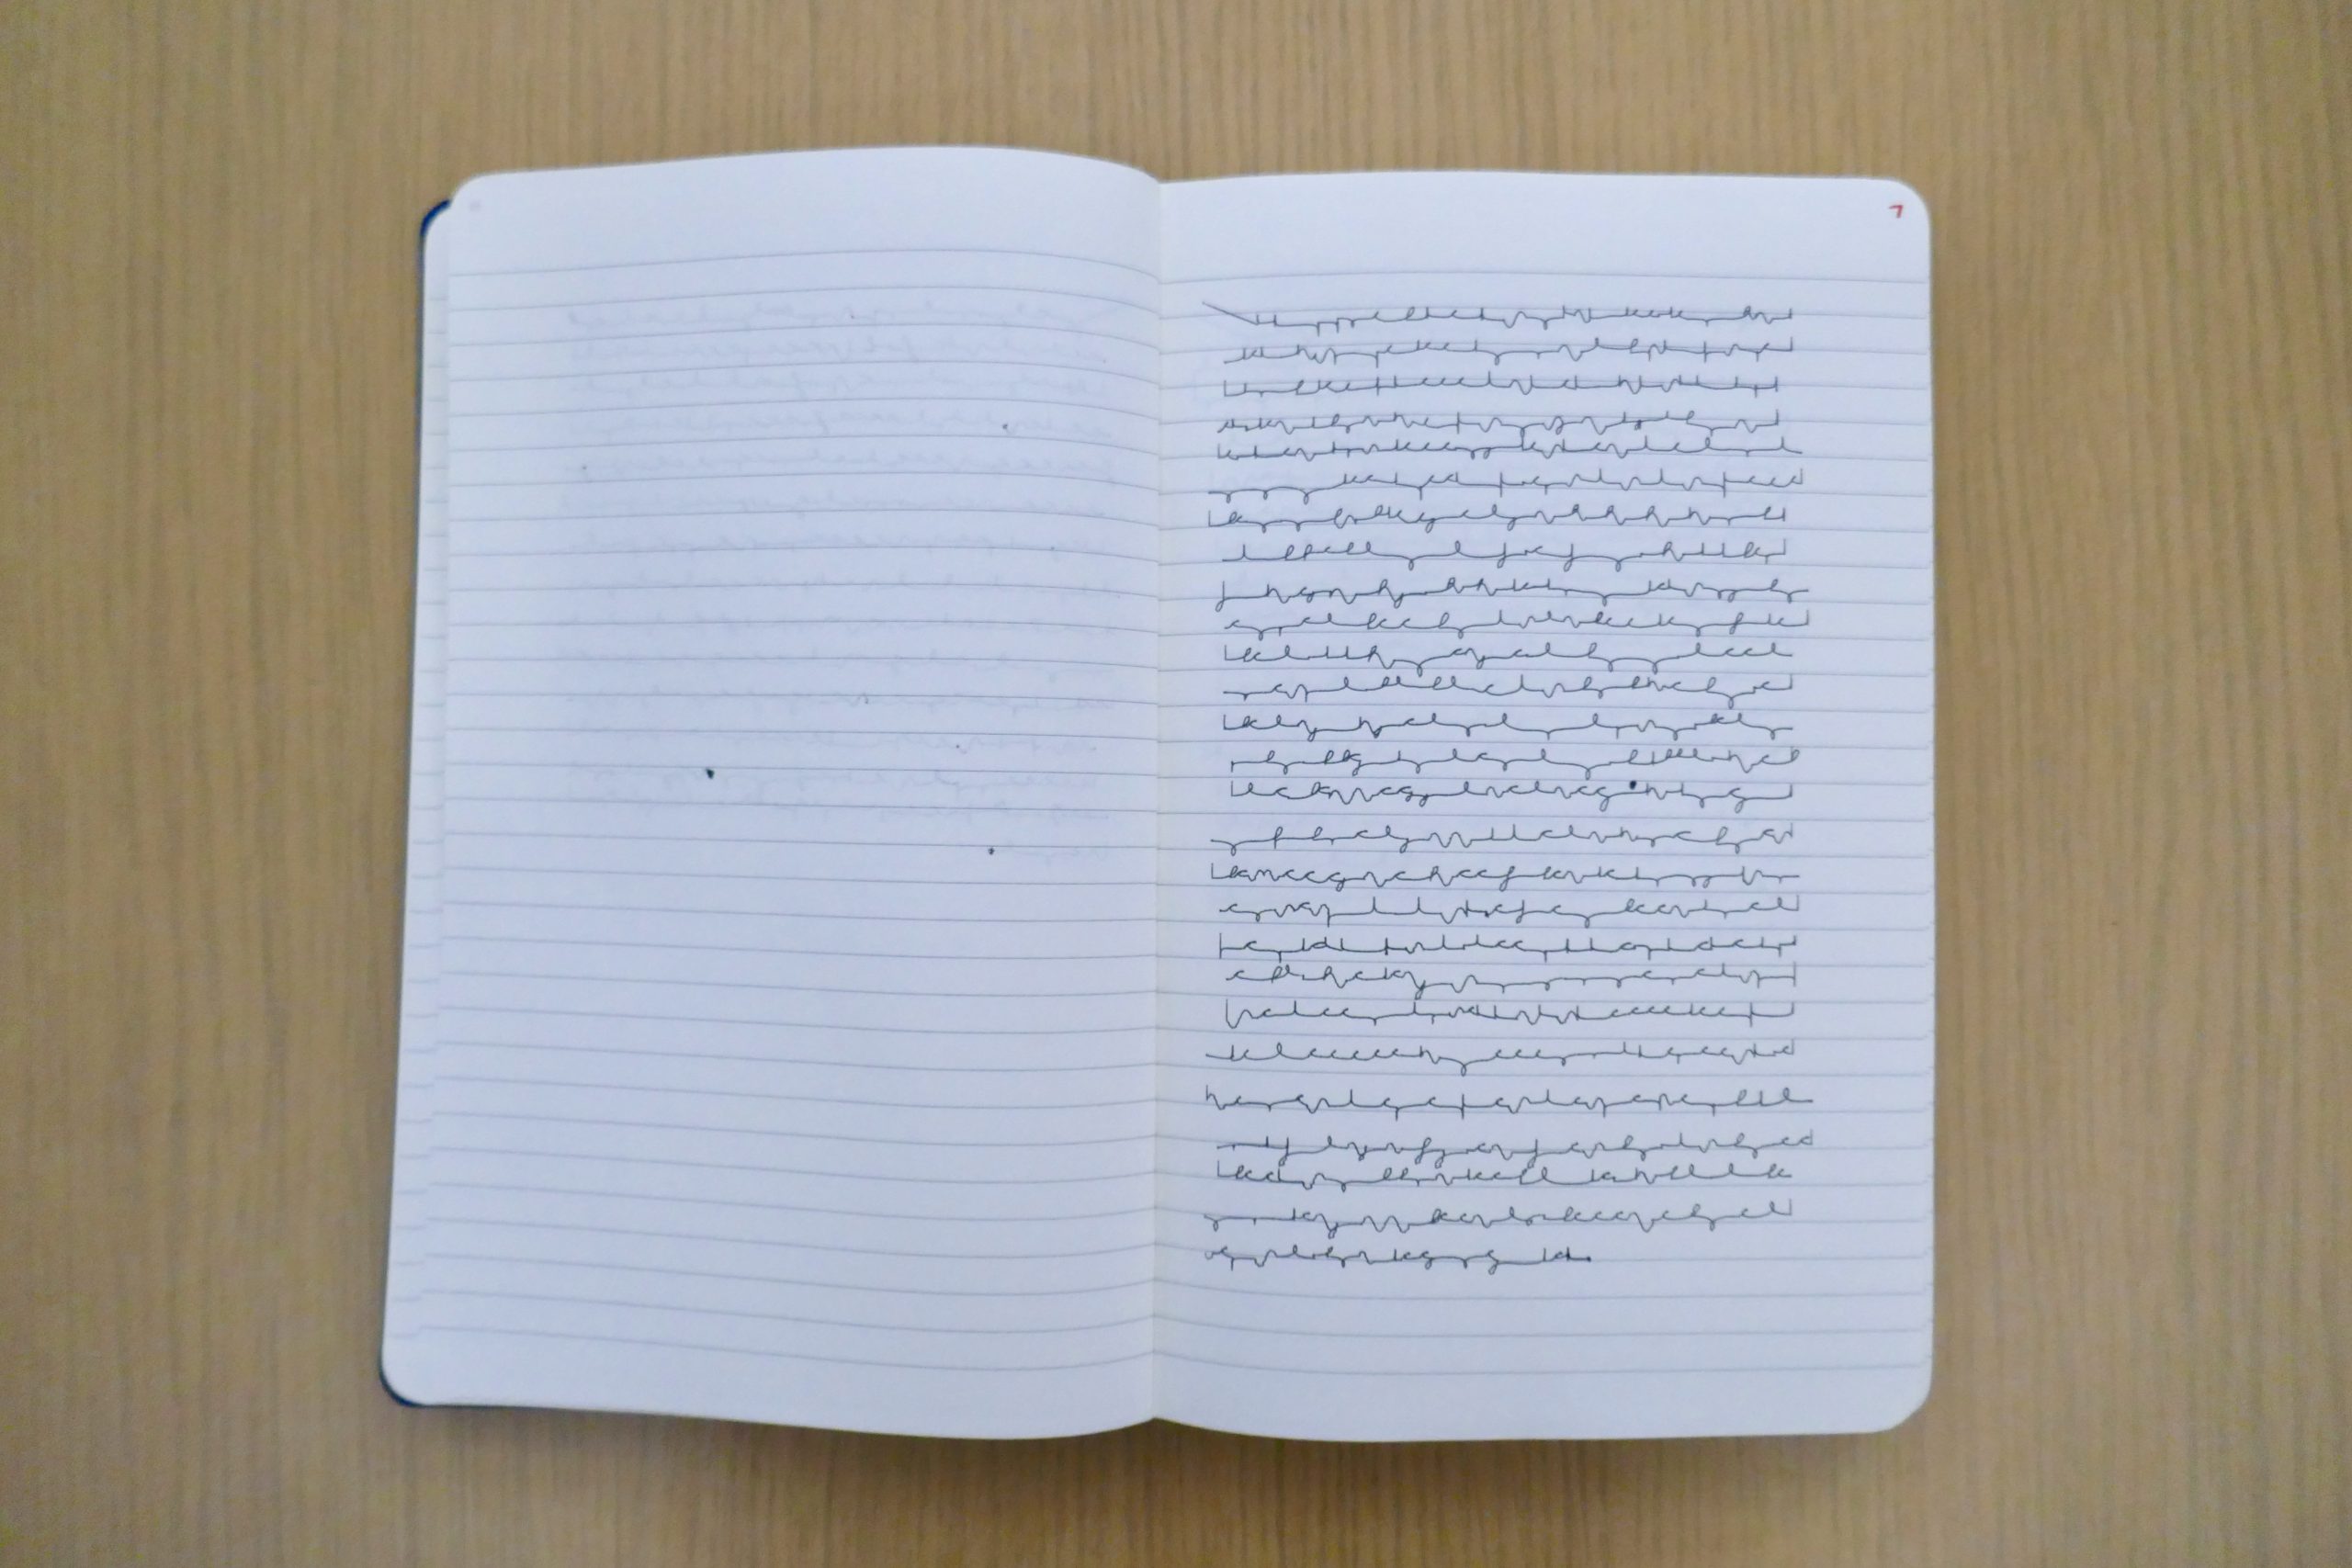
vvv  These are some plots that used this system.

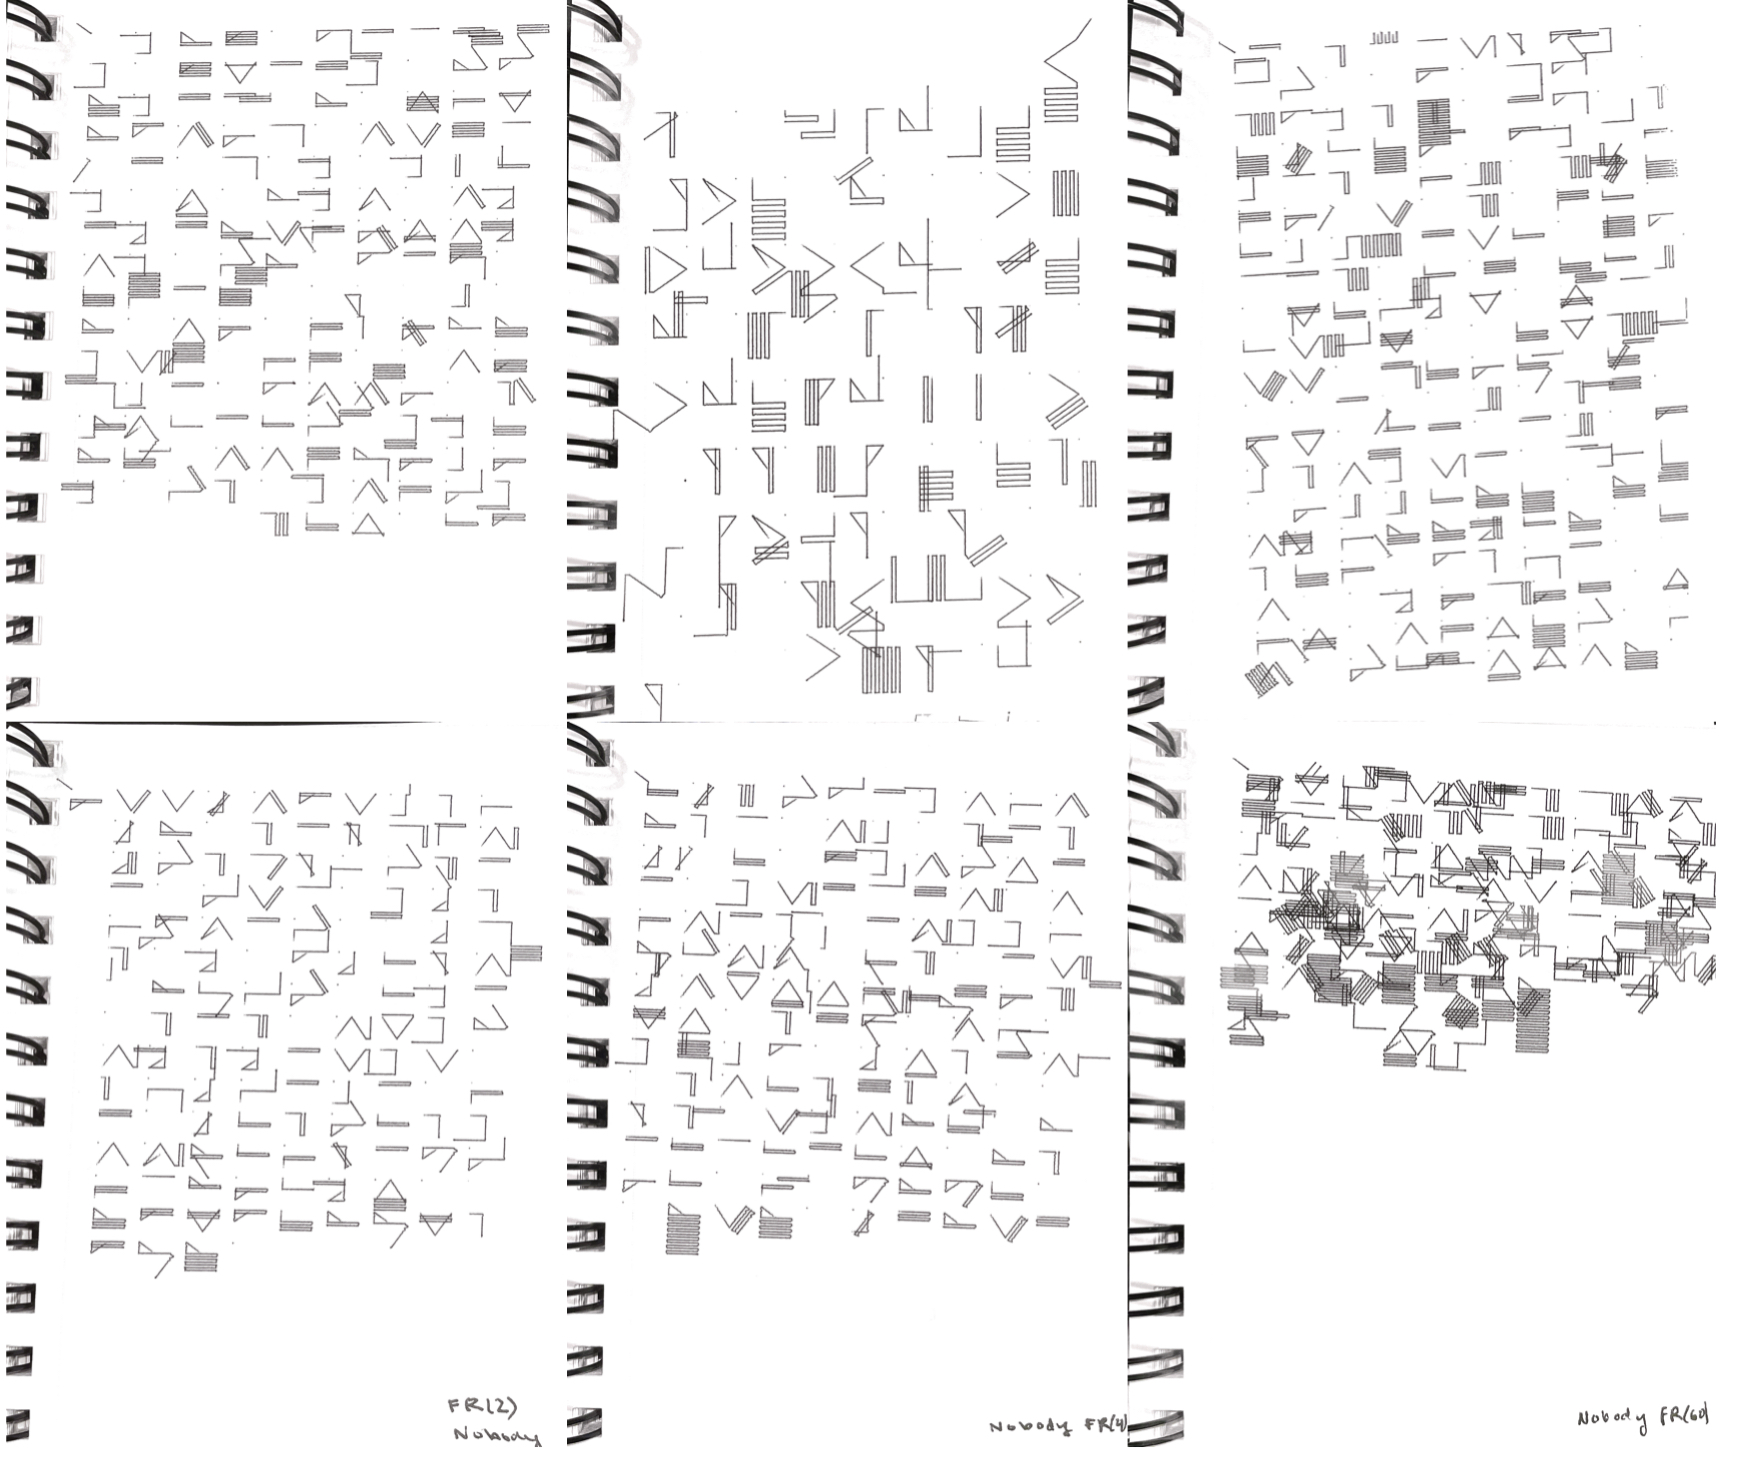
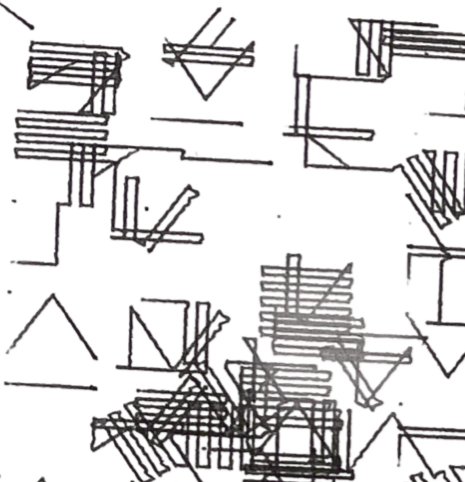
< ^ The bottom three plots (and this close up shot) highlight the amount of variation (chaos?) that can be achieved by changing the frame rate. Processing usually calls draw() at 60 fps, but this created too many unpredictable symbols for my preference.

At the end of a plot, I wanted something I could still decipher.

Additionally I originally plotted my symbols from left to right, similar to how I write. This however made the Axidraw fall out of sync with my pitch, since it needed time to go to the next line. This was fixed by plotting the symbols in boustrophedon (left to right, then right to left, alternating), which minimized the distance.

[videopack id=”2511″]https://courses.ideate.cmu.edu/60-428/f2021/wp-content/uploads/2021/12/IMG_9327-3.mov[/videopack]

Even with this fix, I was still unsatisfied with the Axidraw’s ability to keep up with me. This was mostly due to my initial alphabet, since each of the symbols had a different start position which added more moving time in between pitches. I also didn’t like how distinct each symbol was, since I didn’t think pitch should look as “blocky” as what it became on paper.

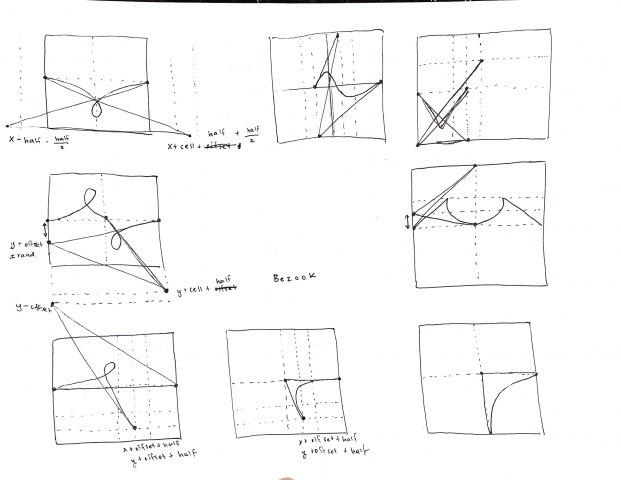
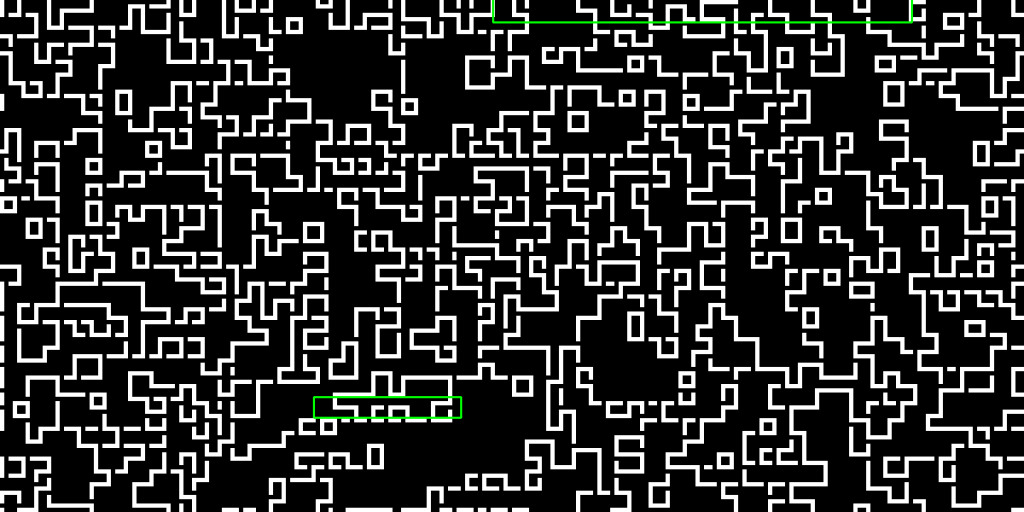
To fix this, I revised my alphabet to look more organic and to standardize the starting position. I did this through playing around with bezier curves.

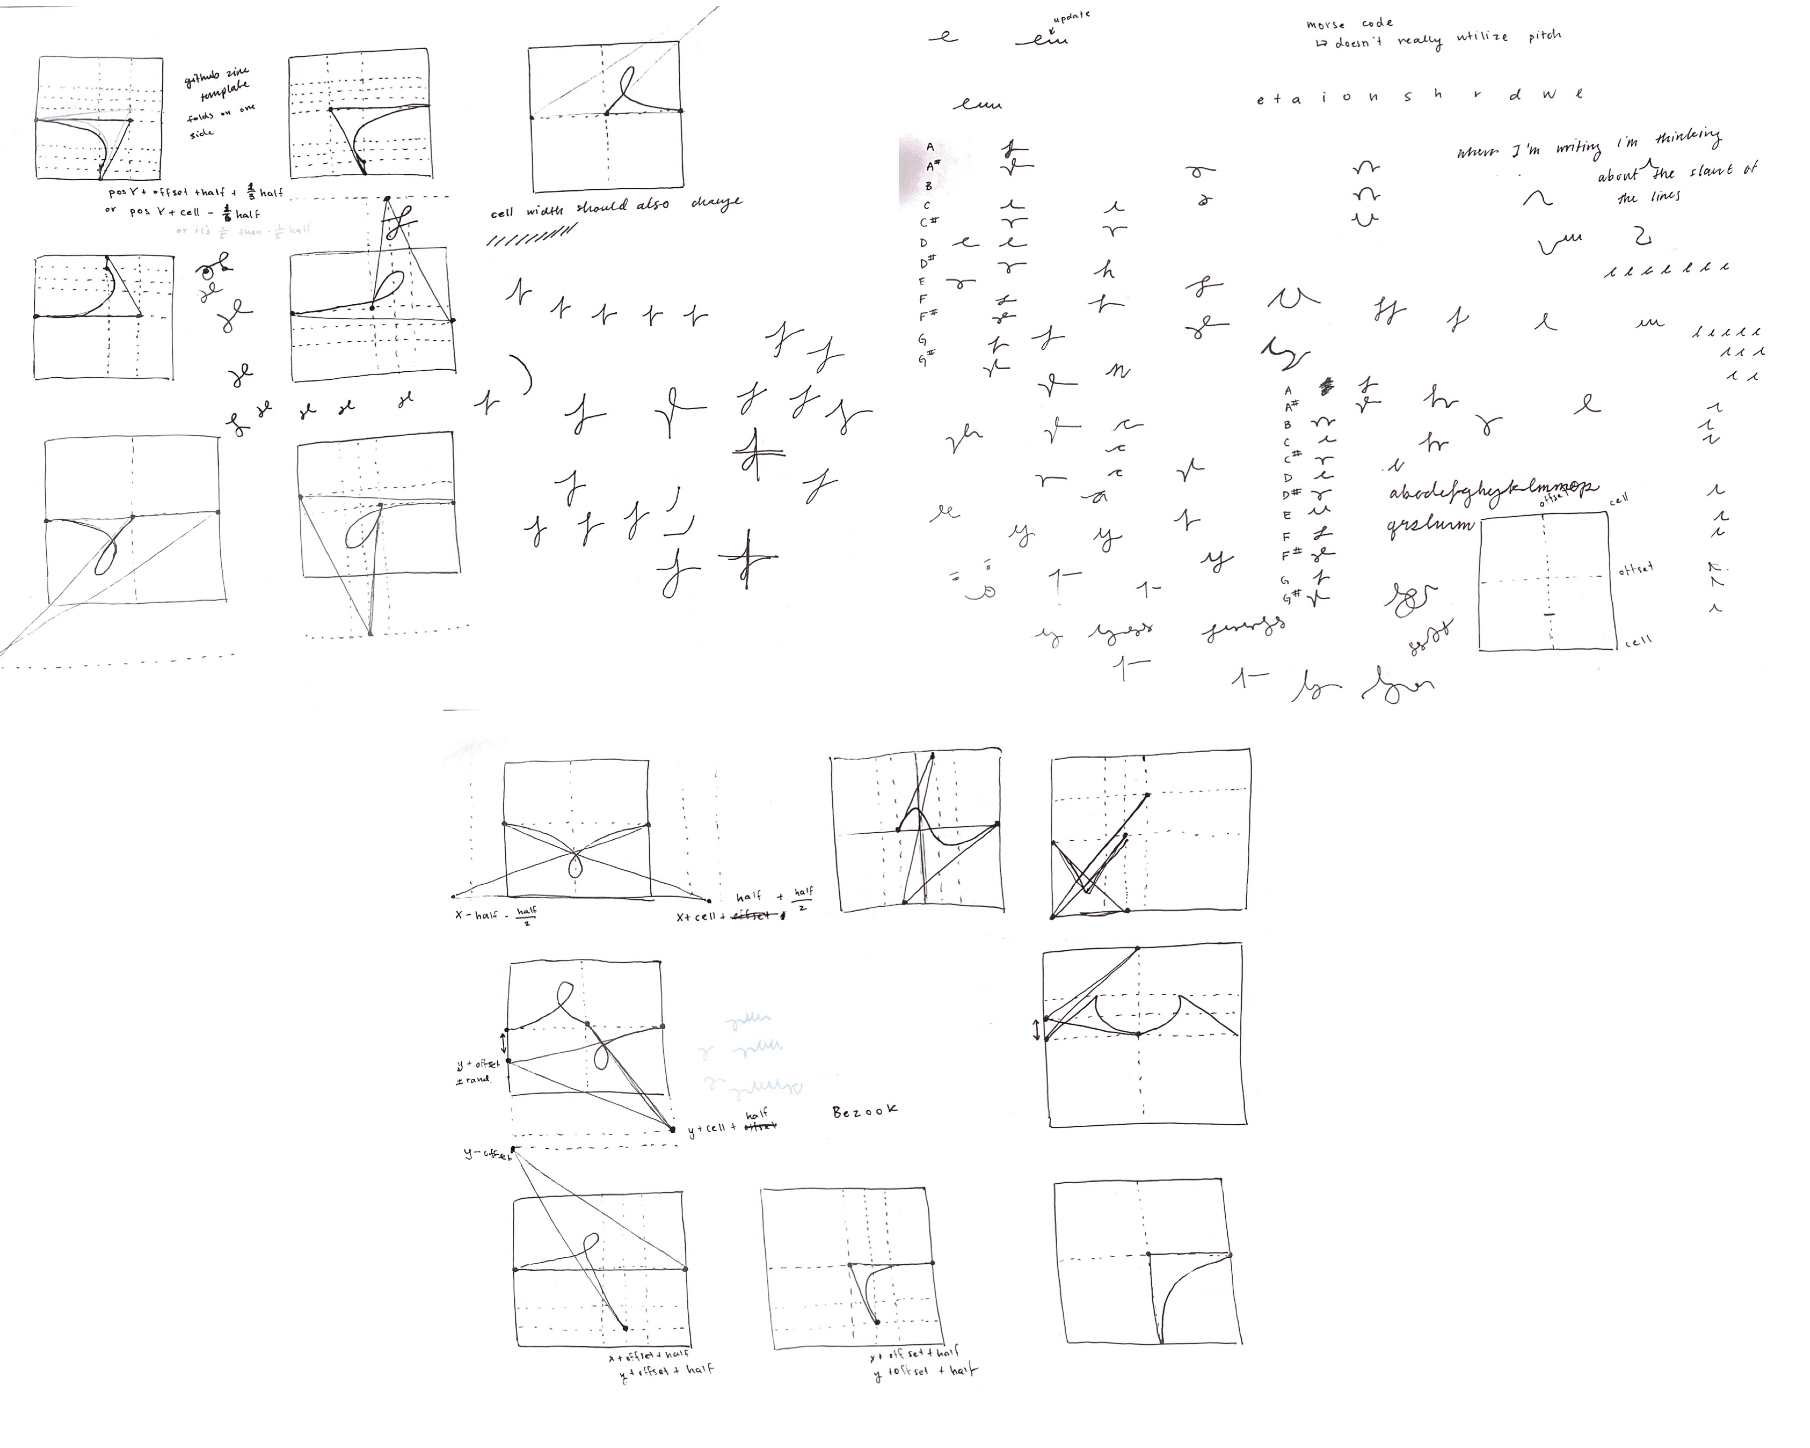
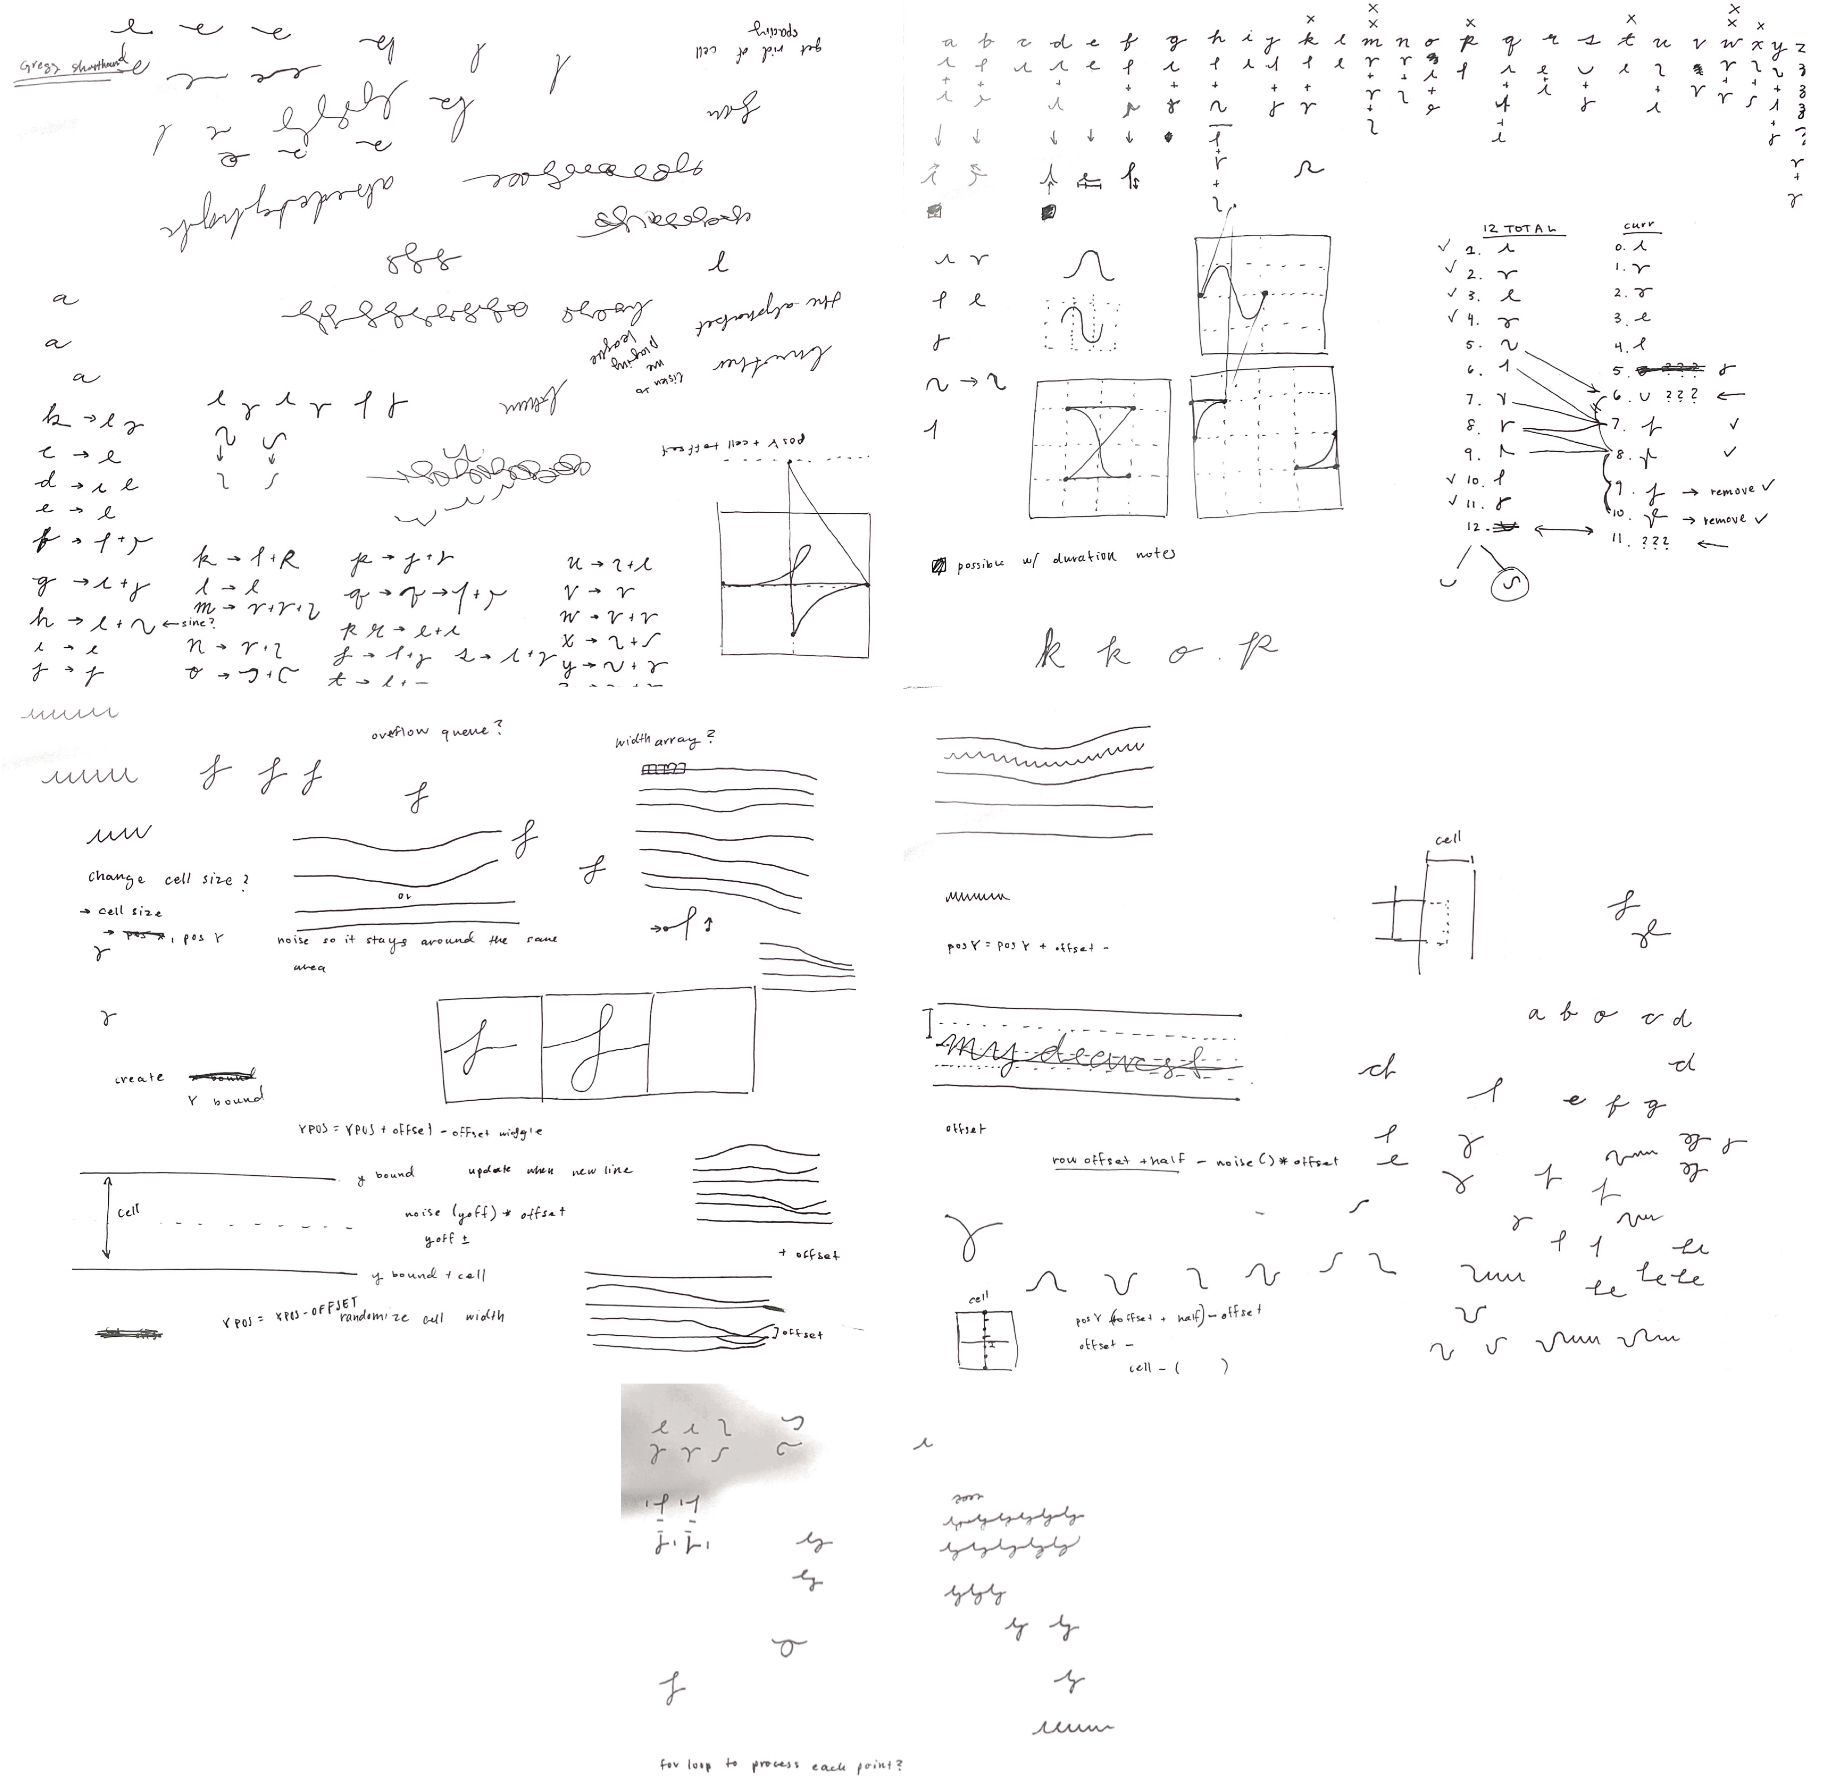
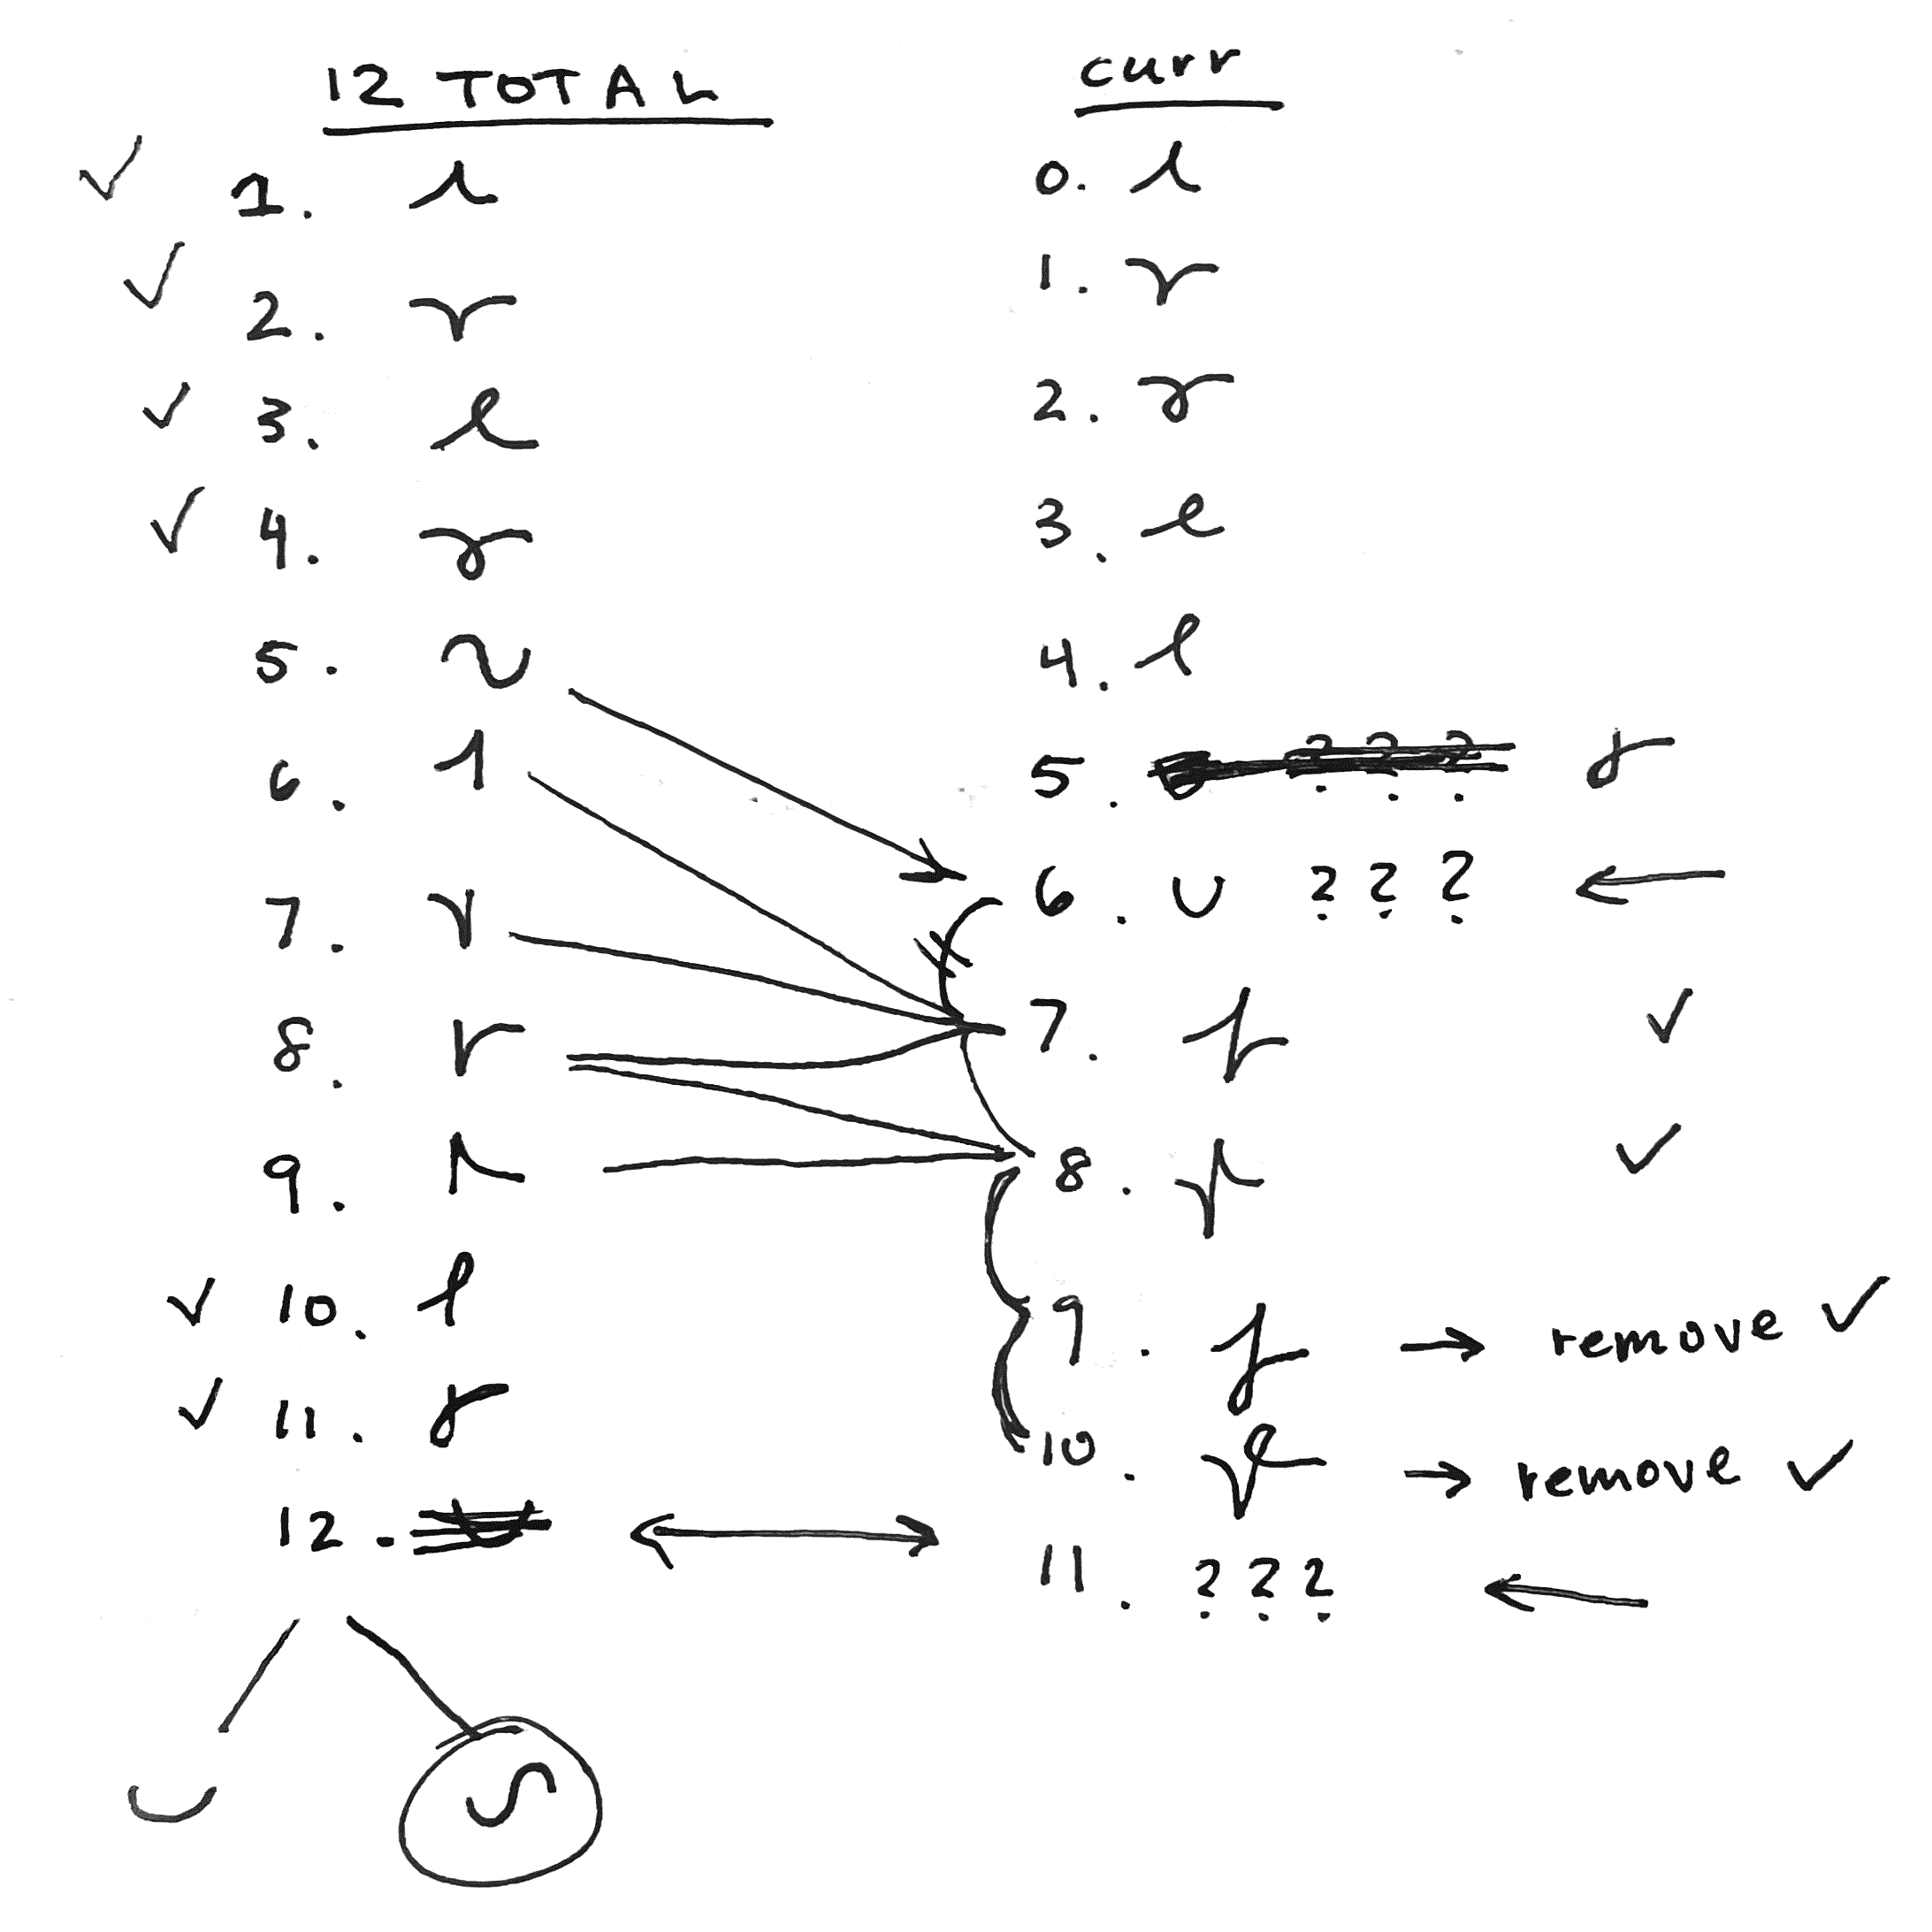
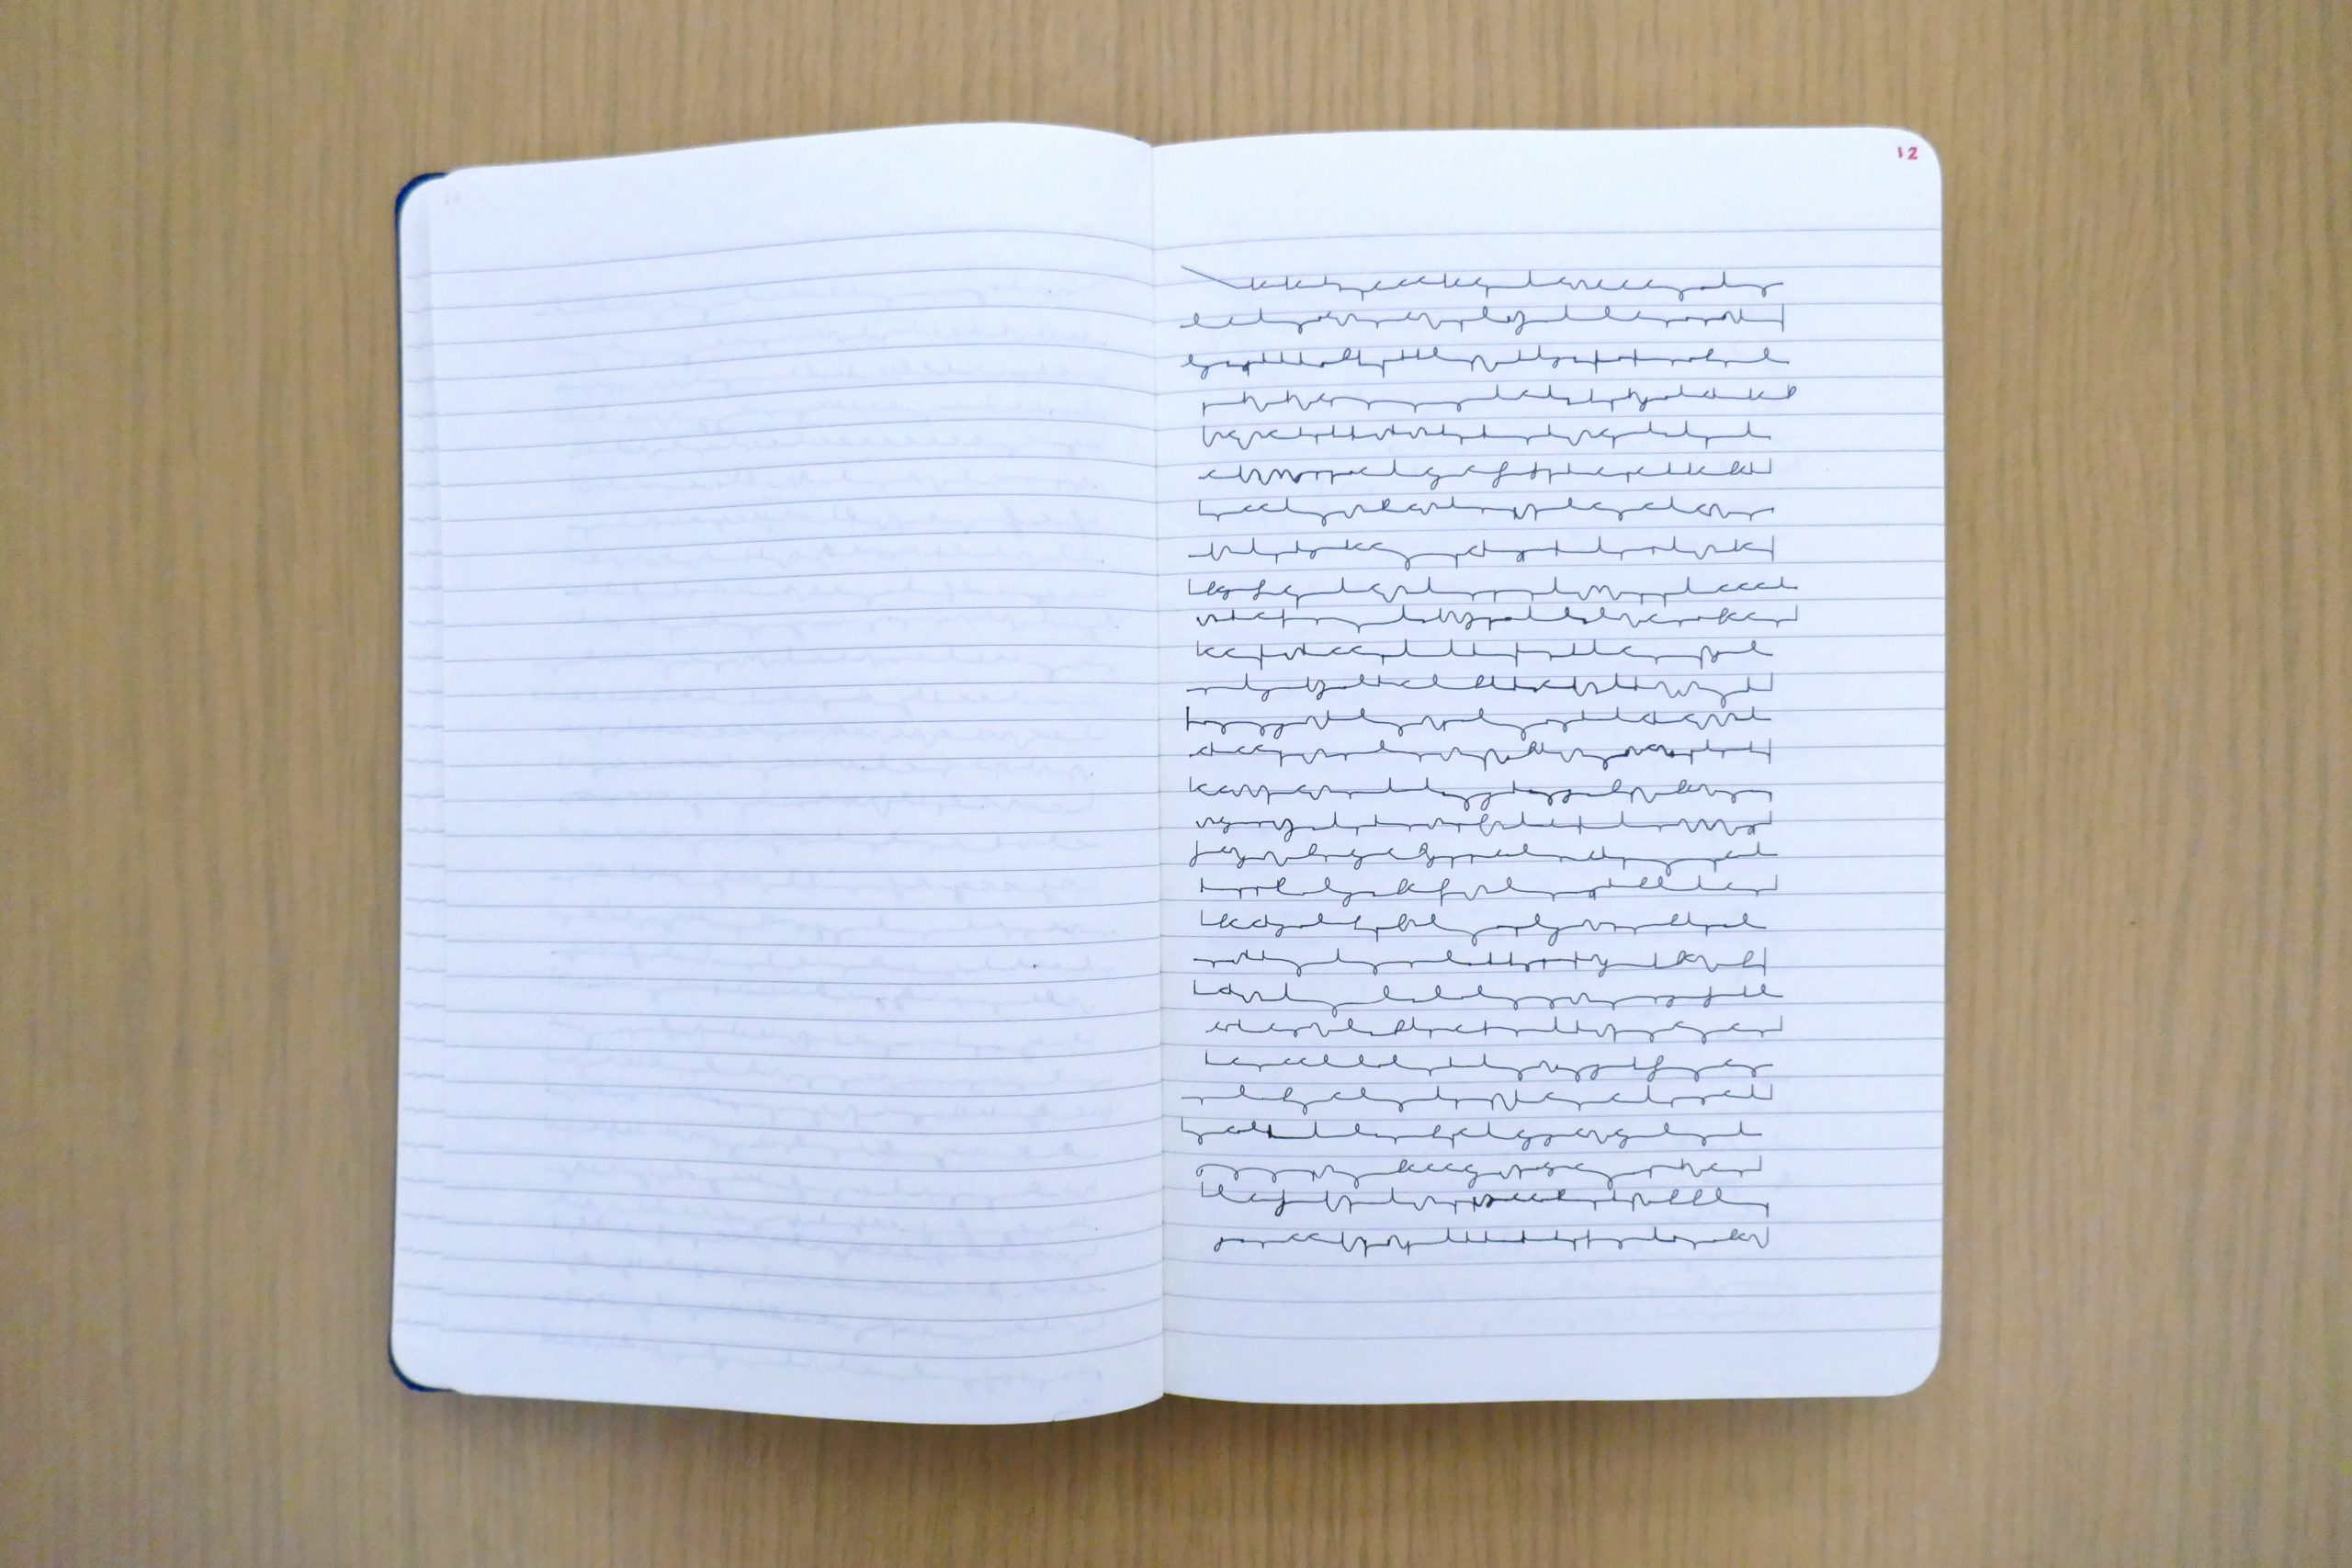
After drafting more symbols, I finalized another alphabet.

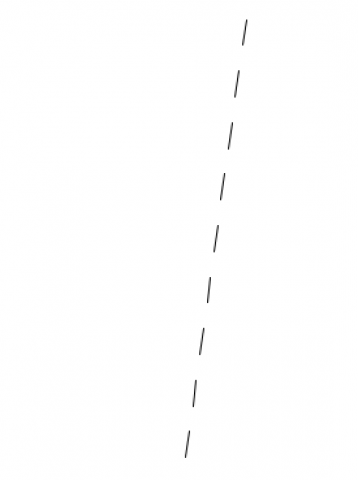
Instead of drawing “snakes” to denote duration of pitch, I switched to drawing little spikes. Each symbol starts and ends at the same place. I also added in noise to the individual symbols and to the Axidraw’s plotting direction to give the plot a more handwritten quality.

< Here’s a plot with the new alphabet

More documentation.

Takeaways.

I learned a lot about how structuring a working pipeline (Max MSP to OSC to Processing to CNC server to Axidraw). I feel more knowledgeable about what resources are available for and the current limitations of pitch detection, which will help me immensely with future audio related projects experimentation. I still have more in plan for this project, such as adding in generated computer-generated lyrics using pronouncing.py, and additional support for quick changes in pitch.


grape – FinalWiP

As I mentioned in my ProjectProposal post, I was motivated to complete this project out of a desire to have a physical archive of my voice snippets.

[videopack id=”1934″]https://courses.ideate.cmu.edu/60-428/f2021/wp-content/uploads/2021/11/RPReplay_Final1635957413.mov[/videopack]

To make a real time hmhmhmgraph, I had to work with Max MSP’s pitch detection. I made a simple mic patch that sends pitch data to Processing via osc. I then map the pitch to one of 12 total notes that each have their own symbol.


There were some immediate setbacks with plotting in real time. One of which was that I had initially plotted the pitch from left to right, line by line. This however made the plot increasingly inaccurate wrt to my pitch, as the plotter would take a couple seconds to move down to the next line before plotting again. I then opted for a Boustrophedon plotting path, which goes from left to right to right to left in a snaking manner to minimize the time the plotter takes to move without plotting.

Another issue(/non issue) was that the frame rate affected the quality of the plot. Since processing attempts 60 fps, this clobbers my note variable in unpredictable ways. I mentioned that this was a nonissue because it looks cool. Anyway in order to minimize the number of overwrites I just lowered the frame rate to 4. I tried a frame rate of 2, but felt that the plotter became too slow at this speed.

These are all plots to me singing mitski’s nobody.

60 fps

4 fps

2fps

Here’s a video with me singing with it plotting.

https://vimeo.com/646970438

Some things I’d change:

If you notice from the video it can’t pick up grace notes or any quick notes but I’m also not entirely sure how to fix that lol. I’d also want to keep a record of both duration and pitch change and sync it to allison parrish’s pronouncing py  so I can generate lyrics for my voice thingies (song writing is a beat I have yet to vanquish).

I’m also currently in the middle of implementing a new asemic notation using bezier curves that emulate cursive handwriting, just because I think the current system might be too intricate which time intensive on the plotter. Notes are below:


grape – ProjectProposal

For my project I’m planning on figuring out how to use pitch detection for real-time axidraw-ing. It’s already turning out be be a bigger challenge than I anticipated (just with finding pitch-osc right now) but I think after I figure that out it will be alright. I sort of want to plot an asemic language which records something in relation to pitch detection. I create a lot of mini songs in my spare time, but I usually just save them as voice memos in my phone.

[videopack id=”1934″]https://courses.ideate.cmu.edu/60-428/f2021/wp-content/uploads/2021/11/RPReplay_Final1635957413.mov[/videopack]

So I thought it’d be cool if there was a way to turn this into a paper form rather than what it is now (still thinking about how I’d go about this).

Following MidSemester critique, one of the guest critics mentioned wanted to see my organic cell generation bounded in a shape that was less square. So I’m also planning on making little paper chains of cells in the shape of a human body – just thought it’d be fun to do, maybe a little creepy too.

I also want to create a kind of tessellation that resembles the patterns found in chinese paper cutting so that I can axidraw it onto my laptop using the super cool aren pen.

grape – Tiling Pattern / MidSemester

I was half complete with the tiling pattern project when it was due (hence the combined title) so I figured I’d finish it for the MidSemester review.

I first created a 16×16 tile generator so I could draw my name (I made 15 tiles, 3 for each letter). Here are some examples:

I then modified a wave function collapse implementation (after reading up about WFC’s and how they work) mentioned in this Processing thread which is based off of mxgmn’s original implementation to generate tilings of each of the letter tiles I produced as a sort of signature.  And then I converted it to svg using marching squares.

Here’s one

I sort of like how it’s almost a gradient and depending on the type of font the wave function collapse algorithm generates tilings with varying amount of order/disorder.

I also presented a single tiling with used a brush pen, a willow stick, and a fine pen (just to play with the different textures.

I was also interested in exploring different ways of manipulating these tiles. Here are two experiments I did:

In one I wanted to do almost a “where’s waldo” with WFC, so I created a 16×16 waldo tile in my tile maker in processing and then generating multiple tilings.

I sort of want to make this my wallpaper.

Anyways, I ended up not plotting it because I ran out of time. I also think this would look better at a larger scale, so think of this as a little swatch test.

Another thing I wanted to do was see if the original letter appeared in any of the produced tilings. But I also didn’t want to hand annotate/circle any letters I found, just because I thought that would be boring/time consuming imo.

So instead I found another time consuming way to identify letters, trying to implement OCR(Optical Character Recognition)!

I implemented it in python and it generated the following results.

Some examples:

I think it was sort of interesting to uncover what the computer reads as “text”, but I ultimately didn’t plot any of them bc I didn’t think showing that part of the tile as a different color really added much + I didn’t have a lot of time.

Something interesting to note though…while generating these WFC patterns using the tiles I created, the letter R had the most contradictions I’ve ever seen. It was almost infuriating trying to get a single tiling to finish, because there was (like ~85% of the time) always a contradiction. I’m not too sure why exactly, maybe the diagonal bit of a “R” is prone to contradiction? But I also personally find the R’s the be the most visually appealing.

It looks itchy.


grape – FieldReading

I think the article by Tyler Hobbs was particularly interesting because I hadn’t thought about the amount of variety you could get from noise fields by tweaking very small parts of the same algorithm. All the examples of non continuous distortions?? very delicious.

Jason Webb’s list of resources are also very helpful because there’s just so much to look at. Not only are there explanations for each of the algorithms but also creative projects?!?!?

oh my god look at this:

0040

I’ve just been in awe at all the work listed there – really opened my eyes to how many tools are out there that I can use.

grape – PatternReading

Something I found particularly interesting about the pattern reading was how they both highlighted something different about how the viewer is meant to experience patterns. In 10 PRINT, it’s that the viewer examines patterns by trying to anticipate what comes next; the excitement isn’t derived from something too predictable or too obscure but rather a balance in the middle (maybe if you didn’t provide a first time viewer a grid, the threshold would be if they couldn’t figure out the algorithm in the first ten seconds).  In Graphic Games, the first half of the reading focused on how our minds begin to read black/white as the primary shape in a pattern in relation to its coverage in a grid block or its “dark-light interchange.” I feel like truchet tiles could also make its way into optical illusions given both of these two ideas. I have no big introspective thoughts from reading this, but it has definitely given me a lot to think about in making a “good”(not boring) pattern.

grape – BlobFamily

I read Blobjects: Beyond the New Fluidity in Design. The reading briefly mentioned how historically there was a move towards organic shapes in car design and that made me recall the amount of attention the cyber truck got. The reading also heavily implied that blobs are inherently friendly and welcoming, which prompted me to think about if it is even possible to make a blob seem harmful or dangerous.

I traced the contours of 2D metaballs (which is based off of this sketch by Dan Shiffman). I altered the code by removing velocity and changing how initial positions were instantiated, since my goal was just to produce svgs not animations.  I generated the position of the metaballs using a variation of the Thomas cluster point process in order to produce clusters that looked more blob-like (in my opinion). However it is conceptually different from this point process because I only use a Poisson Distribution on the parent points and not on the daughter points. The code I used to generate the distribution for the cluster centers can be found here. I trace six layers worth of isolines using this library which uses the marching squares algorithm at varying thresholds. I simultaneously generate bit masks for each of the six isometric layers, rasterize hatch patterns over top of these masks and trace the lines from the masked result. The hatch patterns consist of noise fields of varying stroke weight + circles but when the masked hatch is traced only the outline remains, which give the blobs a texture similar to muscle cells. Additionally I chose the little circle hatch because little circles contained in bigger circles seem very cell-like to me.

grape – Hatching

The first hatching method is just a bunch of smiley faces in a grid. The second is a bunch of circles in a grid. The third is some vertical lines, but I added so random lines offset by an amount ranging from 0 to the width of the square grid. The last one is a set of three bezier curves. I didn’t use any external code apart from the grid set up posted in easement 2. I think the difficulty came with trying to make sure they were all the same amount of dark. The third row was especially hard to tune because the vertical lines just appeared so much lighter than the other rows, in part because the colors still looked separate.

Scan of the print (lol):

import processing.svg.*;

float[] percentList = {0.10, 0.30, 0.50, 0.70, 0.90};
int nSquares = percentList.length;

void setup() {
  size(800, 800);
}

void draw() {
  background(250);
  int now = millis();
  randomSeed(now);
  beginRecord(SVG, "foo_" + now + ".svg");
  noFill();
  int offset = (height/4 - int(width/nSquares))/2;
  grid(offset, 0);
  grid(height/4 + offset, 1);
  grid(height/2 + offset, 2);
  grid(3*height/4 + offset, 3);

  endRecord();
  noLoop();
}

void keyPressed() {
  loop();
}


void grid(int posY, int func) {
  for (int i=0; i<nSquares; i++) {
    float rS = width/nSquares;
    float rL = i*rS;
    float rR = rL + rS;
    float rT = posY;
    float rB = rT + rS;

    float hatchPercent = percentList[i];
    float nLinesToDraw = round(hatchPercent * rS/3.2);
    if(func==0) nLinesToDraw = round(hatchPercent * rS/2.3);
    if(func==1) nLinesToDraw = round(hatchPercent * rS/1.8);
    if(func==2) nLinesToDraw = round(hatchPercent * rS/3);
    float offset = (rS/nLinesToDraw)/2;

    // Vertical line version
    for (int j=0; j<nLinesToDraw; j++) {
      for (int k=0; k<nLinesToDraw; k++) {
        float lx = map(j, 0, nLinesToDraw, rL, rR);
        float ly = map(k, 0, nLinesToDraw, rT, rB);
        switch(func) {
        case 0:
          hatch_1(lx+offset, ly+offset, offset);
          break;
        case 1:
          hatch_2(lx, ly, offset);
          break;
        case 2:
          hatch_3(lx+offset, map(min(k+1, nLinesToDraw), 0, nLinesToDraw, rT, rB)+ random(-0.5,0.5), map(max(k-1, 0), 0, nLinesToDraw, rT, rB)+ random(-0.5,0.5));
          hatch_3(min(max(rL,lx + random(-0.5, 0.5)*offset),rR), map(min(k+1, nLinesToDraw), 0, nLinesToDraw, rT, rB)+ random(-0.5, 0.5), map(max(k-1, 0), 0, nLinesToDraw, rT, rB)+ random(-0.5,0.5));
          break;
        case 3:
          hatch_4(lx, ly, offset);
          break;
        }


        //hatch_1(lx,ly);
      }
    }
  }
}

void hatch_1(float posX, float posY, float rad) {
  float smile_start = random(0, QUARTER_PI);
  float n = random(0.3,1) * 3*PI/4;
  float radX = random(0.5,1)*rad*2;
  float radY = random(0.5,1)*rad*2;
  arc(posX, posY, radX, radY, smile_start, smile_start +QUARTER_PI+n);
  circle(posX + random(-0.25,0)*rad,posY+ random(-0.2,0.2)*rad,1);
  circle(posX + random(0,0.25)*rad,posY+ random(-0.2,0.2)*rad,1);
}

void hatch_2(float posX, float posY,float offset) {
  circle(posX+offset, posY+offset, offset);
}

void hatch_3(float posX, float inc1, float inc2) {
  line(posX, inc2, posX, inc1);
}

void hatch_4(float posX, float posY, float offset) {
  bezier(posX,posY,posX+2*offset - random(1)*2*offset, posY+2*offset,posX+random(1)*2*offset,posY,posX+2*offset, posY+2*offset);
  bezier(posX+offset,posY,posX+2*offset - random(1)*offset, posY+offset,posX+random(1)*offset,posY,posX+2*offset, posY+offset);
  bezier(posX,posY+offset,posX+offset - random(1)*offset, posY+2*offset,posX+random(1)*offset,posY,posX+offset, posY+2*offset);
}

grape – Drawingbots

After scrolling on the resource list on the drawingbots website I saw a lot of pattern generators like Kolam artworks, medieval city generators (lol, though not really), and contour maps.

One thing I found particularly funny was this city generator that’s supposed to look hand-drawn. It’s strange how something that looks like it could’ve been some first year architecture student’s homework was generated in a matter of seconds, but that’s also the nature of generative artwork I guess.

grape – LineExercises

A.

/* Basically I used the example code from the lerp() page on Processing
 * but changed it so it would produce dotted lines for any random
 * pair of vectors
 * */
float dashed_length = 20;

void setup(){
  size(400, 400);
  background(100);
}

void draw(){
  background(255);
  int x1 = int(random(0,width));
  int x2 = int(random(0,width));
  int y1 = int(random(0,height));
  int y2 = int(random(0,height));
  
  float ydif = y2-y1;
  float xdif = x2-x1;
  float num_lines = sqrt(pow(ydif,2) + pow(xdif,2))/dashed_length;
  print(num_lines);
  
  for (int i = 0; i <= int(num_lines); i+=2) {
    float dx1 = lerp(x1, x2, i/num_lines) + num_lines;
    float dx2 = lerp(x1, x2, (i+1)/num_lines) + num_lines;
    float dy1 = lerp(y1, y2, i/num_lines);
    float dy2 = lerp(y1, y2, (i+1)/num_lines);
    line(dx1, dy1, dx2, dy2);
  }
  noLoop();
}

B.

C.

/**
 * I basically altered the brownian motion tutorial from Processing
 * to record mouseX, mouseY instead of random movement.
 */
 
int num = 100;
int range = 6;

float[] ax = new float[num];
float[] ay = new float[num]; 
float[] dx = new float[num];
float[] dy = new float[num];
// float[][] a = new float[num][2]; // LIVING LINE 2D ARRAY
// PVector[] a = new PVector[num]; // LIVING LINE PVECTORS
void setup() 
{
  size(640, 360);
  for(int i = 0; i < num; i++) {
    ax[i] = width/2;
    ay[i] = height/2;
    dx[i] = 0;
    dy[i] = 0;
  }
  /* LIVING LINE PVECTORS
  for(int i = 0; i < num; i++) {
    a[i] = new PVector();
    a[i].x = width/2;
    a[i].y = height/2;
  }
  */
  /* LIVING LINE 2D ARRAY
  for(int i = 0; i < num; i++){
    for(int j = 0; j < 2; j++){
      a[i][j] = width/2;
    }
  }
  */
  frameRate(30);
}

void draw() 
{
  background(255);
  
  // Shift all elements 1 place to the left
  for(int i = 1; i < num; i++) {
    dx[i-1] = dx[i];
    dy[i-1] = dy[i];
    ax[i-1] = ax[i];// + random(-range, range); SPICY LINE COMMENT
    ay[i-1] = ay[i];// + random(-range, range); SPICY LINE COMMENT
  }
  /* LIVING LINE PVECTORS
  for(int i = 1; i < num; i++) {
    a[i-1].x = a[i].x;
    a[i-1].y = a[i].y;
  }
  */
  /* // LIVING LINE 2D ARRAY
  for(int i = 1; i < num; i++){
    a[i-1][0] = a[i][0]; 
    a[i-1][1] = a[i][1];
  }
  */
  // Put a new value at the end of the array
  ax[num-1] = mouseX;
  ay[num-1] = mouseY;
  dx[num-1] = (ax[num-1] - ax[num-2]);
  dy[num-1] = (ay[num-1] - ay[num-2]);
  // a[num-1][0] = mouseX; // LIVING LINE 2D ARRAY
  // a[num-1][1] = mouseY; // LIVING LINE 2D ARRAY
  // a[num-1].x = mouseX; // LIVING LINE PVECTORS
  // a[num-1].y = mouseY; // LIVING LINE PVECTORS
  // Constrain all points to the screen
  //ax[num-1] = constrain(ax[num-1], 0, width);
  //ay[num-1] = constrain(ay[num-1], 0, height);
  
  // Draw a line connecting the points
  for(int i=1; i<num; i++) {    
    line(ax[i-1], ay[i-1], ax[i], ay[i]);
    // line(a[i-1].x, a[i-1].y, a[i].x, a[i].y); // LIVING LINE PVECTORS
    // line(a[i-1][0],a[i-1][1],a[i][0],a[i][1]); // LIVING LINE 2D ARRAY
  }
}

D.

E.

float r = 40;


void setup(){
  size(400, 400);
  background(100);
}

void draw(){
  background(255);
  translate(width/2, height/2);
  //trig_circle();
  trig_spiral();
  noLoop();
}

void trig_spiral(){
  beginShape();
  for(float i = 1; i < 40; i+=0.05){
    vertex(cos(i)*(r), sin(i)*(r));
    r+=0.2;
  }
  endShape();
}

void trig_circle(){
  beginShape();
  for(float i = 1; i < 360; i+=1){
    vertex(cos(i)*(r), sin(i)*(r));
  }
  endShape();
}

F. I got tired of math so I made a shitty offset curve – not parallel, just the normal vector of the slope

int num = 100;
int range = 6;

float[] ax = new float[num];
float[] ay = new float[num]; 
float[] dx = new float[num];
float[] dy = new float[num];
float[] ox = new float[num];
float[] oy = new float[num]; 
void setup() 
{
  size(640, 360);
  for(int i = 0; i < num; i++) {
    ax[i] = width/2;
    ay[i] = height/2;
    dx[i] = 0;
    dy[i] = 0;
    ox[i] = width/2;
    oy[i] = height/2;
  }
  frameRate(30);
}

void draw() 
{
  background(255);
  
  // Shift all elements 1 place to the left
  for(int i = 1; i < num; i++) {
    dx[i-1] = dx[i];
    dy[i-1] = dy[i];
    ax[i-1] = ax[i];
    ay[i-1] = ay[i];
    ox[i-1] = ox[i];
    oy[i-1] = oy[i];
  }
  // Put a new value at the end of the array
  ax[num-1] = mouseX;
  ay[num-1] = mouseY;
  dx[num-1] = (ax[num-1] - ax[num-2]);
  dy[num-1] = (ay[num-1] - ay[num-2]);
  //dksjfldkjslkdfjlsdj i hate this
  //ox[num-1] = 25/(1+pow((ay[num-1] + dx[num-1])/(ax[num-1] - dy[num-1]),2));
  //oy[num-1] = sqrt(25 - pow(ox[num-1],2));
  ox[num-1] = ax[num-1] - dy[num-1];
  oy[num-1] = ay[num-1] + dx[num-1];
  
  // Draw a line connecting the points
  for(int i=1; i<num; i++) {    
    //float val = float(i)/num * 204.0 + 51;
    //stroke(val);
    line(ax[i-1], ay[i-1], ax[i], ay[i]);
    //float dx = 25/(1+pow(ay[num-1] + dx[num-1]/ax[num-1] - dy[num-1]),2));
    //float dy = sqrt(25 - pow(dx,2));
    line(ox[i-1], oy[i-1], ox[i], oy[i]);
  }
}

G.

i was watching a lot of gordon ramsey

H.

“bears beets battlestar galactica”

import processing.svg.*;
int num = 1000;
int range = 6;

boolean record = false;

float[] ax = new float[num];
float[] ay = new float[num]; 
float[] dx = new float[num];
float[] dy = new float[num];
float[] ox = new float[num];
float[] oy = new float[num]; 

int num_lines = 5;
void setup() 
{
  size(640, 360);
  for(int i = 0; i < num; i++) {
    ax[i] = width/2;
    ay[i] = height/2;
    dx[i] = 0;
    dy[i] = 0;
    ox[i] = width/2;
    oy[i] = height/2;
  }
  frameRate(30);
}

void draw() 
{
  background(255);

  // Shift all elements 1 place to the left
  for(int i = 1; i < num; i++) {
    dx[i-1] = dx[i];
    dy[i-1] = dy[i];
    ax[i-1] = ax[i];
    ay[i-1] = ay[i];
    ox[i-1] = ox[i];
    oy[i-1] = oy[i];
  }
  // Put a new value at the end of the array
  ax[num-1] = mouseX;
  ay[num-1] = mouseY;
  dx[num-1] = (ax[num-1] - ax[num-2]);
  dy[num-1] = (ay[num-1] - ay[num-2]);
  
  // Draw a line connecting the points
  if(record){
    int now = millis();
    randomSeed(now);
    beginRecord(SVG, "foo_" + now + ".svg");
  }
  for(int i=1; i<num; i++) {    
    float mult = map(dx[i] + dy[i], 0, width+height, 1, 60);
    for(int j = 0; j < num_lines; j++){
      line(ax[i-1] - j*mult, ay[i-1], ax[i] - j*mult, ay[i]);
    }

  }
  if(record){
    endRecord();
    record = false;
  }
}

void keyPressed() {
  record = true;
}

BUT, then I added some perpendicular lines instead:

import processing.svg.*;
int num = 1500;
int range = 6;

boolean record = false;

float[] ax = new float[num];
float[] ay = new float[num]; 
float[] dx = new float[num];
float[] dy = new float[num];
float[] ox = new float[num];
float[] oy = new float[num]; 

int num_lines = 15;
void setup() 
{
  size(640, 640);
  for(int i = 0; i < num; i++) {
    ax[i] = width/2;
    ay[i] = height/2;
    dx[i] = 0;
    dy[i] = 0;
    ox[i] = width/2;
    oy[i] = height/2;
  }
  frameRate(30);
}

void draw() 
{
  background(255);

  // Shift all elements 1 place to the left
  for(int i = 1; i < num; i++) {
    dx[i-1] = dx[i];
    dy[i-1] = dy[i];
    ax[i-1] = ax[i];
    ay[i-1] = ay[i];
    ox[i-1] = ox[i];
    oy[i-1] = oy[i];
  }
  // Put a new value at the end of the array
  ax[num-1] = mouseX;
  ay[num-1] = mouseY;
  dx[num-1] = (ax[num-1] - ax[num-2]);
  dy[num-1] = (ay[num-1] - ay[num-2]);

  // Draw a line connecting the points
  if(record){
    int now = millis();
    randomSeed(now);
    beginRecord(SVG, "foo_" + now + ".svg");
  }
  for(int i=1; i<num; i++) {    
    float d_lines = int(map(dx[i] + dy[i],-200, 200, 0,num_lines));
    for(float j = 0; j < d_lines; j++){
      float multx1 = lerp(ax[i], ax[i-1], j/d_lines);
      float multx2 = lerp(ax[i]-dy[i], ax[i-1] - dy[i-1], j/d_lines);
      float multy1 = lerp(ay[i], ay[i-1], j/d_lines);
      float multy2 = lerp(ay[i] + dx[i], ay[i-1] + dx[i-1], j/d_lines);
      line(multx1, multy1, multx2, multy2);
    }
  }
  if(record){
    endRecord();
    record = false;
  }
}

void keyPressed() {
  record = true;
}