lemonbear—Hatching

Hatching studies:

Screenshot:

SVG:

Reflection:

I wasn’t super engrossed by this programming assignment, and I was sort of busy this week so some of these are slightly uninspired. I did think I was being silly/clever with the second row, which is a bunch of people, because Golan described hatching as “approximating gray tones using assemblies of lines“, and I usually think of a bunch of people when I think of the word assembly 🙂

I was told that the third row looked like the effects from super paper mario and the fourth one looked like the patterns on couches from the 80’s, which I thought was really funny. I like these kinds of patterns:

They’re so funny and garish. I could figure out a way to make a fun background for myself in the spirit of these designs. Anyway I’m not really on topic anymore.

Credit: I used this library to export an SVG from p5js.

lemonbear—DrawingBots

I thought this sheet music to polyline renderer by LingDong was super interesting!! I like the way text gets plotted with drawing machines in general—it has more of the feel of “art student bored in class copying typefaces” than strictly a pixel by pixel copy of standard fonts. I wonder how you might be able to play with the parameters for generating these polyline SVGs (e.g., randomizing spacing for elements, chaos/jitter of written notes…) or like feeding in a piece that’s been screwed with by the computer, and then screw it up some more.

It also made me think about the possibility of asemic score writing. I’m still considering the philosophical/fucking-with-meaning dimensions of the concept, but it could be something I pursue later in this course.

lemonbear—LostrittoReading

Like many of my classmates, I was particularly drawn to the claim that “When one marks on paper, for example, one can erase those marks, but that is actually another kind of marking that involves the interaction of material.” Lostritto makes the argument that physical drawings store a visual record of their entire history, as opposed to “drawing” in digital software, where lines and forms might be done and undone discreetly. Though I don’t entirely subscribe to the stark division between human-produced and computer-produced artwork, I like the questions which arise from viewing traditional work as a “drawing” and computed work as a “model”. What’s the difference between a model and its realization? For some media, like pen and paper, the distinction is slim. But for watercolor or acrylic, the analog-space randomness of the physical work manifests the model in novel ways, their physical properties producing inspiring aesthetics.

lemonbear-PlotterSkimming

I really liked Licia He’s article. One thing in particular that stuck out to me was the mentality of repetition and habit building that she acquired by doing her 300+ days of plotter art, and how she connected this mentality to the iteration and discipline inherent in plotter art itself. To get better at making a robot do a lot of precise tasks over and over again, you have to hone your skills by waking up and deciding to make art over and over again, and the parallelism of those acts was not lost on me.

lemonbear-LineWalk

Here is my SVG (there are very bizarre lines in some browsers; feel free to click and open in a new tab):

Here is a screenshot:

Approach: I knew I wanted to do something sort of objective and I settled on flowers! Namely, roses. I thought it would be pretty simple algorithmically to create a spiral with some jitter for the petals, and after a little more finicky work, I was able to implement leaves on the outer layer of each rose. My friend pointed out that with some color and cursive writing this could be an album cover for an extremely mediocre emo band, and I think I agree with that.

Struggles: I had a little bit of a harder time getting into this creative portion of the homework, and actually found that recreating the Molnar was the most engaging out of these offerings for me. Also, there’s this weird bug where the line connecting one flower to the next’s center overshoots the center, and I spent like 45 minutes trying to debug it before giving up. My primary issue with this is that now it looks like there’s more than one line, but I promise it’s all just one.

Learned: I learned Javascript for these offerings! I had been kind of scared to learn p5.js in the past because I had never done JS before, but I learned that it’s basically gentler C (a language I am somewhat familiar with) plus some idiosyncrasies (there are no ints? everything is just floats? what kind of type system…)

Here is my code:

function setup() {
  createCanvas(816, 1056, SVG);
  noLoop();
}

function draw() {
  noFill();
  beginShape();
  var centerX = width/2;
  var centerY = height/2;
  var finalX, finalY;
  const array = [];
  for (var k = 1; k < 4; k++){
    for(var l = 1; l < 3; l++){
      var jitter1 = Math.floor(Math.random()*101)-50;
      var jitter2 = Math.floor(Math.random()*101)-50;
      array.push([width*l/3+jitter1, height*k/4+jitter2]);
    }
  }
  for (var j = 0; j < 6; j++){
    centerX = array[j][0];
    centerY = array[j][1];
    for (var i = 0; i < TWO_PI*10; i+=HALF_PI/6) {
      var jitter3 = Math.floor(Math.random()*i/2)-i/4;
      var jitter4 = Math.floor(Math.random()*i/2)-i/4;
      if ((jitter3 < 0 && jitter4 > 0) || (jitter3 > 0 && jitter4 < 0)) { jitter3 *= -1; } var x = centerX+cos(i)*(i*2+jitter3); var y = centerY+sin(i)*(i*2+jitter4); curveVertex(x, y); var leafTipX, leafTipY; if (i >= TWO_PI*9 && Math.random()<0.5){
        curveVertex(x, y);
        endShape();
        beginShape();
        curveVertex(x, y);
        curveVertex(x, y);
        leafTipX = (x-centerX)*0.4 + x;
        leafTipY = (y-centerY)*0.4 + y;
        var slope = (y-leafTipY)/(x-leafTipX);
        slope = -1/slope;
        var midX = (x+leafTipX)/2;
        var midY = (y+leafTipY)/2;
        var leftX = midX+10;
        var leftY = midY+10*slope;
        var rightX = midX-10;
        var rightY = midY-10*slope;
        curveVertex(leftX, leftY);
        curveVertex(leafTipX, leafTipY);
        curveVertex(rightX, rightY);
        curveVertex(x, y);
        curveVertex(x, y);
        endShape();
        beginShape();
        curveVertex(x, y);
        curveVertex(x, y);
      }
      finalX = x;
      finalY = y;
    }
  }
  curveVertex(finalX, finalY);
  endShape();
  // saveSVG("line_walk_v1.svg")
}

lemonbear-MolnarRecode

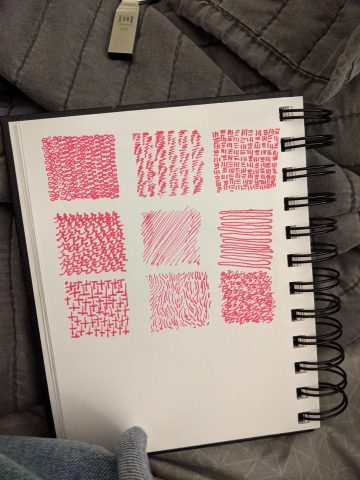
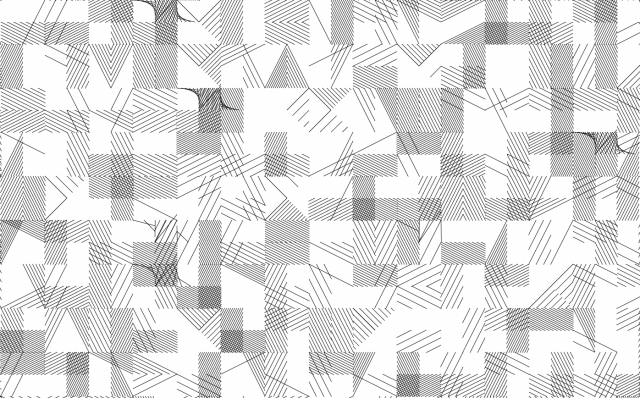
Molnar “Searching for Paul Klee” Observations:

  1. The piece is a grid of many squares
  2. The squares have different things happening inside of them
  3. Sometimes there are sub-rectangles, sub-squares, or sub-triangles within these squares, but never any other subdivisions
  4. There are only diagonal lines drawn with differing densities
  5. These diagonal lines are oriented in different directions
  6. There are also implied curves due to the fact that some of these diagonal lines will vary angles within a subspace
  7. Nearly all of the time there are 2 sub rectangles at differing orientations within a cell
  8. However, there are also (not… infrequently) triangles composing half a rectangle (these also often come in pairs).
  9. There are sometimes other triangles, like those which occupy half a square and those which are a fourth of the square, but in a different orientation
  10. Often, these half-rectangle triangles meet in the middle. I didn’t code this super well

I made the actual SVG way too big (~20 MB) to upload to WordPress, so here is the link to download it from Drive.

Here is an (almost) full pixel screenshot:

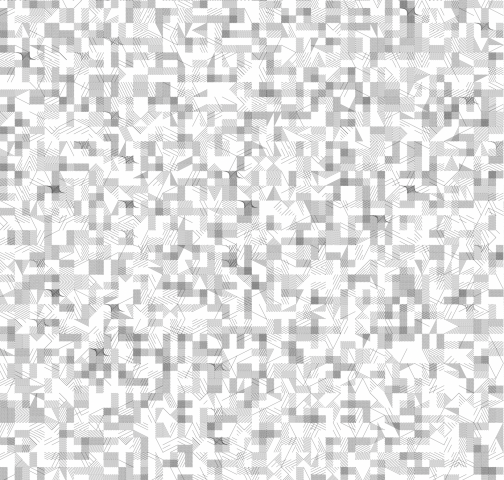
Here is a close up pixel screenshot:

I actually probably spent more time on this than my line walk (oops). I found it to be a really engaging exercise! I only wrote about 6 observations before getting bored and starting the code, and during the programming process I made way more minute observations than I did while just looking at it (my ten listed observations don’t encapsulate the full extent of everything I observed and implemented). Here is my code:

// Uses https://github.com/zenozeng/p5.js-svg to export SVG.
// noprotect
function setup() {
  createCanvas(816*4, 1056*4, SVG); 
  noLoop(); 
}

function makeSubsection(x1, y1, pixelDim, rot, type) {
  var x2 = 0;
  var y2 = 0;
  if (rot == 0) {
    //top
    x2 = x1 + pixelDim;
    y2 = y1 + pixelDim/2;
  }
  else if (rot == 1) {
    //bottom
    x2 = x1 + pixelDim;
    y1 += pixelDim/2;
    y2 = y1 + pixelDim/2;

  }
  else if (rot == 2) {
    //left
    x2 = x1 + pixelDim/2;
    y2 = y1 + pixelDim;
  }
  else if (rot == 3) {
    //right
    x1 += pixelDim/2;
    x2 = x1 + pixelDim/2;
    y2 = y1 + pixelDim;
  }
  var density = Math.floor(Math.pow(Math.random(), 1) * 12);
  var xMargin = (x2-x1+1)/density;
  var yMargin = (y2-y1+1)/density;
  if (type < .75) { //half rectangle
    var direction = Math.floor(Math.random()*2);
    // console.log(rot);
    // console.log(x1, y1, x2, y2);
    if (direction == 0) {
      for (var i = x1; i < x2; i+=xMargin) {
        for (var j = y1; j < y2; j+=yMargin) { line(i, j, i+xMargin, j+yMargin); } } } else { for (var i = x2; i > x1; i-=xMargin) {
        for (var j = y1; j < y2; j+=yMargin) {
          line(i, j, i-xMargin, j+yMargin);
        }
      }
    }
    if (rot == 3 && Math.random() < 0.1) {
      x1 -= pixelDim/2;
      y2 -= pixelDim/2;
      xMargin = (x2-x1+1)/density;
      yMargin = (y2-y1+1)/density;
      for (var n = 0; n < density; n++) {
        line(x1+n*xMargin, y1, x2-pixelDim/2, y1+(n+1)*yMargin)
      }
      x1 += pixelDim/2;
      x2 += pixelDim/2;
      for (var n = 0; n < density; n++) {
        line(x1+n*xMargin, y2, x2-pixelDim/2, y1+(n-1)*yMargin)
      }
    }
  }
  else if (type < .9) { //half triangle in half rectangle 
    var direction = Math.floor(Math.random()*4);
    if (direction == 0) {
      for (var n = 0; n < density; n++) {
        //upper-right
        line(x1+n*xMargin, y1, x2, y2-n*yMargin);
      }
    }
    else if (direction == 1) {
      for (var n = 0; n < density; n++) {
        //lower-right
        line(x1+n*xMargin, y2, x2, y1+n*yMargin);
      }
    }
    else if (direction == 2) {
      for (var n = 0; n < density; n++) {
        //lower-left
        line(x1, y1+n*yMargin, x2-n*xMargin, y2);
      }
    }
    else if (direction == 3) {
      for (var n = 0; n < density; n++) {
        //upper-left
        line(x2-n*xMargin, y1, x1, y2-n*yMargin);
      }
    }
  }
  else if (type < 1) {
    if (rot == 0) {
      for (var n = 0; n < density; n++) {
        //top
        line(x1+n*xMargin, y1, x2-pixelDim/2+n*xMargin/2, y2-n*yMargin);
      }
    }
    else if (rot == 1) {
      for (var n = 0; n < density; n++) {
        //bottom
        line(x1+n*xMargin, y2, x2-pixelDim/2+n*xMargin/2, y1+n*yMargin);
      }
    }
    else if (rot == 2) {
      for (var n = 0; n < density; n++) {
        //left
        line(x1, y1+n*yMargin, x2-n*xMargin, y2-pixelDim/2+n*yMargin/2);
      }
    }
    else if (rot == 3) {
      for (var n = 0; n < density; n++) {
        //right
        line(x2, y1+n*yMargin, x1+n*xMargin, y2-pixelDim/2+n*yMargin/2);
      }
    }  
  }
}

function draw() {

  var squaresWide = 8.5*4;
  var squaresHigh = 11*4;
  
  var pixelDim = width/squaresWide;

  for (var x = 0; x < squaresHigh; x++) {
    for (var y = 0; y < squaresWide; y++) {
      var rot1 = Math.floor(Math.random() * 4);
      var rot2 = (rot1 + Math.floor(Math.random() * 3) + 1)%4;
      console.log(rot1, rot2);
      var type = (Math.random());
      makeSubsection(x*pixelDim, y*pixelDim, pixelDim, rot1, type);
      makeSubsection(x*pixelDim, y*pixelDim, pixelDim, rot2, type);
      
    }
  } 
  // saveSVG("molnar_redraw_v3.svg");
}

lemonbear-PlotterTwitter

Going on Plotter Twitter was super interesting! There’s like a very unique sense of rhythm/repetition/texture inherent to the machine/medium that I hadn’t seen before in any other kind of artwork. I liked the ways people played with illusion, like overlapping primary colors to suggest other colors, and creating drawings with so many straight lines that there were implied curved forms (or so many ordered circles that there were implied straight forms). I think in a way most computing is really about illusion—the pixel matrix is not a continuous space, and floating point numbers render all decimals to the nearest approximation they can hold. It’s all about encoding information in the best way we can. Plotting these computed artworks felt really fun to me because these people were taking discrete, encoded approximations and shoving them back into a space with uncountably infinite possibilities (i.e. the blank page).

((Although, I would also have liked to see more attempts at generative objective artwork, like Lingdong’s fish. ))

This was one of my favorites from the tag. I just really enjoyed the interplay between the meticulously programmed artwork and the messiness of the watercolor. I loved the gradients that arose when different colors met and were still wet, and I liked the scratchiness of the white lines formed by the negative space between blocks.