This set of three Offerings will be discussed on Wednesday, September 8th at the beginning of class.
2A. Looking Outwards: #PlotterTwitter
(30 minutes) The purpose of this prompt is to enhance your familiarity with global practices and an international community of creative people using code to control plotters.
Over the past few years, a vibrant community of artists, hobbyists, and enthusiasts have begun to publish computationally-generated plotter drawings on Twitter, using the hashtag #PlotterTwitter. (These creators have simultaneously been empowered by, and also helped spur the success of, AxiDraw plotters.) Please spend at least 20 minutes browsing the posts in this stream to get a sense of how various people are combining computation and plotter devices. Now,
- Create a blog post on our course website. Title your blog post Nickname-PlotterTwitter, and Categorize it 02-PlotterTwitter.
- Write a few sentences summarizing the kinds of work you saw on #PlotterTwitter. What was interesting to you? What was disappointing?
- Identify a single (specific) project you liked from the #PlotterTwitter stream. In your blog post, embed its tweet (and/or embed an image from a tweet, along with a link to the original tweet).
- In another sentence or two, write what you appreciated about this particular project. Be sure to provide the creator’s real name and/or Twitter username.
2B. Vera Molnár Re-Code
(1-2 hours) Copying a masterwork is an established method by which artists learn their practice. The purposes of this prompt are to strengthen your familiarity with a creative coding toolkit (such as p5.js or Processing); to ensure that you are able to generate SVG images (which is an essential skill for nearly all of our work this semester); to exercise your powers of observation and analysis; and to deepen your appreciation for computer art made more than a half-century ago.
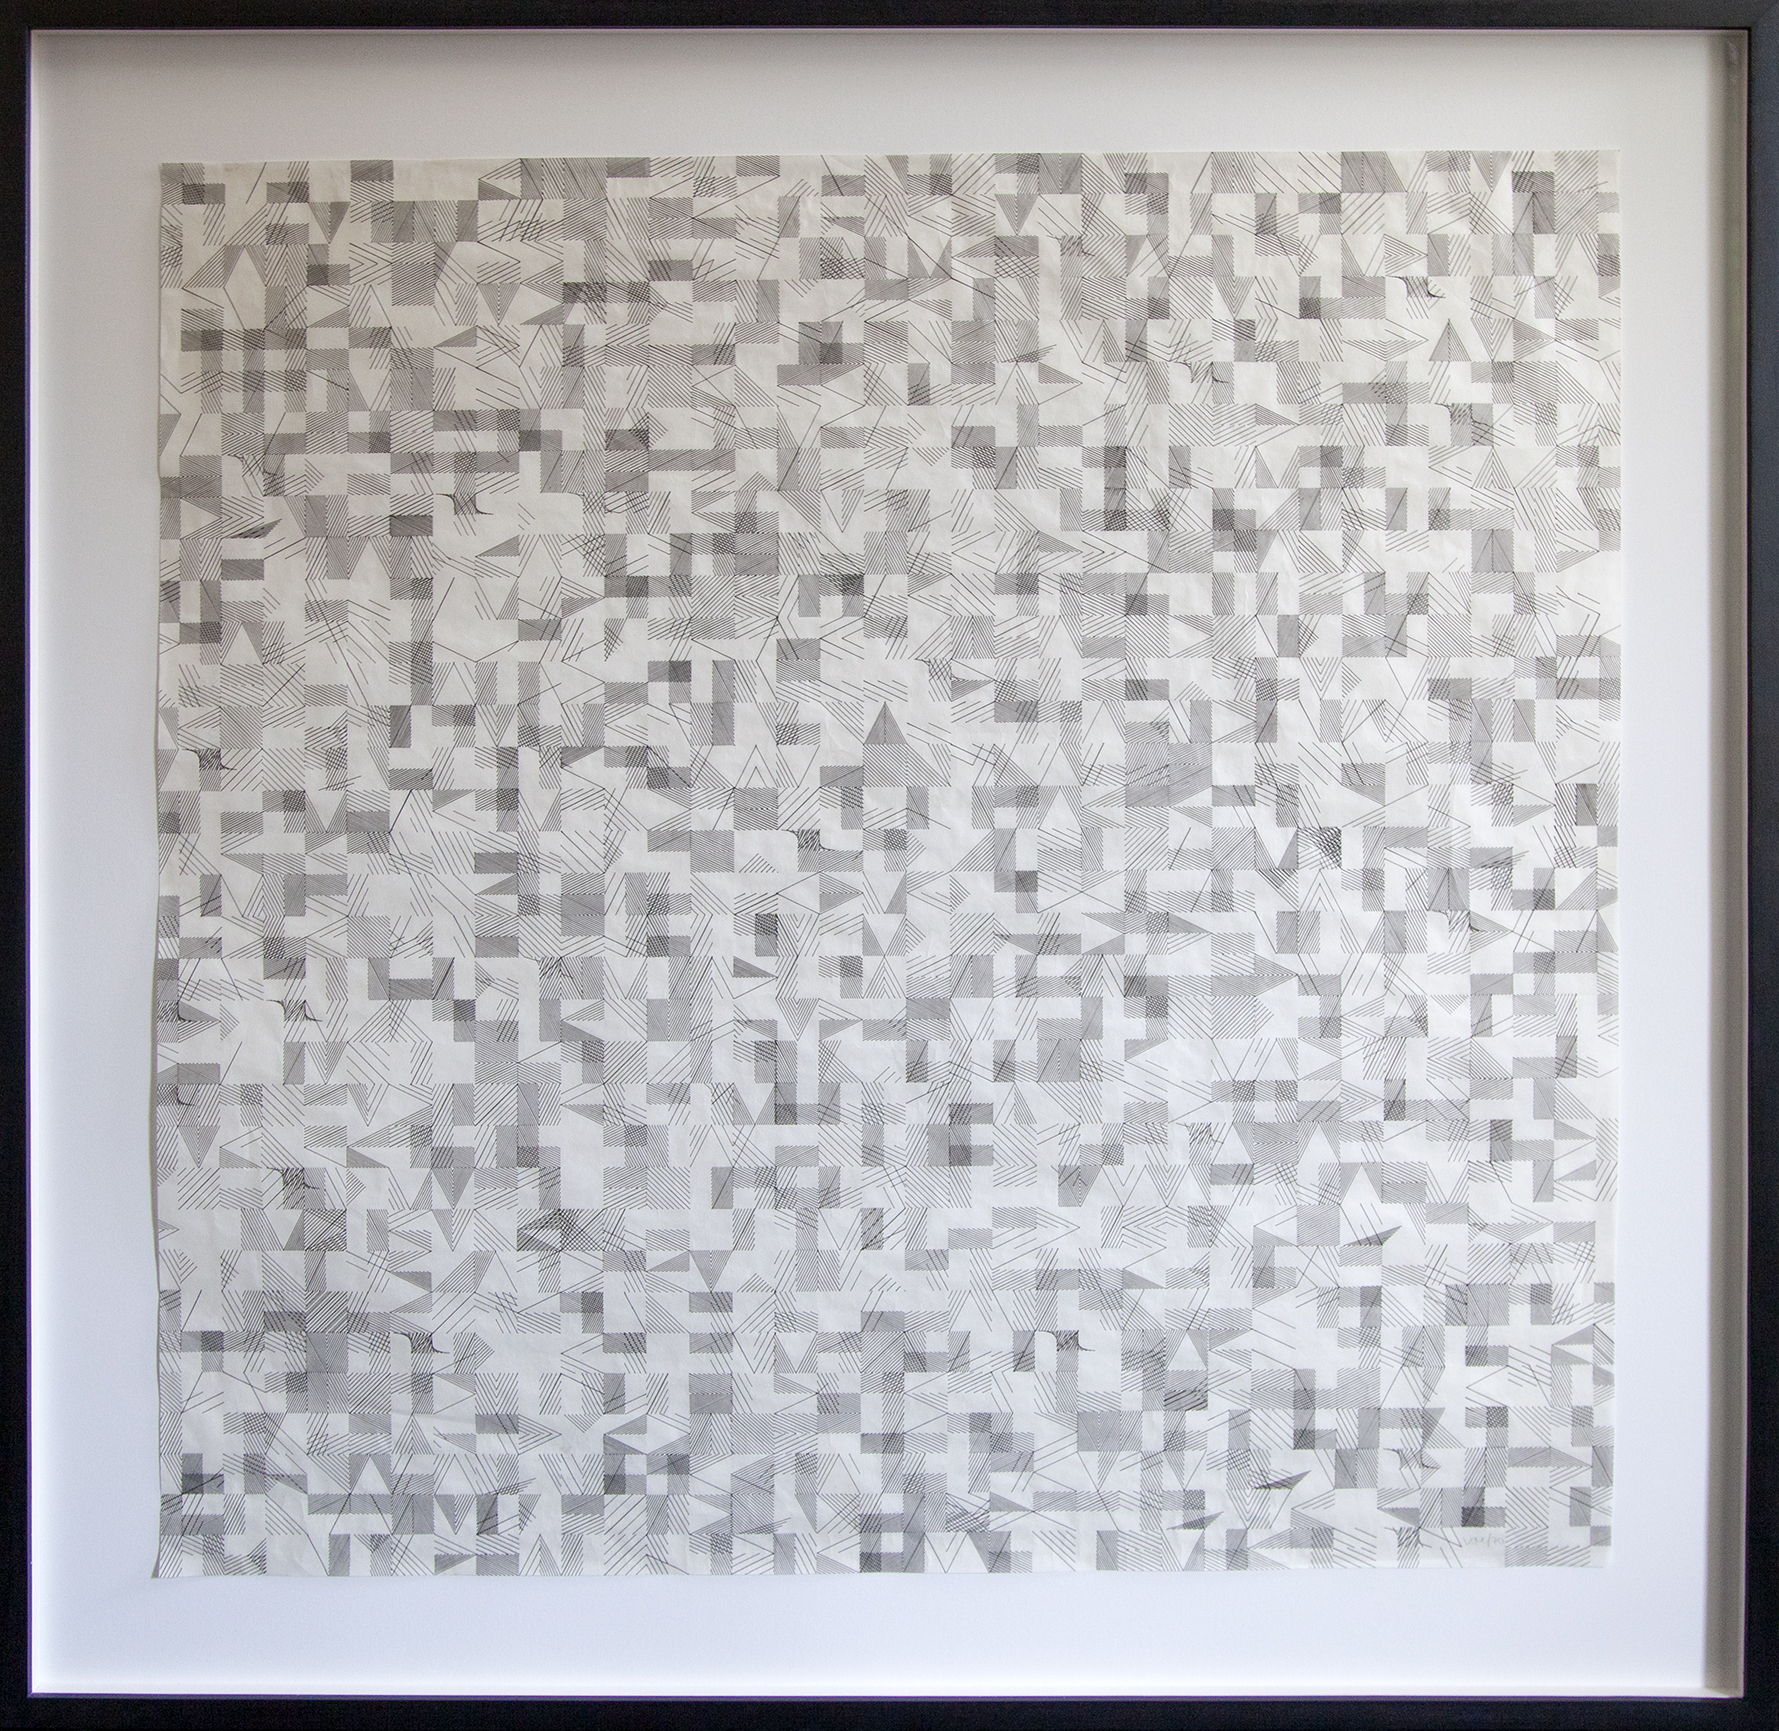
Skim this article about computer arts pioneer, Vera Molnár. In 1970, she created a computationally generated plotter print, A la Recherche de Paul Klee (“Searching for Paul Klee”), which is now in the The Anne and Michael Spalter Digital Art Collection. Here is the artwork:
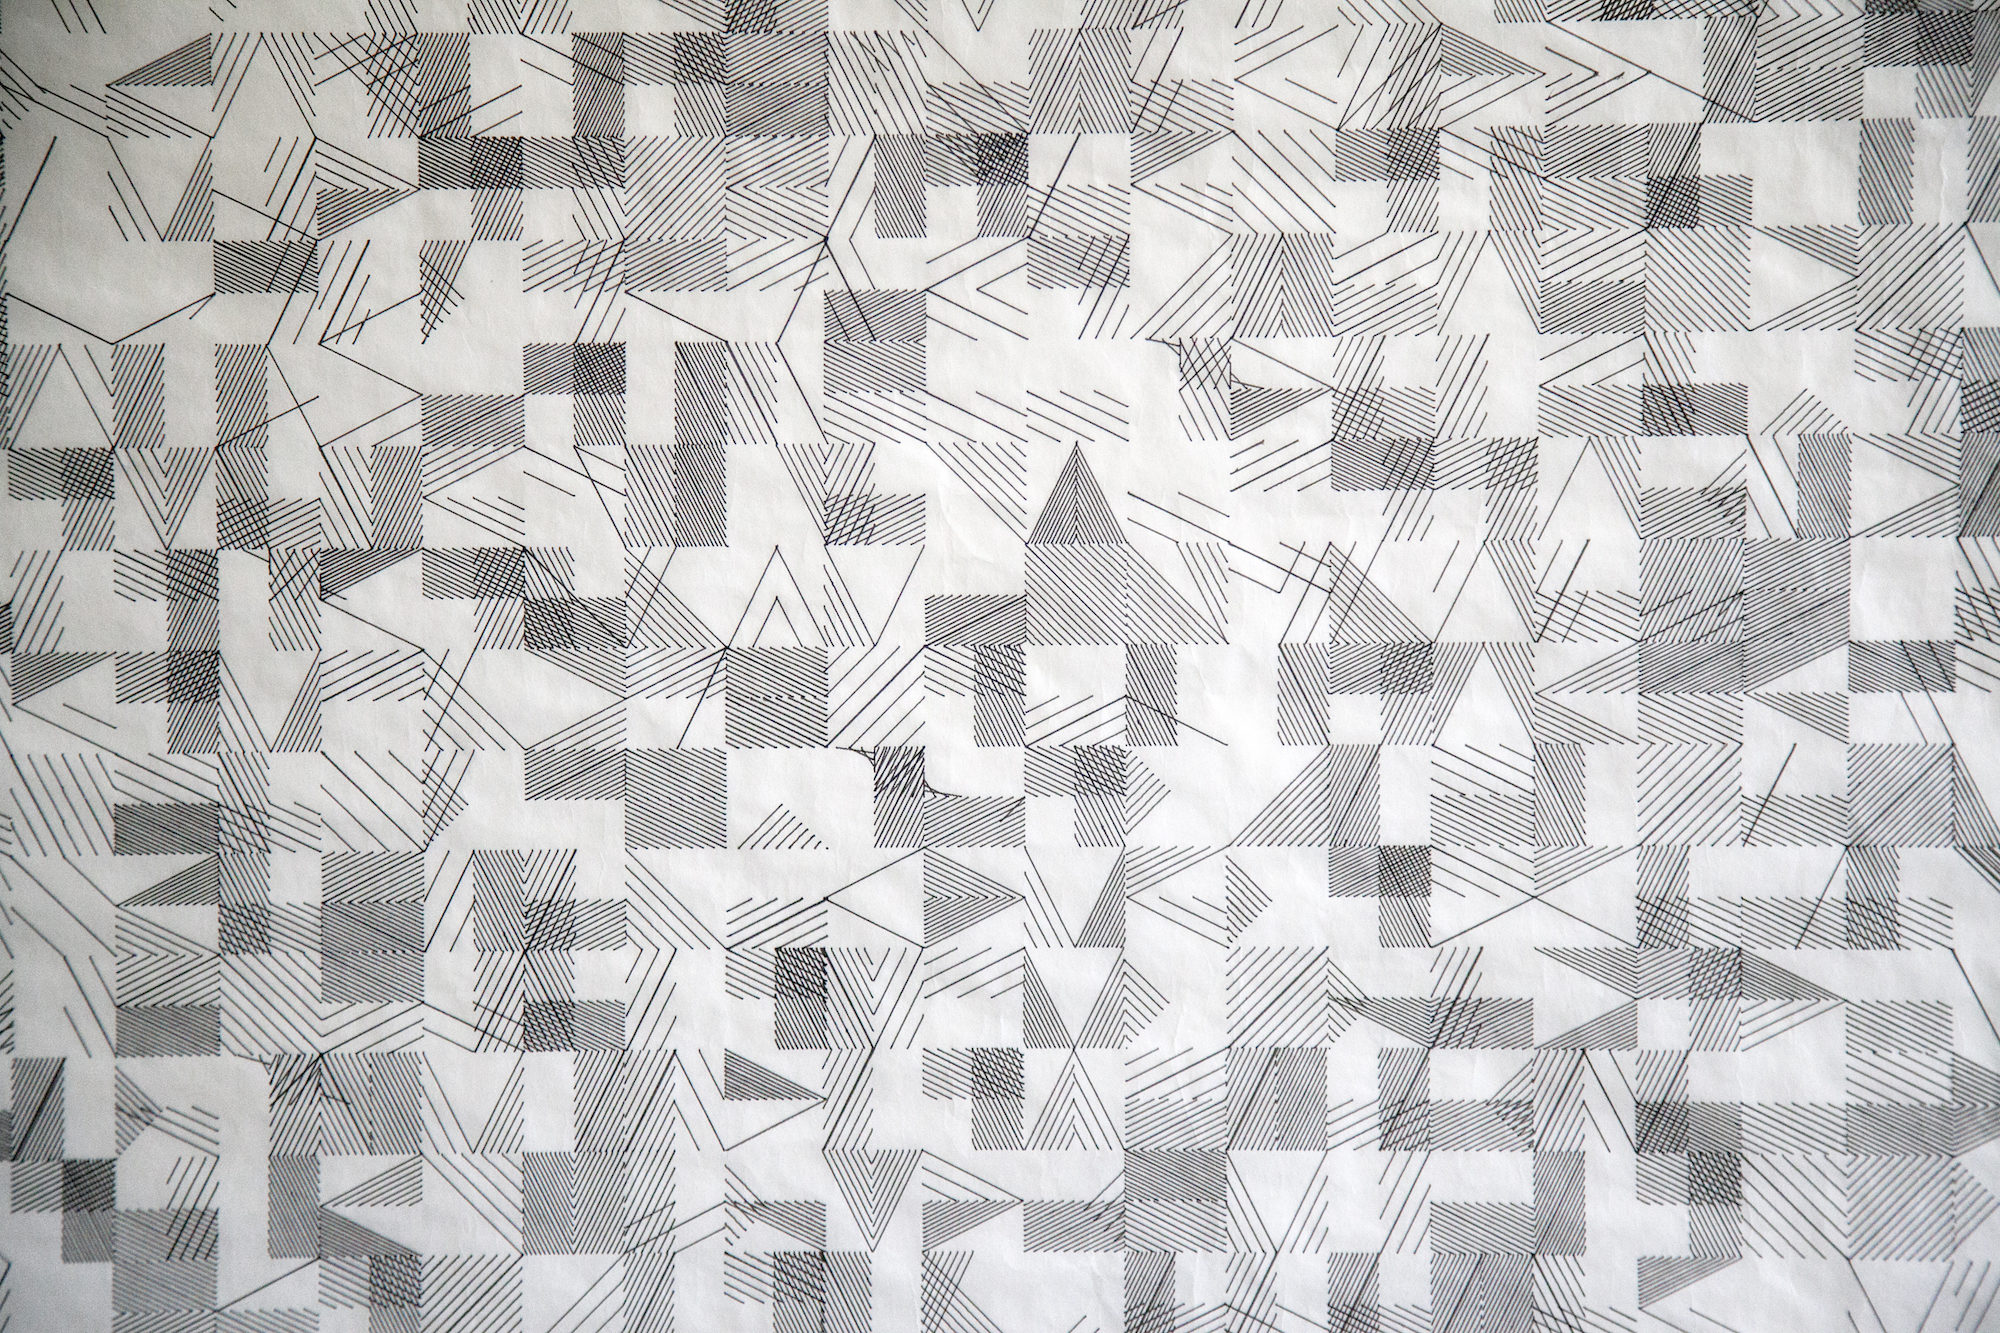
And here is a detail (click to magnify):
Now:
- Spend some time carefully examining Molnar’s artwork.
- From your observations, write down at least ten factual assertions that you can make about the work. Here are some example observations:
- The artwork consists of an axis-aligned grid of square and rectangular cells
- Some cells are empty, and some have diagonal lines
- The diagonal lines are black
- The diagonal lines within a cell are parallel
- The diagonal lines within a cell are equally spaced
- Etcetera…
- Using Java, JavaScript, or Python code, re-create this work (or more precisely: Create a generative system that produces images similar to Molnár’s, with what you believe are the same design logics). You will find it helpful to use a toolkit such as Processing, p5.js, vpype/vsketch, Drawbot, etc. Your program must generate SVG images; more information on generating SVGs is available here.
- Create a blog post on this site. Title it Nickname-MolnarRecode and Categorize it, 02-MolnarRecode.
- In your blog post, include your 10 observations about the original artwork.
- In your blog post, embed your SVG file.
- In your blog post, embed a (pixel) screenshot of your work as well.
- In your blog post, write a few sentences evaluating your work and discussing your experience.
- In your blog post, embed your code. Use the HTML pre tag to ensure good formatting.
2C. Taking A Line for A Walk.
(2-5 hours) In this prompt, I’m knowingly throwing you out into the deep end of the pool. Your responses to this prompt will help me better understand your creative and technical skills. The learning objectives of this prompt are to exercise your conceptual, aesthetic, and computational skills in governing a ‘basic’ graphical form (a single line).
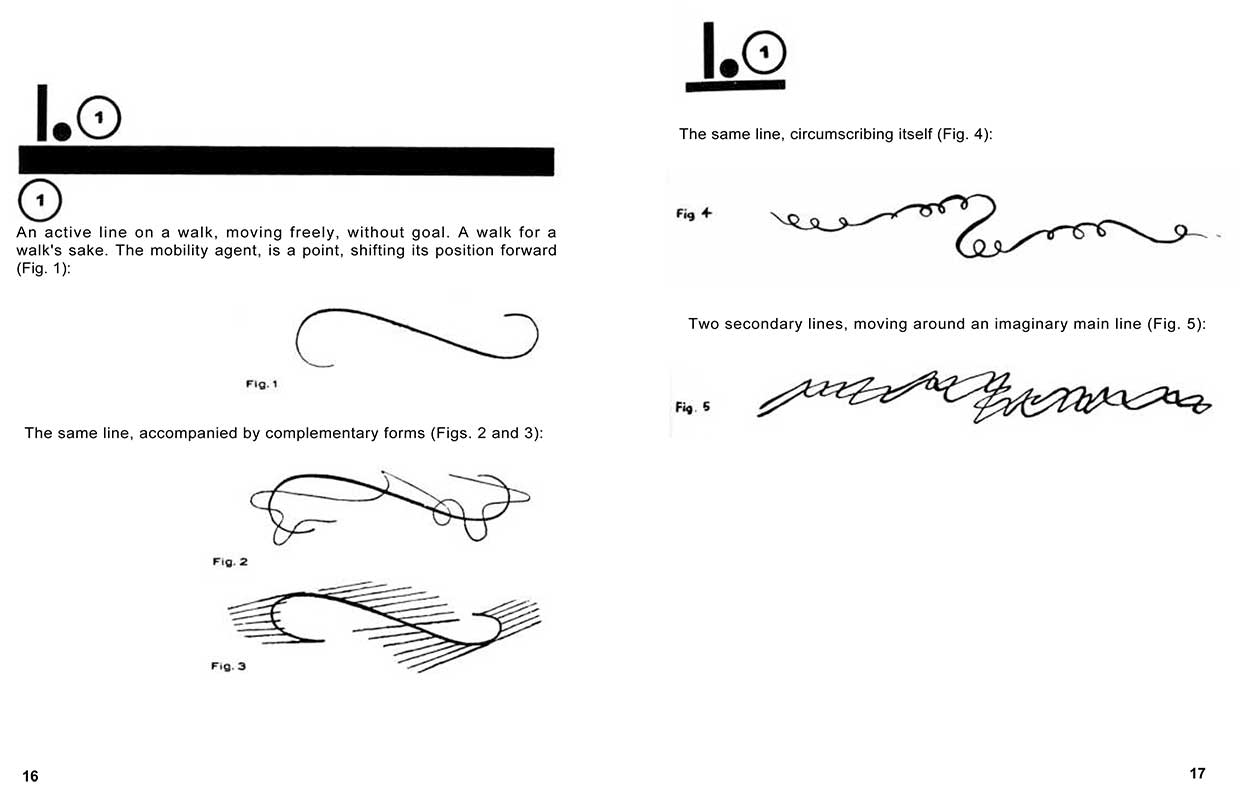
You will recall Paul Klee’s Pedagogical Sketchbook (PDF; 1925), in which he proposed that “a line is a dot that went for a walk”.
Klee’s statement has been very influential, and has become a common prompt for students, such as this assignment for grade-schoolers:
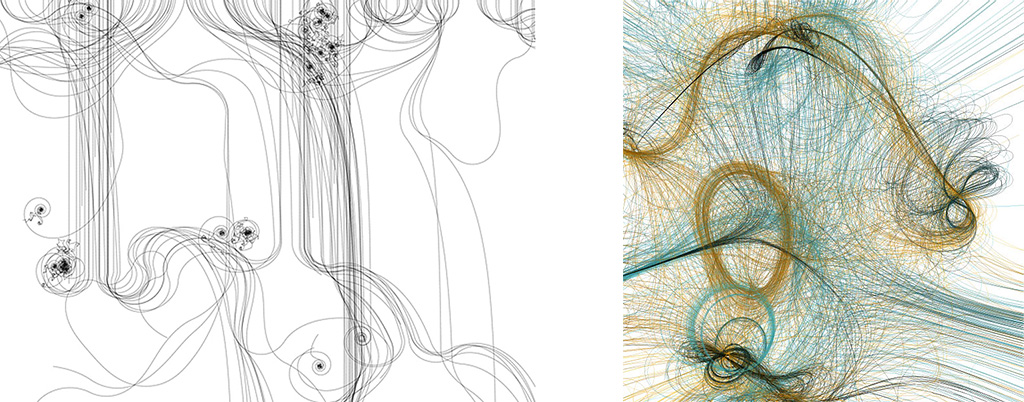
The artwork Sum05 by Austrian software artist (2005), Lia (at left) and the artwork Path_P by Casey Reas (2001), are examples of this.
Here, you are invited to make an Offering in which you take a line for a walk. Please write code that takes a line on a walk, and exports an SVG image.
We will plot these SVGs using 0.7mm black pens on letter-sized white paper on Wednesday September 8. There is no color in this project.
Now:
- Write code to take a line on an interesting walk. Your code may be written in any programming language you prefer (e.g. Java, JS, Python, etc.) and should export an SVG that consists of exactly one line. This line could be zig-zag, wavy, curly, wiggly, noisy, etcetera. (Unlike the video above, you may choose to start and end your line at the same point, or start and end your line at opposite corners of the page. Unlike the video above, you may also choose to allow your line to cross itself, or not.)
- Create a blog post on this site. Title it Nickname-LineWalk, and Categorize it, 02-LineWalk.
- In your blog post, export an SVG and embed your SVG into your blog post.
- In your blog post, embed a screenshot of your project.
- In your blog post, write a few sentences that describe your approach, what you struggled with, and what you learned.
- In your blog post, embed your code. Use the HTML pre tag to ensure good formatting.
It should be clear that there is no correct answer to this prompt. There are an infinity of possible approaches to generate an interesting line, and there is absolutely no preferred or recommended method. The Coding Train offers some possible starting points, which I neither endorse nor reject: