An AI rode along with the Pittsburgh Police for 13 hours. What might we learn?

Trigger warnings! Violence. Karens. Dead people. Hurt dogs. Racism.

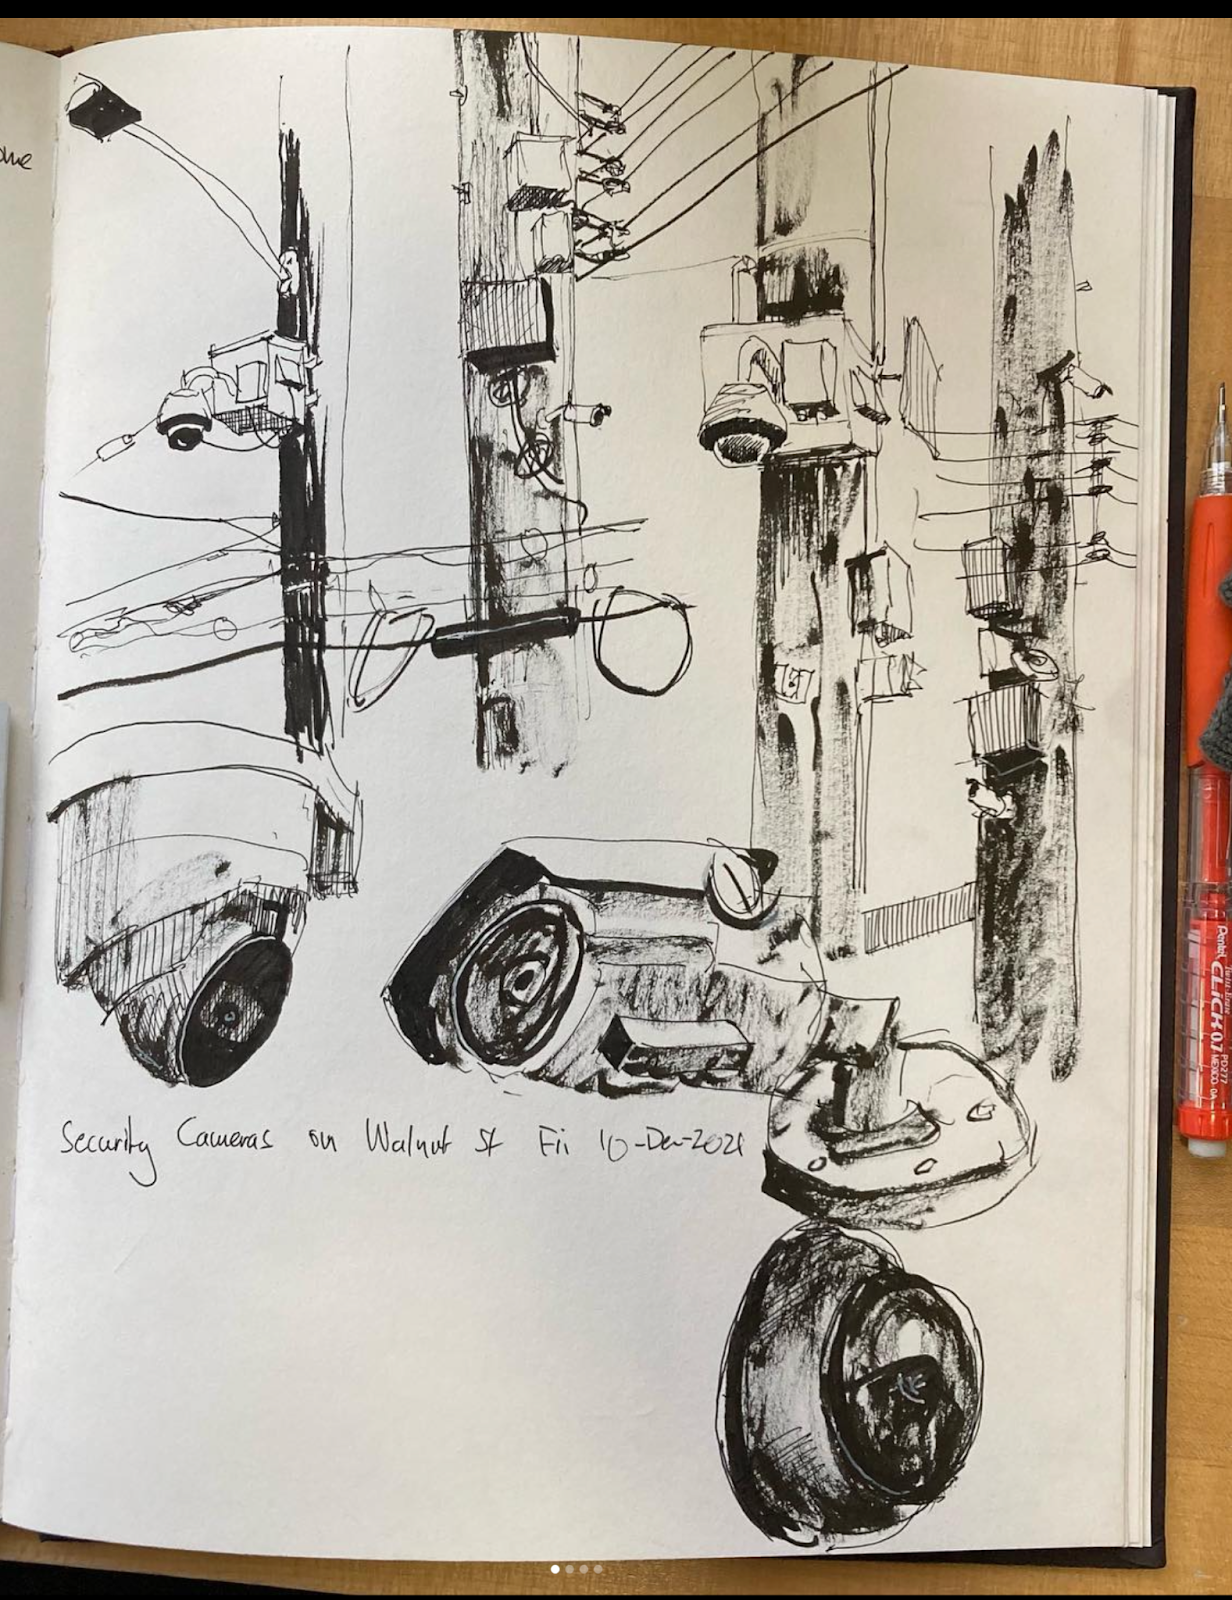
During street protests in 2020, the police behaved especially erratically: their motorcycle gangs lurked out of sight, then would pounce without warning. They would snatch protestors into unmarked white vans. They would demand we move out of the roadway and into Mellon park, and then claim the park was closed, and pepper spray us and arrest us for trespass.

I began to listen to police radio while at the protests, to predict the police so as to protect the most precarious among us. For example, my international student friends couldn’t afford to be arrested, for fear of them being deported. So we’d hopefully have a heads up with a pounce was imminent.  I also heard them make fun of our protest and its cause: Black lives.

***

Image

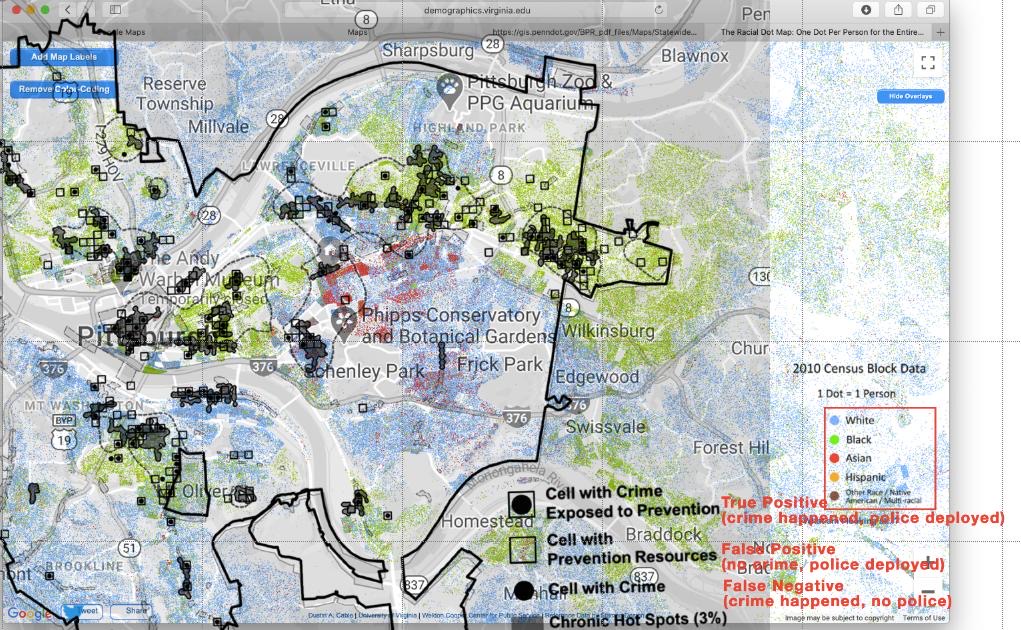
Carnegie Mellon partnered with the Pittsburgh Police to develop and deploy predictive policing software, using racist historical “crime” statistics to predict future crime. This was used to send police into “hotspot” disproportionately Black neighborhoods. After outcry, CMU claimed that the algorithm did not consider race as a factor, not fooling our history students who will tell you that racist laws lead to residential segregation, and our machine learning students who will tell you that therefore, under the blind eyes of machine learning, location is race .

***

So I built a system to record police scanner audio, used machine learning to transcribe it, and built a system to allow you to automatically search keywords and extract associated audio clips. I then fought with OpenAI’s Whisper to transcribe this – this is where most of my time was spent.

***

November 20th, 2022 was a cold day. At 8:25AM, it was about 20F, and fairly windy. I pressed the button to begin recording – and left it alone for  13 hours and 24 minutes.


****

06:18:55 – 06:19:00 “There’s no description of the male other than him being a black male.”

I wanted to know how police hear and speak about people. Predominantly and entirely unsurprisingly, individuals are collapsed into a gender and race description:

               white:        Black:        total
Male:          8             9             95 
Female:        1             5             81
total:         38            43

Read all transcript snippets containing white, Black, male, or female here.


***

But also the more benign: dogs?

We hear about lost dogs, found dogs, threatening dogs, and threatened dogs. Read all dog transcript snippets here.

***

But like many beholders of algorithmic systems with a wealth of imperfect data, I struggle to know what meaning to intuit from it. Therefore, instead of presenting this as a finished piece, my canvas on which the last brush stroke has been cast, this is much more humble: a tool, for two people to make meaning together. This collaborative process is also in response to talking with Kyle McDonald, who suggested this become a tool for others to use, rather than a medium for a particularly situated “artist”.

I draw upon the feminist theorist Donna Haraway, and her notion of Situated Knowledges. Instead of attempting to assert a “view from nowhere”, instead: “feminist objectivity means quite simply [speaking from our] situated knowledges“. The result is knowledge that is “partial, locatable, critical” and much more honest than the once and for all facts declared in positivist science.

Under this tradition of ML, it makes sense to approach this as an epistemologically interpretive process – a far cry from the unwitting positivism of implied by the machine learning papers I read – and expect meaning to emerge through intersubjectivity. This then becomes an interactive, collaborative art piece, for people to make meaning together. This allows “located accountability” in technology production, that is, it allows us to be be known as the source of our knowledge claims, allows a discursive process to unfold, instead of presenting evident “truth” or “reality”.

***

Link to live demo. 

How to use this:

  1. Press CMD+F, and search for a term.
  2. Click the link in the “Link” column
  3. Leave an anonymous comment. What does the snippet mean to you? What situated knowledge leaves you
  4. Respond to another’s comment. What intersubjectivity do you share? What don’t you?


Quidity

A few weeks ago, I visited the Westmoreland Museum of Art. There, I saw a piece entitled “Between the Days” by Matt Bollinger, as part of the museum’s show on American realism:

As a painter, I enjoyed this Bollinger’s combination of painting realism with a digital medium to enable a narrative. You see his “hand” in that you have to imagine painting and repainting each frame in a way that you don’t with static paintings. 

My own painting practice is nearly entirely private. My finished pieces go either on my wall, on the wall of whoever commissioned the piece, or under my bed. The only exception is that I occasionally send pictures to my loved ones, or –increasingly rarely – post them on social media. 

I seek to demonstrate the awkward intermediate steps of creating a painting as a way of expressing and assembling my own quiddity. In this way, people are able to see how a painting develops over time, but also the missteps and context in which it is created. 

I first engaged in data archeology to find these progress paintings. This proved to be an awkward endeavor in itself. Not only was it technologically challenging, in extracting digital ephemera from various devices and social media accounts over multiple years, but somewhat traumatizing in seeking for the needles of painting pictures amidst the haystack of past and sad parts of my life.  


The result is a time lapse video where each intermediate picture is given 0.07 seconds on the screen. This represents an enormous compression of time – each of the two paintings presented took approximately 6 months each to complete, yet the resulting video is less than one minute. I have not cropped or sought to standardize the images in order to keep their context intact – context kept hidden to viewers of finished work. 

At first, without sound, I found the result awkward. However, I found this awkwardness funny, so I decided to lean into this, so recorded a non-verbal but vocalized audio track of my reaction to each frame. In doing so, these grunts, cheers, and urghs provide an optional interpretive frame for the viewer to understand how I reacted to seeing my own process assembled – but I encourage viewers to first watch the video on mute to first collect their own interpretation. 


***

David Gray Widder is a Doctoral Student in the School of Computer Science at Carnegie Mellon University where he studies how people creating “Artificial Intelligence” systems think about the downstream harms their systems make possible. He has previously worked at Intel Labs, Microsoft Research, and NASA’s Jet Propulsion Laboratory. He was born in Tillamook, Oregon and raised in Berlin and Singapore. You can follow his research on Twitter, art on Instagram, and life on both.

***

Painter in Time

I recently went to the Westmoreland Museum of Art, and saw Matt Bollinger, Between the Days: 

I usually do not appreciate digital art as much as I do painting. To expand these horizons is part of the reason I took this course, and Bollinger’s combination of the two was entrancing.

I plan to do something similar, but instead of a stop motion conveying a narrative, I plan to create a stop motion of the process of creating my paintings. I usually document my process, taking photos of my canvas after each painting session, but haven’t done anything with these photos before. I plan to create a stop motion, in which one can watch the paint be smushed around until a finished work emerges.

This captures my quiddity indirectly, in that my hand is doing the paint smushing, and in the case that I am painting a portrait, I believe the intermediate steps capture quiddity in my subject.

Postmodern Nonsense? And my theory of the jargon goldilocks

Speaking of someone who leads postmodernism reading groups for fun, this was not. It triggered a discussion amongst some outside colleagues about the use of discipline specific terminology (jargon) to signal in-group status to readers.

On the goldilocks zone for jargon:
– If I were to write an academic paper in simple English, such that it could be understood by a five year old, I would not be taken seriously as an academic, even if the semantic content was otherwise valid and novel.
– On the other hand, If I were to write an academic paper in jargon so cryptic that it was unintelligible, it would not be taken seriously regardless of my semantic intent, because no one could understand it.
– I propose that there is a sweet spot for jargon (the goldilocks zone) that is necessary to prove to your peers that you’re one of them, accepting of their norms and prior work, yet understandable enough by a wide enough breadth of disciplines to be cited and circulated.

On the actual content:
I essentially agree with what I understood to be the argument: there is a difference between the object, experiment, or ~thing~ being measured (first cut), and the observation, measurement, outcome, or interpretation (second cut).

What I failed to understand is how this differs from common critiques of positivist empirical epistemological paradigms, which argue that there is no direct experience of reality (roughly, “first cut”), because we always must interpret meaning onto our experience of the world (roughly, “second cut”). If this was the argument, however, it would have been nice to say that more plainly. Perhaps there was more there I missed, in which case it would have been since to say so more plainly. 

Facial Recognition Recognition … but with drawing

I proposed to create a typology of surveillance power by building facial recognition recognition. That is, I plan to build a computer vision pipeline that can automatically recognize clippings of surveillance cameras from images of street scenes, and an image classifier that categorizes these segmented images into the kind of camera, their technical capability for facial recognition, and the institution they are owned by and send data back to. This will enable me to automate the creation of both power maps and topographic maps of surveillance, that is: both representations of the relationships between institutions of power the surveillance acts on behalf of, as well as representations of the spatial locations different kinds of surveillance can be found. 

This project is a step toward that. I am inspired by the maps of Manhattan surveillance cameras in the Institute for Applied Autonomy’s Routes of Least Surveillance. This work is also inspired by the Pittsburgh Surveillance Walking Tour made by the Coveilance Collective (of which I am a member). The idea of an abstracted map came from “Learning from Las Vegas” by Denise Scott Brown, Robert Venturi, and Steven Izenour, depicting street signs visible from the Las Segas strip (shown below). 

While similarly enthralled with the geography of surveillance and exhaustive geographic accounts of specific features of a place, my new work seeks to build on these projects by recognizing that surveillance cameras are not singular, but varied in their age, technical capabilities, their owner, and who they do and do not share data with. This work seeks to surmise tentative answers from a detailed study of cameras’ outward characteristics.

I had originally intended to build a computer vision algorithm that would recognize surveillance cameras, and classify them according to their capacity to support facial recognition and resulting data owner. However, after attempting to collect training data for this idea, I realized that a more detailed examination of the physicality of the varied cameras that appear in the Pittsburgh landscape was needed. I therefore decided to create drawings of these cameras in three short stretches of street across Pittsburgh. 


***

Border of The Hill and Duquesne University

Context: The Hill district is a historically Black neighborhood. Just to its southwest tip lies Duquesne University private a predominantly white university. 


Appears to be mostly older-generation cameras, of uncertain facial recognition ability.  

Hardened, placed high up on private businesses. 

PNC bank had a camera swiveling loudly on a timer. 

Duquesne has a “Blue Light Pole” of dubious effectiveness with a camera towering atop.

***

***


Finally, by placing the camera drawings on correspondent maps, and comparing between these three neighborhoods, I reached tentative hypotheses. As well as being presented here, these maps, drawings, and hypotheses are presented on a poster.

As noted in book Photography and Science by Kelley Wilder, cameras are often used to record the particular, whereas drawing provides a medium suited for drawing the “ideal specimen” by abstracting away extraneous visual information. Also, noticing small differences between ostensibly similar cameras requires a long period of focused looking, the same kind of looking that is required to produce a drawing. In this way, drawing is the appropriate capture technique for this project. 


***

Bloomfield

Bloomfield is an "up and coming" historically Italian neighborhood, now home to hip bars and restaurants. 

Many newer generation IoT cameras, higher resolution and internet-connected. 

Footage could be shared with law enforcement directly though partner programs. 

Often lower to the ground, more at eyeline.

Some video doorbells.

***

***

To produce this project, I meticulously drew every visible surveillance camera on three stretches of street in the areas of Bloomfield, Walnut Street, and the border of The Hill District and Duquesne University Campus. I then carefully digitized these drawings, and put them on a map of where exactly each camera exists. I then wrote a short analysis of the kinds of surveillance technology characteristic to each neighborhood, presented on the poster and interspersed in this blog post.

***

Walnut Street.

Context: this is the bougie shopping street. Think Apple, Banana Republic, and overpriced cocktail bars. 

Lower density of privately-owned cameras. 


City-owned cameras on utility poles. 

Highly visible street signs announcing this surveillance. 

Who gets this data? How?

***

***


I have not yet achieved my goal of building a facial recognition recognition system, by building a computer vision system able to recognize cameras capable of facial recognition. However, this project is a step in that direction, and opens new opportunities, chiefly: When I do build such a system, what can we learn about the different modalities and owners of surveillance, between different neighborhoods?

See the entire full res poster including maps side by side here.

***

David Gray Widder is a Doctoral Student in the School of Computer Science at Carnegie Mellon University where he studies how people creating “Artificial Intelligence” systems think about the downstream harms their systems make possible. He has previously worked at Intel Labs, Microsoft Research, and NASA’s Jet Propulsion Laboratory. He was born in Tillamook, Oregon and raised in Berlin and Singapore. You can follow his research on Twitter, art on Instagram, and life on both.

***

bonus @Bankrupt Bodega:


Electron Evidence

I scanned a screw that holds microphones and low resolution infrared cameras into my office’s wall. These devices were installed in my department’s offices, often without asking for consent of the occupants. I removed the whole sensor at one point, but got in a lot of trouble. Instead, this time I removed a screw and scanned that. The screw is unique, so this is “evidence” of my “crime”, in that it is evidence that this specific screw was removed from my office wall, and put into a fairly rare kind of microscope.

Facial Recognition Recognition

I propose to create a typology of surveillance power by building facial recognition recognition. That is, I plan to build a computer vision pipeline that can automatically recognize and clippings of surveillance cameras from images of street scenes, an image classifier that categorizes these segmented images into the kind of camera, their technical capability for facial recognition, and the institution they are owned by and send data back to. This will enable me to automate the creation of both power maps and topographic maps of surveillance, that is: both representations of the relationships between institutions of power the surveillance acts on behalf of, as well as representations of the spatial locations different kinds of surveillance can be found.


Explanatory illustrations

I have an existing practice of walking around short stretches of Pittsburgh streets and exhaustively drawing every single surveillance camera I can see. This has allowed me to notice the particular different kinds of cameras: whether it be the telephone pole mounted ones that send data to Allegheny county, the Amazon Ring cameras that guard private homes and businesses, or the pan and tilt ones that create audible and motion presences outside of banks.


But this takes forever. What if computer vision did this for me from images taken of street scenes? Better yet, what if I used google street view images, so I could do this at a massive scale?


I want an inventory of every single camera visible from the street in Pittsburgh, along with who owns each, and what model of camera and what capabilities it has.

On Different Subjectivity in the Particular and the Ideal, and Agentic AI

I had not previously appreciated the notion that photography captures the “particular”, in contrast to previous kinds of scientific imaging, such as drawing, that depict an “ideal” specimen (p33, Wilder 2011). In this way, both modes of scientific depiction reveal different modes of subjectivity: in the first case in choices of what particular specimen to capture, and in the second case by choosing which aspects of a type are considered “ideal”. Both are helpful in different ways: drawings in bird books capture the ideal to permit identification regardless of lighting or surrounding habitat, whereas a photo of a bird in this context is more likely to be seen as “proof” that you actually saw this species of bird. 

In light of recent releases of AI based image generation algorithms such as GPT3 or Stable Diffusion, and controversy over an AI generated image winning a prize, after which its creator said “Art is dead, dude. It’s over. A.I. won. Humans lost.” (Roose, 2022).  As someone who studies AI and also as a Painter, I have recently had to explain to AI folks how silly this claim sounds to artists: one may as well claim “Paint won, humans lost”. AI is no more an Artist than “paint” is an Artist: AI is a medium, with which agentic humans interact to create art. The value is inherent in this agency: that is why sites have sprung up to sell expert-created prompts to coax out certain images from these AI models (ie, https://promptbase.com)  The same debates were had for photography – that photography would “kill” art –  but as the Wilder reading showed, photography is subjective in the same way as other artistic media, demonstrating the value of the photographer. But somehow we seem to credulously ascribe agency to “AI”, whereas with photography, the claim was that it would remove agency. 


***

Wilder, Kelley. “Photography and Science.” University of Chicago Press, Jan. 2011.

Roose, Kevin. “An A.I.-Generated Picture Won an Art Prize. Artists Aren’t Happy.” The New York Times, 2 Sept. 2022. NYTimes.com, https://www.nytimes.com/2022/09/02/technology/ai-artificial-intelligence-artists.html.


Sexy AI? “technological possibilities are irresistible to [hu]man”

The ethnography of Nafus and Sherman (2014) shows how those in the Quantified Self movement “collect extensive data about their own bodies” to become more aware of their mood, health, and habits, redeeming the liberatory and interpretive potential from the same technologies which usually “attract the most hungrily panoptical of the data aggregation businesses” in service of capital, carceral, or managerial ends.

In this “Looking Outwards” report, I encountered Berlin-based fashion designer and sports scientist Anna Franziska Michel, who creates designs for fabric and clothes based on self-capture of her health and sport data. In her presentation, she wears a red and blue marble-patterned dress she created using an “AI” “neural painter” from her self-tracking data. She observes that the prominence of red demonstrates that she is sitting more after founding a fashion design company.

However, I found this work fell short in ways I see other new media art falling short: exciting conceptual impulses motivate the exploration of new technological possibilities, but without a coherent link in the other direction. In what way does the affordances of the hyped new technological artifact inform new conceptual ideas or possibilities, in turn? For example, how does her outfit inform her sense of self, help her better understand her health as she wears it, or comment on the idea of self more generally? When she sells her designs based on her own data for others to wear, what does this represent for the wearers? Do they feel any connection to her or her data they are wearing, or do they just receive it as a cool looking design, made sexy by the imprimatur of “AI”?

***

Nafus, Dawn, and Jamie Sherman. This One Does Not Go Up to 11: The Quantified Self Movement as an Alternative Big Data Practice. 2014, p. 11.

Michel, Anna Franziska. Using Running And Cycling Data To Inform My Fashion. https://quantifiedself.com/show-and-tell/?project=1098. Quantified Self Conference.

The title quotes John von Neumann, from: Chandler, Daniel. Technological or Media Determinism. 1995.