When is the last time you looked up while driving or walking underneath a bridge?
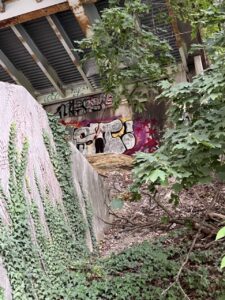
Through this project, I set out to document bridge damage in a way that is difficult to experience with the naked eye, or that we are likely to overlook or take for granted in our day to day life.
Inspiration and Background
At the beginning of this process, I was really inspired by the TRIP Report on Pennsylvania bridges, a comprehensive report that listed PA’s most at risk bridges and ranked them by order of priority. I was interested in drawing attention to the “underbelly,” an area that’s often difficult to access, as a way to reveal an aspect of our daily life that tends to be unnoticed.
Initially, I was planning to use a thermal camera to identify damage that’s not visible to the naked eye. After meeting with two engineers from PennDOT, I learned that this method would not be effective in the way I intended, as it only works when taken from the surface of the bridge. It would have been unsafe for me to capture the surface, so I decided to recalibrate my project from capturing invisible damage, to emphasizing visible damage that would otherwise be unnoticed or hard to detect. Here are some examples of my attempts at thermal imaging on the bottom of the bridge. I was looking for heat anomalies, but as you can see the bridges I scanned were completely uniform, regardless of the bridge material or time of day.
Process and Methodology
After thermal imaging, I moved to LiDAR (depth) based 3D modeling. My research revealed this is the favored method for bridge inspectors, but the iPhone camera I was using had a pretty substantial depth limitation that prevented me from getting useful scans. Here are a few examples of my first round.


These scans were not great at documenting cracks and rust, which are the focus of my project. At Golan’s recommendation I made the switch to photogrammetry. For my workflow, I took 200-300 images of each bridge at all angles, which were then processed through Polycam After that, I uploaded each one to Sketchfab, due to the limitations of Polycam’s UI.
I chose photogrammetry because it allows the viewer to experience our bridges in a way that is not possible with the naked eye or even static photography. Through these 3D captures, it’s possible to see cracks and rust that are 20+ feet away in great detail.
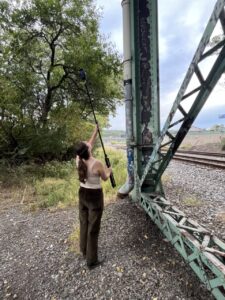
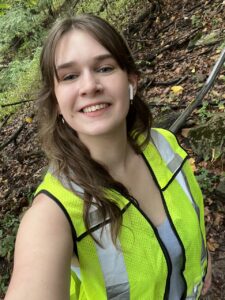
Here’s some pictures of me out capturing. A construction worker saw me near the road and came and gave me a high vis vest for my safety, which was so nice I want to give him a shoutout here!


Results
This project is designed to be interactive. If you’d like to explore on your own device, please go here if you’re viewing on a computer, and here for augmented reality (phone only). I’ve provided a static image of each scan in this post, as well as 5 augmented reality fly throughs, out of the 9 models I captured.


I am quite pleased with the end result compared to where I started, but there’s still a lot of room for improvement in the quality of the scans. After so many iterations I was restricted by time, but in the future I would prefer to use more advanced modeling software. I would also like to explore hosting them on my own website.
Special thanks to PennDOT bridge engineers Shane Szalankiewicz and Keith Cornelius for their extraordinary assistance in the development of this project.