For this project, I ended up deciding to use an EEG device, the Muse2 headband, to create real time spectrograms of the electrical activity in my brain before, during, and after the 2024 election. I actually started with a completely different topic using the same capture technique, but I realized last Monday what a great opportunity it was to do my project around the election, so I decided to switch gears.
I was really excited by this project because biology/life science is really interesting to me. An EEG is just a reading of electrical signals, completely meaningless without context, but these signals has been largely accepted by the scientific community to correlate with specific emotional states or types of feelings, and it’s fascinating how something as abstract as an emotion could be quantified and measured by electrical pulses. Elections (particularly this one) often lead to very complicated emotions, and it can be difficult to understand what you’re feeling or why. I liked the idea of using
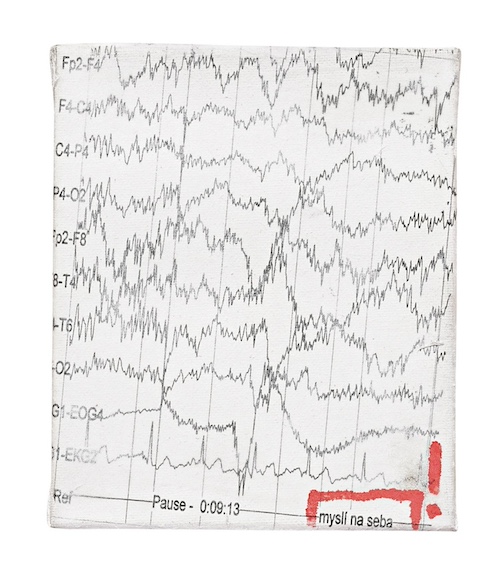
I was inspired by a few artists who use their own medical data to create art, specifically EEGs. Here’s an EEG self potrait by Martin Jombik, as well as a few links to other EEG artwork.


I was interested in using a capture technique that
Workflow
To take my captures, I tried to standardize the conditions under which they were taken as much as possible. For each one, I tried to remain completely still, with closed eyes. I wanted to reduce the amount of “noise” on my recordings- aka any brain activity that wasn’t directly related to my emotional state or thoughts and feelings. I also used an app called MindMonitor which has a convenient interface for reading the data coming out of the Muse2 headset.
For my first capture, the “control,” I tried to do it in a state of complete relaxation, while my mind was at rest. I took it on November 3rd, when election stress was at a neutral level. After that, I experimented with what I did before the capture like watching political ads, reading the news, and of course finding out the results. I then laid down with eyes closed while wearing the headset. Finally, I took one last capture 3 days later, on November 1oth, once my stress/emotional state had returned to (semi) normal.
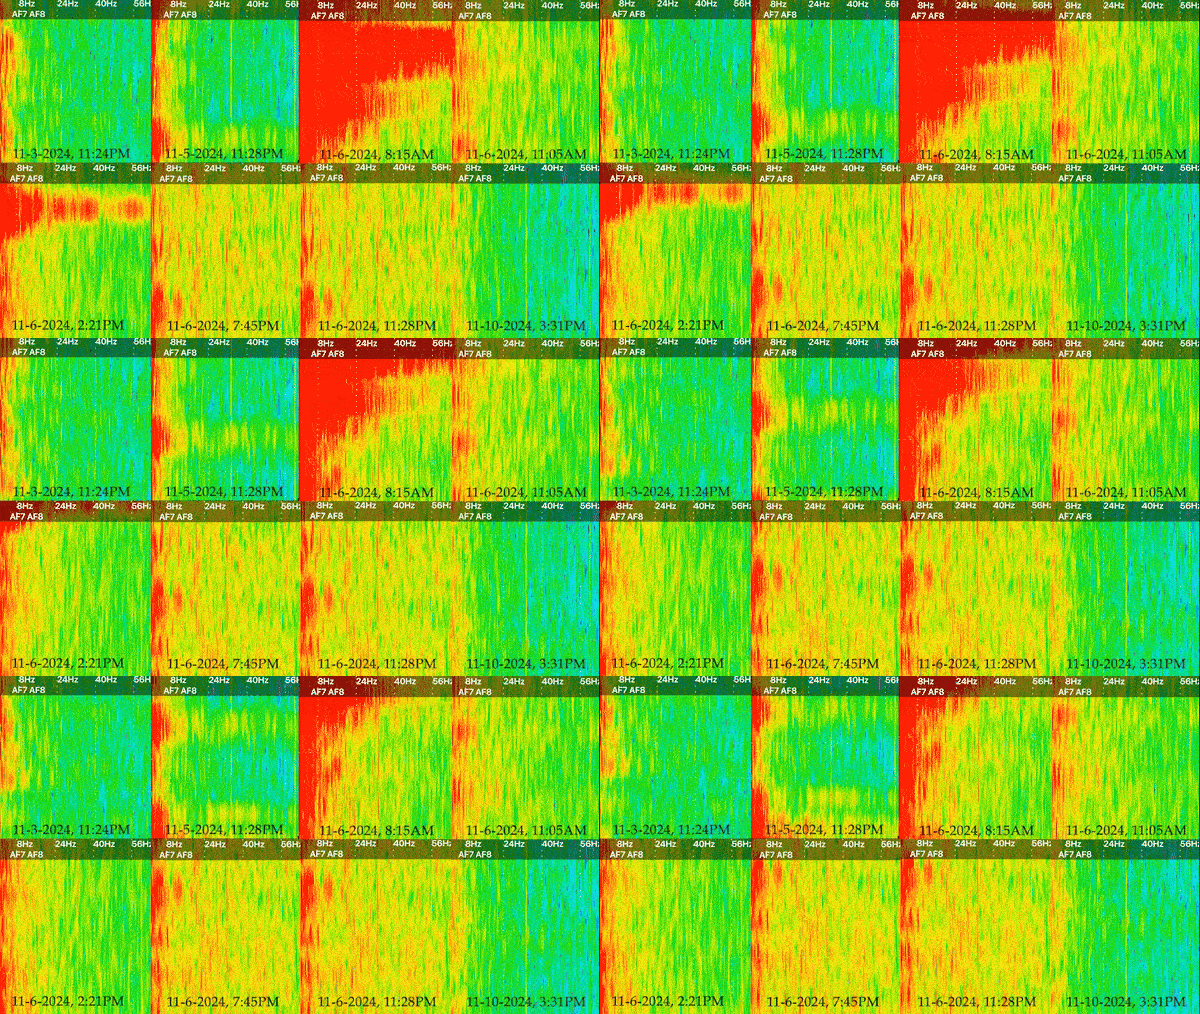
I decided to present my captures in the form of spectrograms, which is a visual representation of signal strength over time. I found this to be easier to understand than the raw data, as it showed change overtime and provided a color coded representation of signal strenght. These spectrograms can then be distilled into single images (which capture a finite moment in time), or a moving image that shows the results over several minutes. I’ve decided to present each spectrogram as a side by side gif with time stamps to reveal the differences between each one.
Results
There are 5 different types of brain waves that are plotted on the spectrogram, ranging in frequency from 1 to 60hz. I’ve included a glossary of what each frequency/wave type might mean.
- Delta, 1-4hz: Associated with deep sleep/relaxation, found most in children/infants.
- Theta, 4-8hz: Associated with subconscious mind, found most often while dreaming or sleeping.
- Alpha, 8-14hz: Associated with active relaxation, found most often in awake individuals who are in a state of relaxation or focus, like meditation.
- Beta, 13-25hz: Associated with alertness/consciousness, this is the most common frequency for a conscious person.
- Gamma, 25-100hz: The highest frequency brain waves, associated with cognitive engagement, found most often while problem solving and learning.
Generally, the areas of 0-10hz are always somewhat active, but in a state of relaxation you should see the most activity around 5-14hz, and barely any activity at the higher frequencies. Blue indicates areas of very low activity, while red indicates an area of high activity.

I think the video is really effective at showing the differences between each over the same length of time. Prior to the election, the results show relatively low activity overall. While there is consistently a band of red on the leftmost side, the spectrogram from November 3rd is consistent with a person who is relaxed. Going into November 5th and 6th, things look very different. There’s greater activity overall, especially with regards to beta and gamma waves. In fact, there is so much more activity that there is barely any blue. Even without knowing how I felt or what was going on the day these were taken, it’s clear that my brain was substantially more active during those two days than it was before or after. I found the results to be incredibly revealing with regards to the acute impact this years election cycle had on me, especially when placed into context with my “normal” spectrograms before and after.