How much does your skin color vary across different parts of your body?
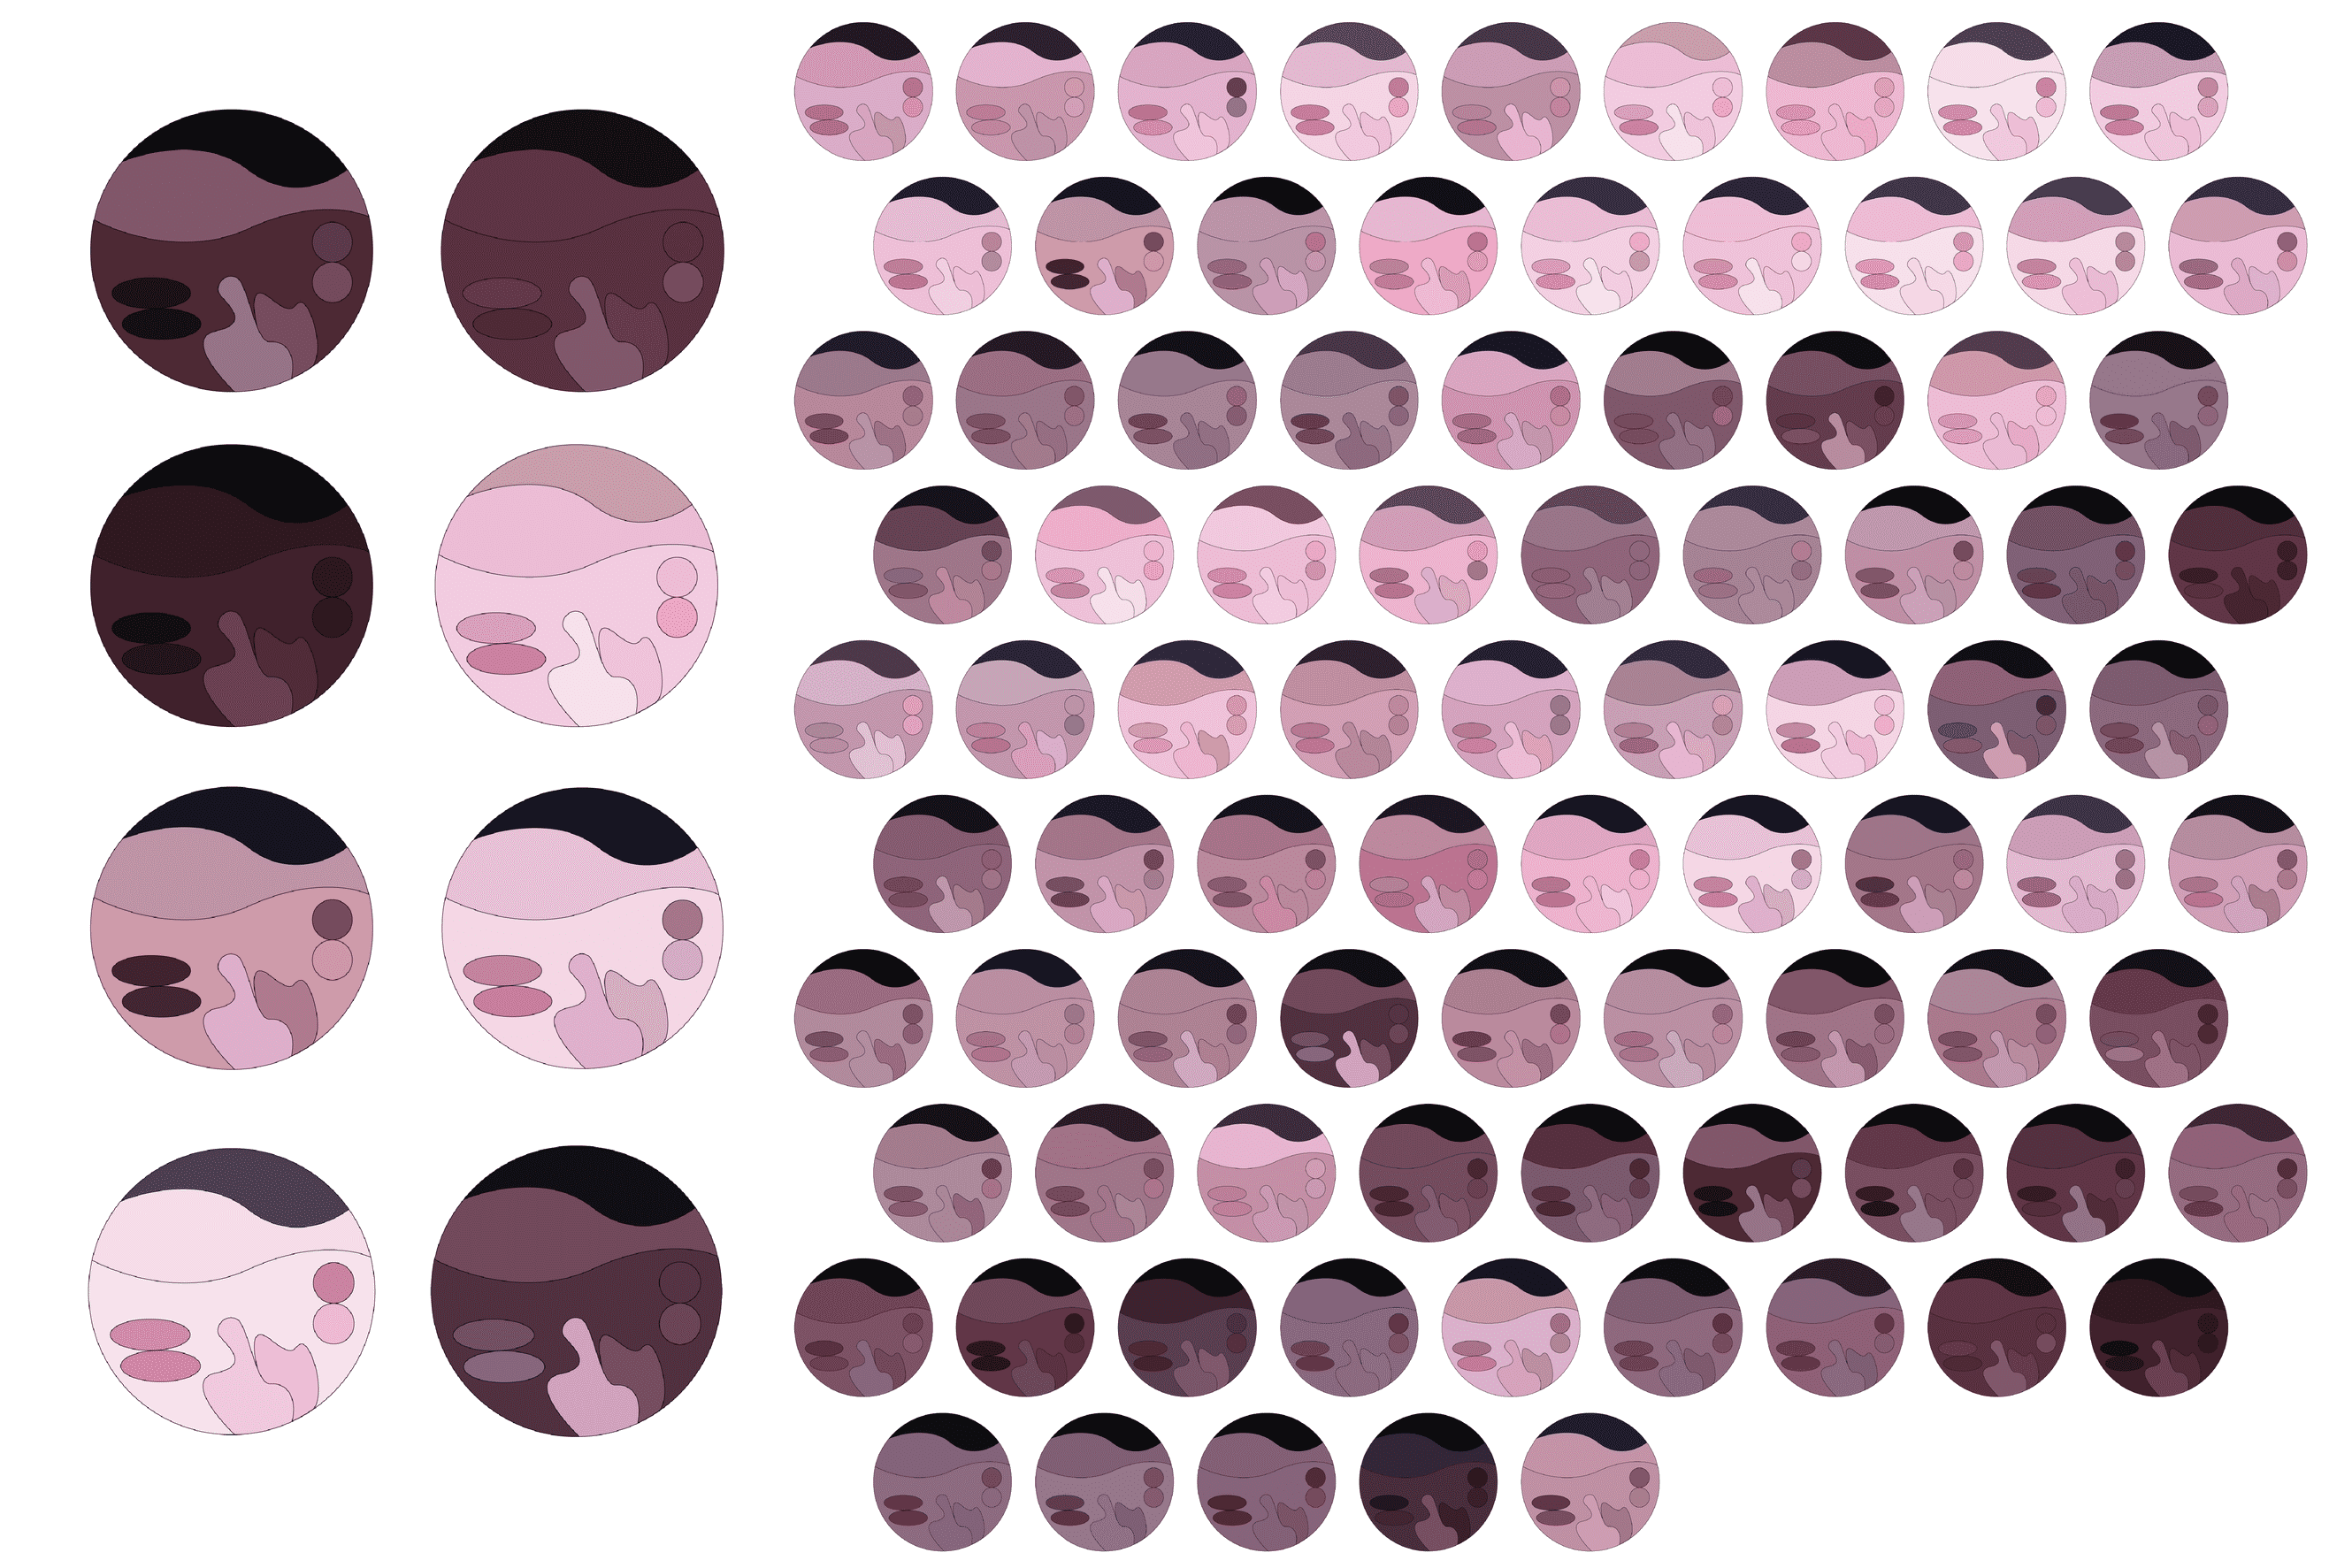
While most of us think of ourselves as having one consistent skin color, this typology machine aims to capture the subtle variations of skin tone within a single individual, creating abstract color portraits that highlight these differences.
I started this project by determining which areas of the body would be the focus for color data collection. To ensure comfort and encourage participation, I selected nine areas: the forehead, upper lip, lower lip, top of the ear (cartilage), earlobe, cheek, palm of the hand, and back of the hand. I also collected hair color data to include in the visuals.
I then constructed a ‘capture box’ equipped with an LED light and a webcam, with a small opening for participants to place their skin. This setup ensured standardized lighting conditions and a consistent distance from the camera. To avoid camera’s automatic adjustments to exposure and tint, I used webcam software that disabled color and lighting corrections, allowing me to capture raw and unfiltered skin tones.
Box building and light testing:
Next, I recruited 87 volunteers and asked each to have six photos taken that would allow me to capture the 9 specific color areas. The photos included front and back of their hands, forehead, ear, cheek, and mouth.
Once the images were collected, I developed an application to allow me to go through each photo, select a 10×10 pixel area and identified the corresponding body part. The color data was then averaged across the 100 pixels, labeled accordingly, and stored in a JSON file, organized by participant and skin location.
A snippet of the image labeling and color selection process:
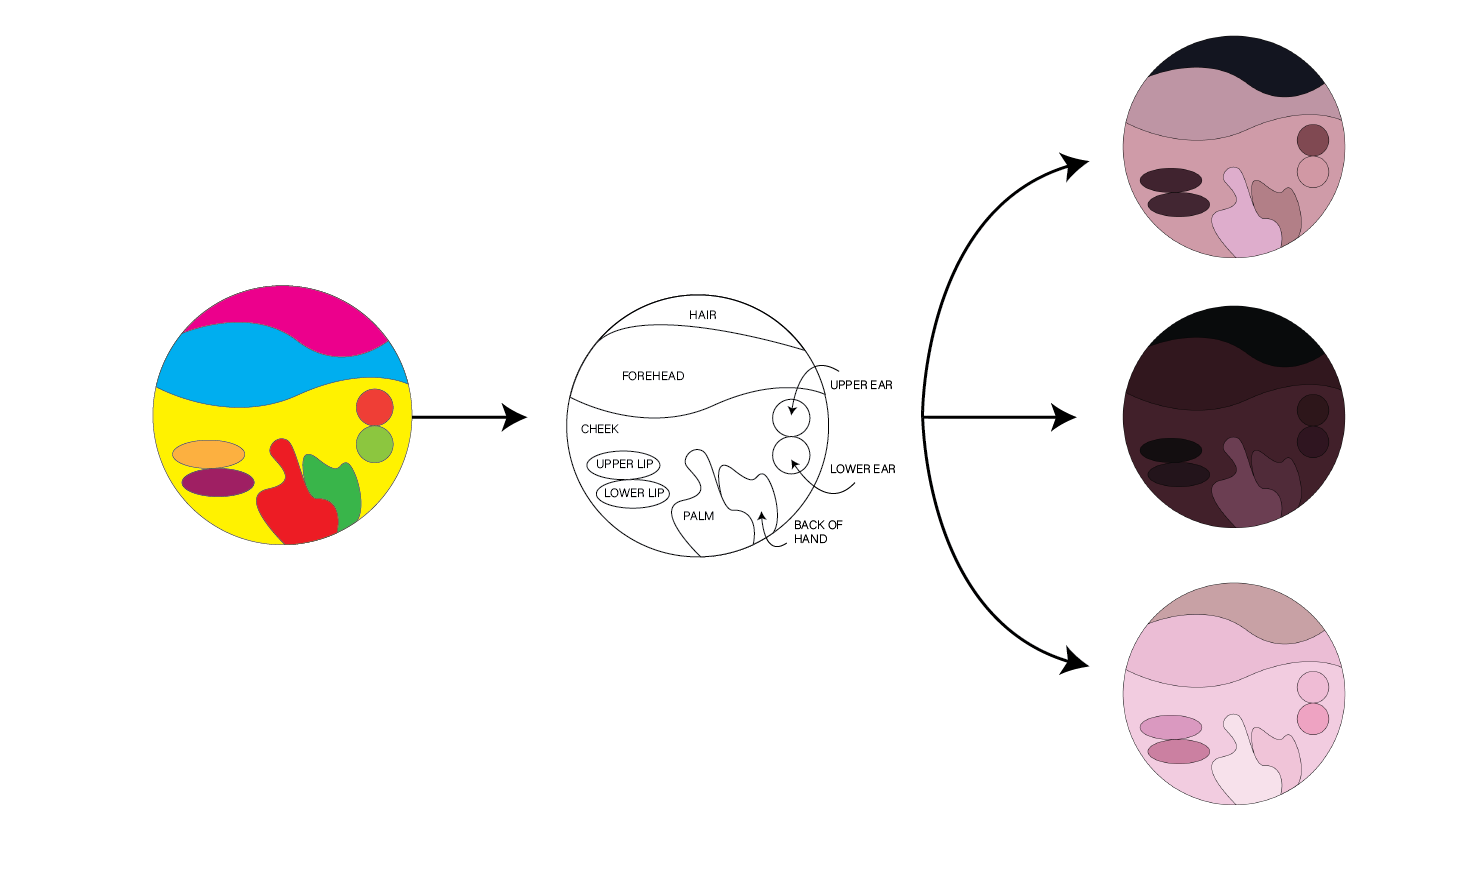
Using Adobe Illustrator, I wrote another script to map the captured color values into colors in an abstract designs, creating a unique image for each person.
The original shape in Adobe Illustrator and three examples of how the colors where mapped.

Overall, I’m pleased with the project’s outcome. The capture process was successful, and I gained valuable experience automating design workflows. While I didn’t have time to conduct a deeper analysis of the RGB data, the project has opened opportunities for further exploration, including examining patterns in the collected color data.
A grid-like visual representation of the entire dataset:
