Flatbed 3d Scanning

Creating 3d Scans using a Flatbed Scanner
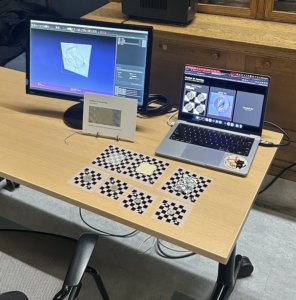
This project uses the optical properties of a flatbed scanner to generate normal maps of flat objects, and (eventually) 3d models of them.

I leverage heavily from this paper:

Using the work of Skala, Vaclav & Pan, Rongjiang & Nedved, Ondrej. (2014). Making 3D Replicas Using a Flatbed Scanner and a 3D Printer. 10.1007/978-3-319-09153-2_6.

Background:

tldr : this sucked, but opened up an opportunity

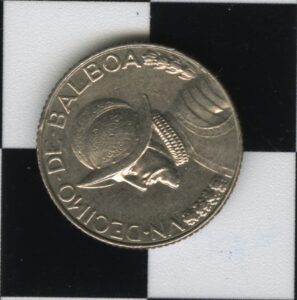
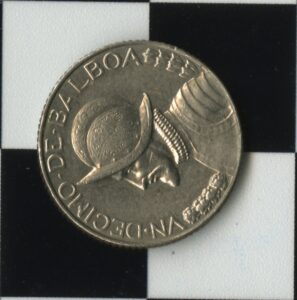
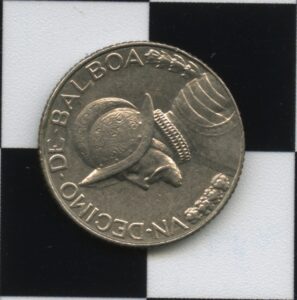
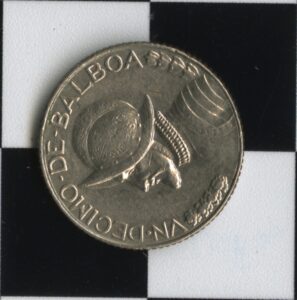
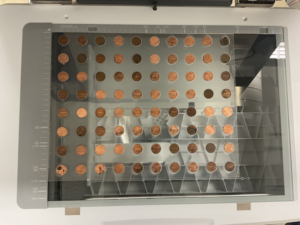
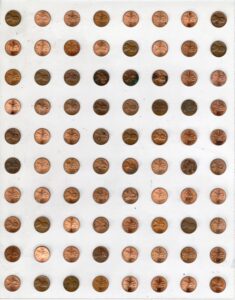
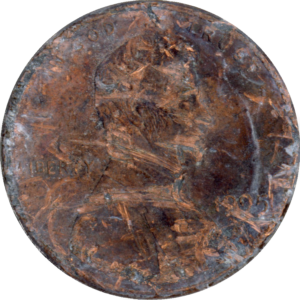
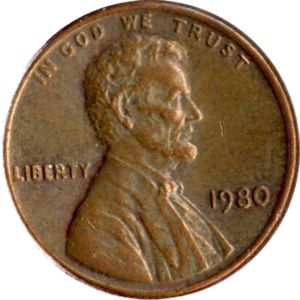
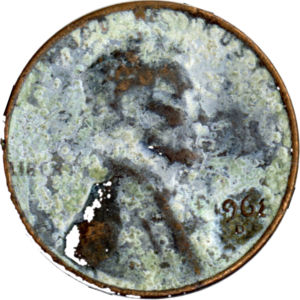
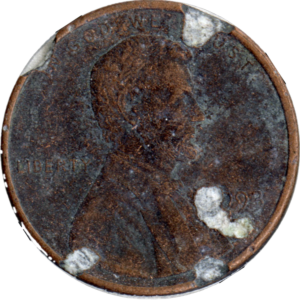
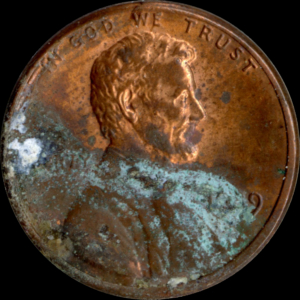
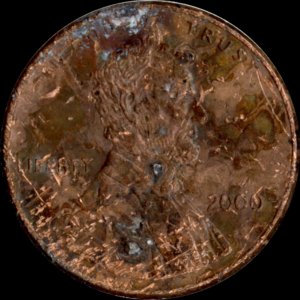
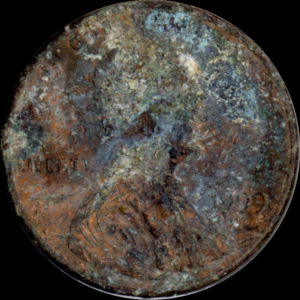
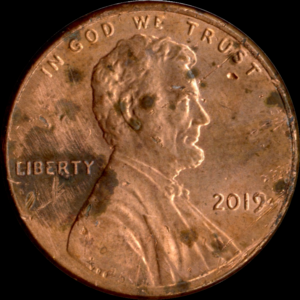
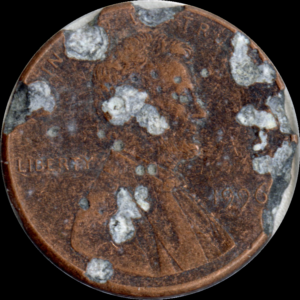
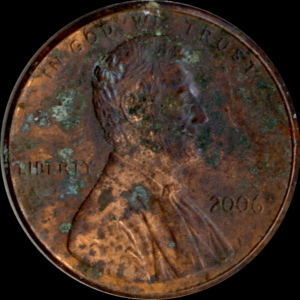
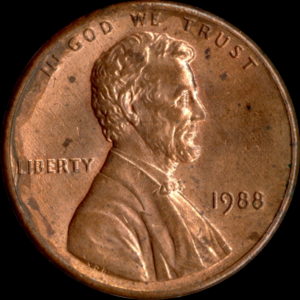
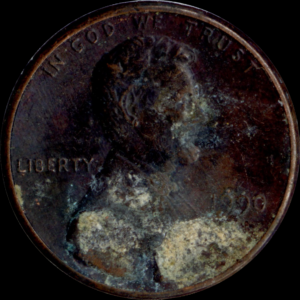
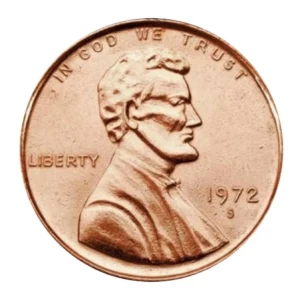
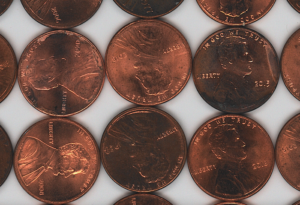
This project is a result of a hurdle from my Penny Space project for the typology assignment for this class. In scanning 1000 pennies, I encountered the problem where the same penny, if scanned from different orientations, results in a different image. This resulted in having to manually align all 1089 pennies, but this project explores why this behavior occurs and how it can be harnessed


Why does this behavior occur?
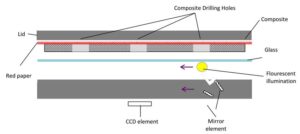
flatbed scanners provide a linear source of light. This is sufficient for photographic flat objects, but when scanning objects with contours, contours perpendicular to the direction of the light will appear dimmer, whereas parallel ones will appear brightness due to reflection. This means we can use brightness data to approximate the angle the surface is oriented, and use that to reconstruct a 3d surface.
Pipeline:

4x 2d scans

-> scans are aligned

->  extract brightness values at each pixel of 4 orientations

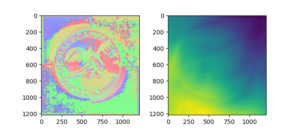
->  compute normal vector at each pixel

-> surface reconstruction from normal vector

More Detail:

Scanning:
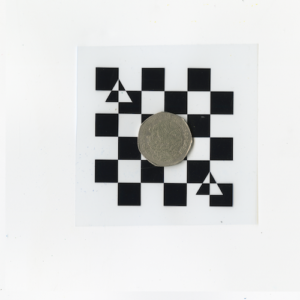
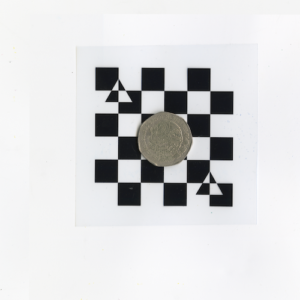
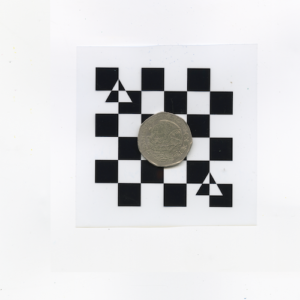
Object is taped to a registration pattern and scanned at 90 degree increments, than aligned with one another via control points on the registration pattern

Brightness Extraction

Images are converted to grayscale to extract the brightness value at each pixel.

Normal Reconstruction

A bunch of math.

Surface Reconstruction

A bunch more math.


Initial Results


Improved Results

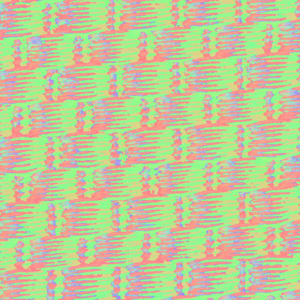
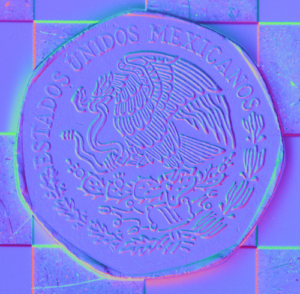
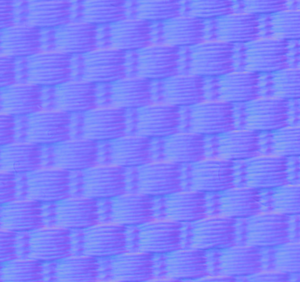
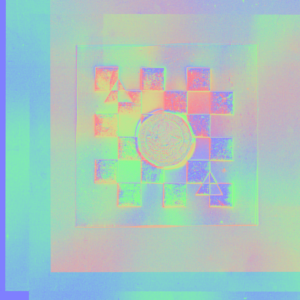
After finding some mathematical issues + fixing type errors in my implementation, here is a better normal map:

and associated obj:

What’s Next?

Possible Refinements:

Add filtering of brightness and / or normal vectors

4x 2d scans

-> scans are aligned

->  extract brightness values at each pixel of 4 orientations

    ->  PROCESS SIGNAL

->  compute normal vector at each pixel

    ->  PROCESS SIGNAL

-> surface reconstruction from normal vector


Flatbed 3d Scanning

Creating 3d Scans using a Flatbed Scanner


This project uses the optical properties of a flatbed scanner to generate normal maps of flat objects, and (eventually) 3d models of them.

I leverage heavily from this paper:

Using the work of Skala, Vaclav & Pan, Rongjiang & Nedved, Ondrej. (2014). Making 3D Replicas Using a Flatbed Scanner and a 3D Printer. 10.1007/978-3-319-09153-2_6.

Background:

tldr : this sucked, but opened up an opportunity

This project is a result of a hurdle from my Penny Space project for the typology assignment for this class. In scanning 1000 pennies, I encountered the problem where the same penny, if scanned from different orientations, results in a different image. This resulted in having to manually align all 1089 pennies, but this project explores why this behavior occurs and how it can be harnessed


Why does this behavior occur?

flatbed scanners provide a linear source of light. This is sufficient for photographic flat objects, but when scanning objects with contours, contours perpendicular to the direction of the light will appear dimmer, whereas parallel ones will appear brightness due to reflection. This means we can use brightness data to approximate the angle the surface is oriented, and use that to reconstruct a 3d surface.

Pipeline:

4x 2d scans

-> scans are aligned

->  extract brightness values at each pixel of 4 orientations

->  compute normal vector at each pixel

-> surface reconstruction from normal vector

More Detail:

Scanning:
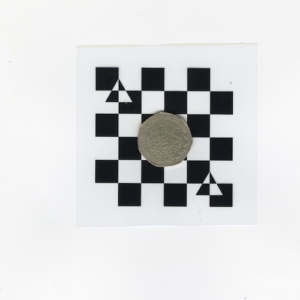
Object is taped to a registration pattern and scanned at 90 degree increments, than aligned with one another via control points on the registration pattern

Brightness Extraction

Images are converted to grayscale to extract the brightness value at each pixel.

Normal Reconstruction

A bunch of math.

Surface Reconstruction

A bunch more math.


Initial Results


full pipeline:

get the obj

fabric obj

What’s Next?

resulting surface is at an angle, limiting resolution. This is (likely) an issue with my math…

Possible Refinements:

Add filtering of brightness and / or normal vectors

4x 2d scans

-> scans are aligned

->  extract brightness values at each pixel of 4 orientations

    ->  PROCESS SIGNAL

->  compute normal vector at each pixel

    ->  PROCESS SIGNAL

-> surface reconstruction from normal vector
Final ~Thing~ I want to make : web app to allow anyone to create 3d scans in this way! Coming soon.


Final Project Proposal

I think I will use the final project as an opportunity to expand on my person in time. There are lots of avenues I can take to explore my project further, some in the video processing part of the project (currently working on a fluid simulation, but there are other possibilities), the image capture (im thinking about using an RGBD camera to have more dimensions to characterize motion by), and the final presentation (I still want to polish the interactive demo I had made for the second project).

Pursuing this for the final project will also give me time to talk with Stephen Neely, something I was planning to do but didn’t find the time during the person in time project.

Moving Together

I created a pipeline that takes a video and creates an abstract representation of its motion.

see it for yourself : https://yonmaor1.github.io/quiddity

code : https://github.com/yonmaor1/quiddity

videos:

WHY:

I’m interested in analyzing how people move, specifically how people move together. Musicians were an obvious candidate, because their movement is guided by an ‘input’ that the audience is able to hear as well. I was curious about abstracting away the musicians motion into shapes that we can follow with out eyes while also listening to the music, in order to see what in the abstraction is expected and what isn’t. Certain movements correspond directly to the input in ways that are expected (the violist plays a forte and moves quickly so their motion blob becomes large), while others are less expected (the violinist has a rest so they readjust their chair, creating a large blob in an area with little movement otherwise).

how:

video -> optical flow -> Gaussian Mixture Model -> Convex Hull -> b-spline curve -> frame convolution

in detail:

1. I used a video of the Beethoven String Quartet Op.59 No.1 “Razumovsky”

Credit: Matthew Vera and Michael Rau – violins. David Mason – viola Marza Wilks – Cello

2. Optical Flow

I used OpenCV in python to compute dense optical flow of the video. That is, I represent the video as a 2d grid of points and compute a vector stemming from each of those point, representing the direction and magnitude that that point is moving in in the video.

3. Gaussian Mixture Model

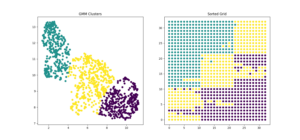
I filter out all vectors below a certain threshold, then use the remaining vectors (represented in 4 dimensions as x, y, magnitude, angle) as data points in a Gaussian Mixture Model clustering. This creates clusters of points which I can then transform into geometric blobs.

aside: why GMM? GMM clustering allows for both non-spherical clusters and overlapping clusters, both of which are unachievable with other popular clustering algorithms like k-means or nearest neighbors. My application requires a lot of irregularly shaped, overlapping clusters as the musicians overlap one another while they play.

4. Convex Hull

I now take each collection of points that step 3. yeilded, and compute its convex hull – that it, a closed shape tracing the perimeter of the cluster.

5. B-spline curve

I can now smooth out this convex hull by treating it as a set of control points of a b-spline.

6. frame convolution

This step simply smooths out the output video, in order to create a less sporadic final video. This essentially transforms each frame into the average of the frames surrounding it.

musician quiddity

I want to use motion detection to examine the of musicians as they play, particularly looking at the relationships of their movements.

Some ideas:

  1. frame differentiation:

    look at actual pixels that are moving. this is very easy, but may yield only small smudges of motion.
  2. frame diff -> threshold -> blob
    rather then show the actual pixels, create a shape from the pixels and expand it out into an abstracted blob.
    – thinking a lot about Forsythe, formalizing movement
    – Dalcroze Eurhythmics, https://www.cmu.edu/cfa/music/people/Bios/neely_stephen.html
  3. body tracking
    will capture more abstract high level objects rather then just pixels, but will create more ‘standard’ shapes. I worry this is gonna be kinda ‘filtery’
  4. maybe combine both somehow

Person in Time Research

  1. ElonJet

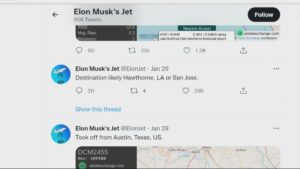
ElonJet is a now suspended twitter account that used to track the real time private jet data of cartoon villain Elon Musk. Musk publicly feuded with the creator of ElonJet since 2020, in several instances trying to buy him out and shot him down. This raises important ethical points, specifically the fact that it’s ok to be unethical towards billionaires. The accound exists today as @ElonJetNextDay, wich has a 24 hour delay to accound for (Elon’s own) restrictions on automated twitter users. Other than its obvious effect of revealing the insane reality of travel afforded to billionaires, ElonJet also played a role in showing people how childish and incompetent Musk is, and by extension breaking down a lot of meritocratic assumptions people have about capitalism.


2. A Cow a Day, Pejk Malinovski

A cow a day is a podcast by poet and radio producer Pejk Malinovski, in which Malinovski spends his day following a cow around the Ganges River in India. We’re used to content in which one main character, the narrator, is a ‘constant’ while other thigs move around them, but here the narrator is mostly passive, observing the cow and the scenery changing around it. This creates an interesting portrait with an unclear subject, merging Malinovski and the cow into one.


3. Still Water, Roni Horn

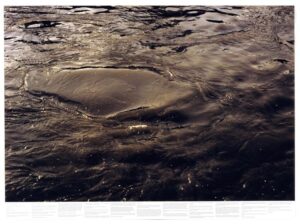
this one is kind of a stretch, but this piece creates a capture of its audience and comments on the way they interact with images and text in a way unlike anything I’ve ever interacted with before.

Penny Space

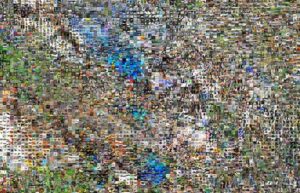
Pennies are meant to be non unique. They are worth exactly one cent because it was decided that they be worth exactly one cent. They are the smallest form of currency in America, and so much be thought of as entirely homogeneous and uniform. In reality though, pennies are anything but. We’ve al experinced getting for change a particularily grimy penny, maybe corroded, maybe green, maybe scratched up and tarnished, then, after taking a quick glance at its year dropping it in a tip jar on in a pant pocket, never to see the light of day again. We don’t generally get the chance to see the entire visual space pennies can occupy, and appreciate their weirdnesses and differences across their entire aesthetic spectrum. Hence, Penny Space.


I scanned 1149 pennies with a high resolution scanner, wrote python scripts to crop them, embed them into vectors, and dimension reduce those vectors into the 2D grid you see above.

https://drive.google.com/file/d/18HjtfdaTxEtqxDTBvWk1kZXjHNxAikwF/view?usp=drive_link

I was also able to extract the years from the pennies using OCR


here are some nice pennies


edit:

1000 Pennies

My plan for the typology is to continue my exploration of pennies from previous studios. Since this is a typology, I plan to focus on scanning a large number of pennies and trying to learn something about the ‘pennie space’ – ie the visual space pennies occupy.

^ penny

Below is my planned pipeline:

(1) scan pennies with flatbed scanner –> (2) python openCV edge detection to extract individual pennies –>  (3) rotation correction (also pythonCV ?) –> (4) perform umap on penny images –> (5) interpolate the output to a grid (RasterFairy?)

^ gridded t.sne from ml4a

I also want to try and see if interesting patterns emerge from computing and visualizing the norm between each penny and the average penny, to visualize both individual wear on each penny and average wear across all pennies. This would use the same first 3 steps, then require a separate computing norms (which would be pretty easy I think).

I’ve written the openCV script for separating the pennies and plan on scanning some pennies and testing it this week, then have to write the rotation correction. I found and played around a bit with this open source umap python package and I think it’ll work well, but I still have to figure out how to do grid interpolation. That same package does have an aligned umap api but im not sure that’ll accomplish what I want.

Reading 1

I think the reading illuminates an interesting relationship between photography as a scientific tool and an artistic tool. The reading refers to some of the examples we’ve discussed in class relating to typologies, in which photography is used as a means for answering a question. Then, in the reading’s discussion of Photogrammetry, Wilder discusses instances where the technology take certain kinds of measurements ‘by accident’ – generating data that’s not necessarily useful to answer the original, scientific, question. This begins to become interesting for the (contemporary) artist, for whom capturing ‘by accident’, organically, or unpredictably is very appealing. That’s not to say that capture in order to answer a question is not relevant in art, but rather that art and science often try to answer different kinds of questions, which warrant different approaches to capture.