Temporal Decay Slit-Scanner

Objective:

To compress the decay of flowers into a single image using the slit-scan technique, creating a typology that visually reconstructs the process of decay over time.

I’ve always been fascinated by the passage of time and how we can visually represent it. Typically, slit-scan photography is used to capture fast motion, often with quirky or distorted effects. My goal, however, was to adapt this technique for a slower process—decay. By using a slit-scan on time-lapse footage, each “slit” represents a longer period, and when compiled together, they reconstruct an object as it changes over time.

Process

Why Flowers?
I chose flowers as my subject because their relatively short lifespan makes them ideal for capturing visible transformations within a short period. Their shape and contour changes as they decay fit perfectly with my goal to visualize time through decay. Initially, I considered using food but opted for flowers to avoid insect issues in my recording space.

Time-Lapse Filming
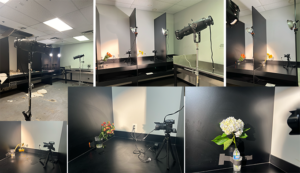
The setup required a stable environment with constant lighting, a still camera, and no interruptions. I found an unused room in an off-campus drama building, which was perfect as it had once been a dark room. The ceiling had collapsed in the spring, so it’s rarely used, ensuring my setup could remain undisturbed for days.

I used Panasonic G7s, which I sourced from the VMD department. These cameras have built-in time-lapse functionality, allowing me to customize the intervals. I connected the cameras to continuous power and set consistent settings across them—shutter speed, white balance, etc.

The cameras were set to take a picture every 15 minutes over a 7-day period, resulting in 672 images. Not all recordings were perfect, as some flowers shifted during the decay process.

Making Time-Lapse Videos

I imported the images into Adobe Premiere, set each image to a duration of 12 frames, and compiled them into a video at 24 frames per second. This frame rate and duration gave me flexibility in controlling the slit-scan speed. I shot the images in a 4:3 aspect ratio at 4K resolution but resized them to 1200×900 to match the canvas size.


Slit-Scan

Using Processing, I automated the slit-scan process. Special thanks to Golan for helping with the coding.

Key Variables in the Code:

  • nFramesToGrab: Controls the number of frames skipped before grabbing the next slit (set to 12 frames in this case, equating to 15 minutes).
  • sourceX: The starting X-coordinate in the video, determining where the slit is pulled from.
  • X: The position where the slit is drawn on the canvas.

For the first scan, I set the direction from right to left. As the X and sourceX coordinates decrease, the image is reconstructed from the decay sequence, with each slit representing a 15-minute interval in the flowers’ lifecycle. In this case, the final scan used approximately 3,144 frames, capturing about 131 hours of the flower’s decay over 5.5 days.

Slit-Scan Result:

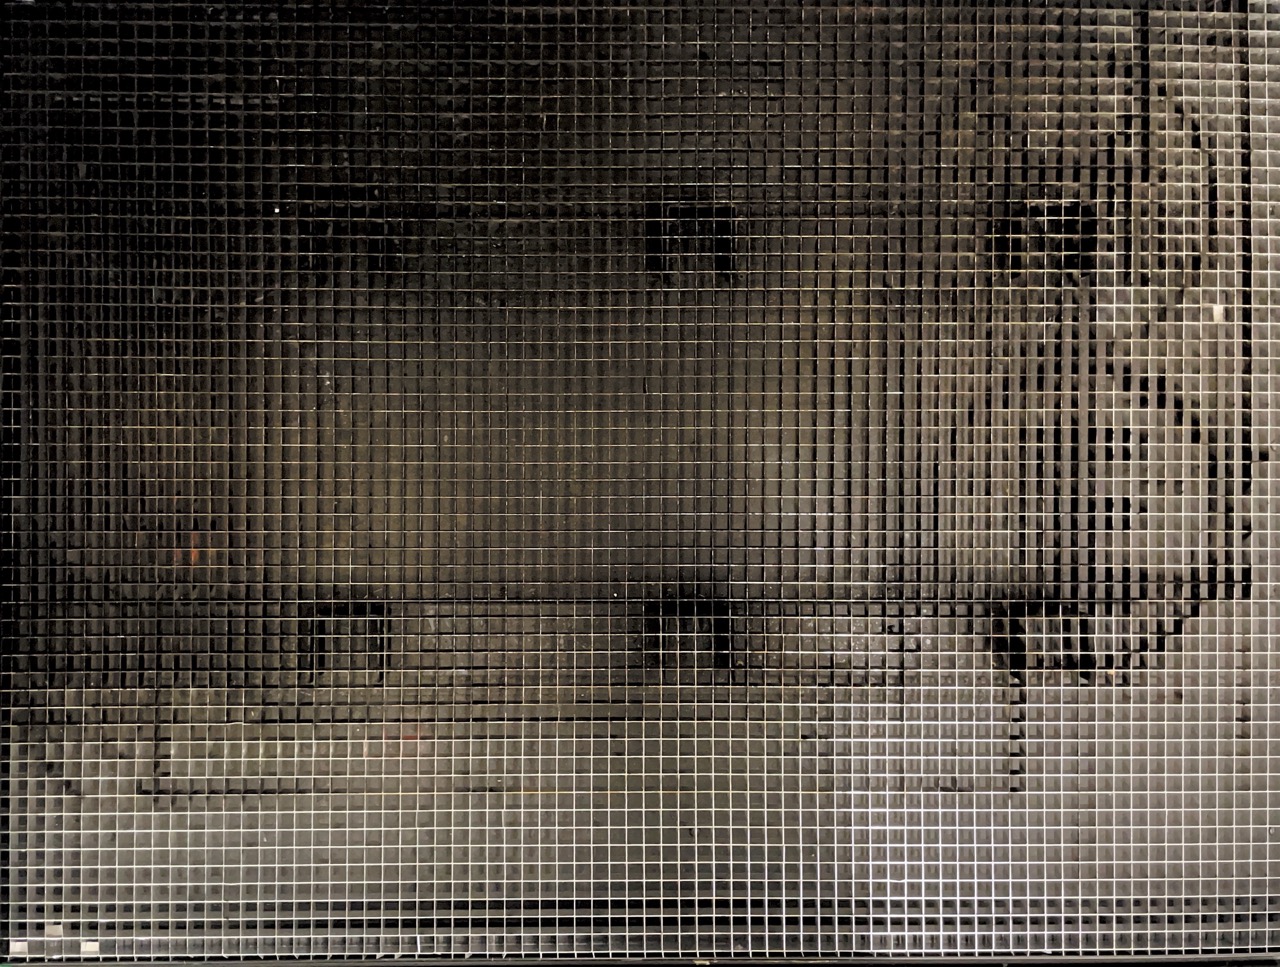
  • Hydrangea Right-to-Left: The scan proceeds from right to left, scaning a slit everying 12 frames of the video, pulling a moment from the flower’s decay. The subtle, gradual transformation is captured in a single frame, offering a timeline of the flower’s life compressed into one image.

Expanding the Typology

I experimented with different scan directions and speeds to see how they changed the visual outcome. Beyond right-to-left scans, I tested left-to-right scans, as well as center-out scans, where the slits expand from the middle of the image toward the edges, creating new ways to compress time into form.

  • Hydrangea Left-to-Right with Scanning every 6 Frames

  • Hydrangea Center Out: This version creates a visual expansion from the flower’s center as it decays, offering an interesting play between symmetry and time. The top image is scanning in the speed of every 30 frames, and the bottom image is every 36 frames. We can also see the intersting comprision between different speed of scanning.
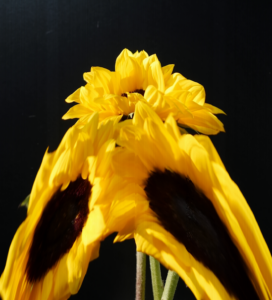
  • Sunflower Center Out/ every 30 frames
  • The sunflower fell off of the frame created this streching warping effects.

  • Roses Left-to-Right/ every 12 frames

  • Roses Right-to-Left/ every 18 frames
  • While filming the time-lapse for the roses, they gradually fell toward the camera over time. Due to limited space and lighting, I set up the camera with a shallow apparatus and didn’t expect the fell, which resulted in some blurry footage. However, I think this unintended blur adds a unique artistic quality to the final result.

Conclusion

By adjusting the scanning speed and direction, I was able to create a variety of effects, turning the decay process into a typology of time-compressed visuals. This method can be applied to any time-lapse video to reveal the subtle, gradual changes in the subject matter. Additionally, by incorporating a Y-coordinate, I could extend this typology even further, allowing for multidirectional scans or custom-shaped images.

One challenge was keeping the flowers in the same position for 7 days, as any movement would result in distortions during the scan. Finding the right scanning speed also took some experimentation—it depended heavily on the decay speed and the changes in the flowers’ shapes over time.

Despite these challenges, the slit-scan process succeeded in capturing a beautiful, visual timeline. It condenses time into a single frame, transforming the subtle decay of flowers into an artistic representation of life fading away. This project not only visualizes time but also reshapes it into a new typology—a series of compressed images that track the natural decay of organic forms.

Typology Machine: The White T-shirt Architecture

A white T-shirt is often seen as the most classic basic garment. But how “basic” is your basic white T-shirt? In my project, I explored the construction of “basic white tees” from various brands, examining them from an inside perspective. By capturing the volumetric surface area of the insides, I hoped to bring out the subtle uniqueness of these shirts from the differences in linings and looming methods to the placement of tags and the varying hues of “white.”

Final Project

Approach

Similarly to the studies of the insides of things,

“Architecture in Music” 

Lockey Hill Cello Circa 1780

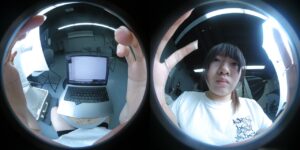
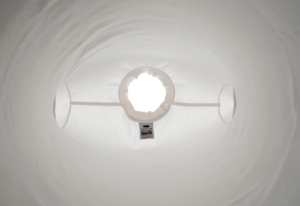
I used a 360-degree camera to get a fisheye perspective of the shirts and edited them to upload into a spherical viewer. This approach allowed an immersive navigable experience, giving you a feel of what it’s like to be inside these shirts and appreciate the details that set them apart.

Process

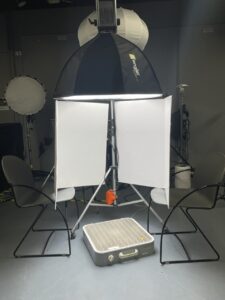
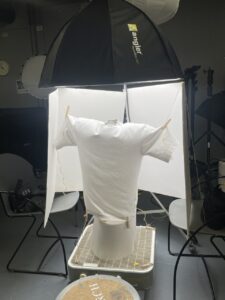
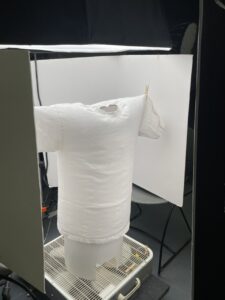
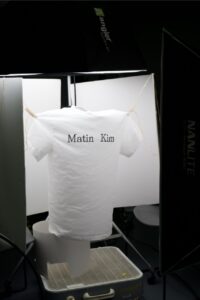
Setup: 1 Softbox, 1 Box Fan, 1 Chair dolly platform under the fan to allow airflow, 2 Foldable Panel Reflectors, 1 Rectangular Lightbox for more even light distribution, 2 chairs to set them up, some wooden clothespins, and string.  

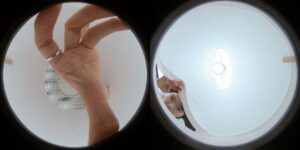
Mi Shpere 360 Camera Test Shot

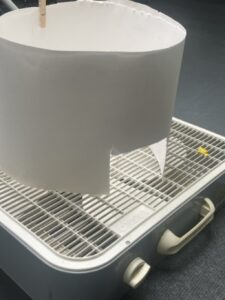
After a few adjustments, I made an expandable funnel with a cutout to direct airflow and allow access to manipulate the shirts.


360 Camera POV

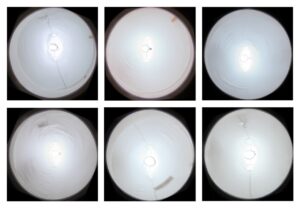
When the photos were taken I cropped and edited them in Photoshop.

Footages taken of UNIQLO, Levi’s, ProClub, Hurley, Matin Kim, and Mango.

I uploaded the edited images to a JavaScript-based tool that renders and allows interaction with 360° panoramic images. This enabled navigation through the insides of the shirts.

Finally, Leo helped me create an HTML website using GitHub Pages to host the images, allowing for simultaneous navigation of multiple shirts.

Draft using localhost portal

Browser website using GitHub Pages

Summary

By focusing on the inside of the garments, I highlighted the structural details that are often overlooked. The materials and construction techniques—whether from mass-produced or higher-end garments—show interesting contrasts. While expensive clothes may have finer finishes, the actual differences aren’t always as big as expected. It’s in the smaller details, like stitching and tag placement, where the craftsmanship, or lack of it, becomes most apparent.

Reflection

I enjoyed the literal process of “configuring the shirt inside out.” It was particularly interesting to examine the side seams and how some didn’t have them because it used a tubular looming method. It also expanded into narratives of the owners of the shirts (my friend in industrial design vs my friend in graphic design).

Something I would’ve done differently in my process is to use a DSLR with a fisheye lens because I noticed a lot of details were getting lost with the particular model of the 360 camera I used.

In the future, I think it would be cool to expand this project into a shopping website for white shirts or certain kinds of garments where the only visual information you will get is the inside of the shirts rather than the external appearance or branding. This concept challenges traditional consumer habits, pushing back against superficial buying trends and the impact of mass production. It encourages consumers to think more critically about the construction and quality of the items they purchase.

.
 

Hearing the things we can’t hear: Lightbulb Edition

I’m really interested in the phoneme around us that we can’t perceive as humans.  I was thinking a lot about how sound can create light, but the reverse isn’t possible. Ultrasonic frequencies are the bands of frequency that are beyond human hearing usually above 20-22khz. The frequencies captured in this project go between 0-196khz. I recorded various kinds of lightbulbs in many different places, with the ultrasonic microphone. Initially, I wanted to create a system that can capture and process the sounds of the lightbulb live, but due to technical limitations, I had to scale back the idea. I had to process each sample by hand; and focused instead on the automation of cataloguing the sounds using ffmpeg to create the spectrograms and final video of the images. If I had time, I would combine this with the audio samples to give a better display of the data, but it was too difficult as this was my first time working in bash.


Processing of audio – Filtering out audio beyond 20khz with a highpass filter and tuning down the audio by four octaves.

Google Folder of Files

.

People as Palettes: A Typology Machine

How much does your skin color vary across different parts of your body?

While most of us think of ourselves as having one consistent skin color, this typology machine aims to capture the subtle variations of skin tone within a single individual, creating abstract color portraits that highlight these differences.

I started this project by determining which areas of the body would be the focus for color data collection. To ensure comfort and encourage participation, I selected nine areas: the forehead, upper lip, lower lip, top of the ear (cartilage), earlobe, cheek, palm of the hand, and back of the hand. I also collected hair color data to include in the visuals.

I then constructed a ‘capture box’ equipped with an LED light and a webcam, with a small opening for participants to place their skin. This setup ensured standardized lighting conditions and a consistent distance from the camera. To avoid camera’s automatic adjustments to exposure and tint, I used webcam software that disabled color and lighting corrections, allowing me to capture raw and unfiltered skin tones.

Box building and light testing:

Next, I recruited 87 volunteers and asked each to have six photos taken that would allow me to capture the 9 specific color areas. The photos included front and back of their hands, forehead, ear, cheek, and mouth.

Once the images were collected, I developed an application to allow me to go through each photo, select a 10×10 pixel area and identified the corresponding body part. The color data was then averaged across the 100 pixels, labeled accordingly, and stored in a JSON file, organized by participant and skin location.

A snippet of the image labeling and color selection process:

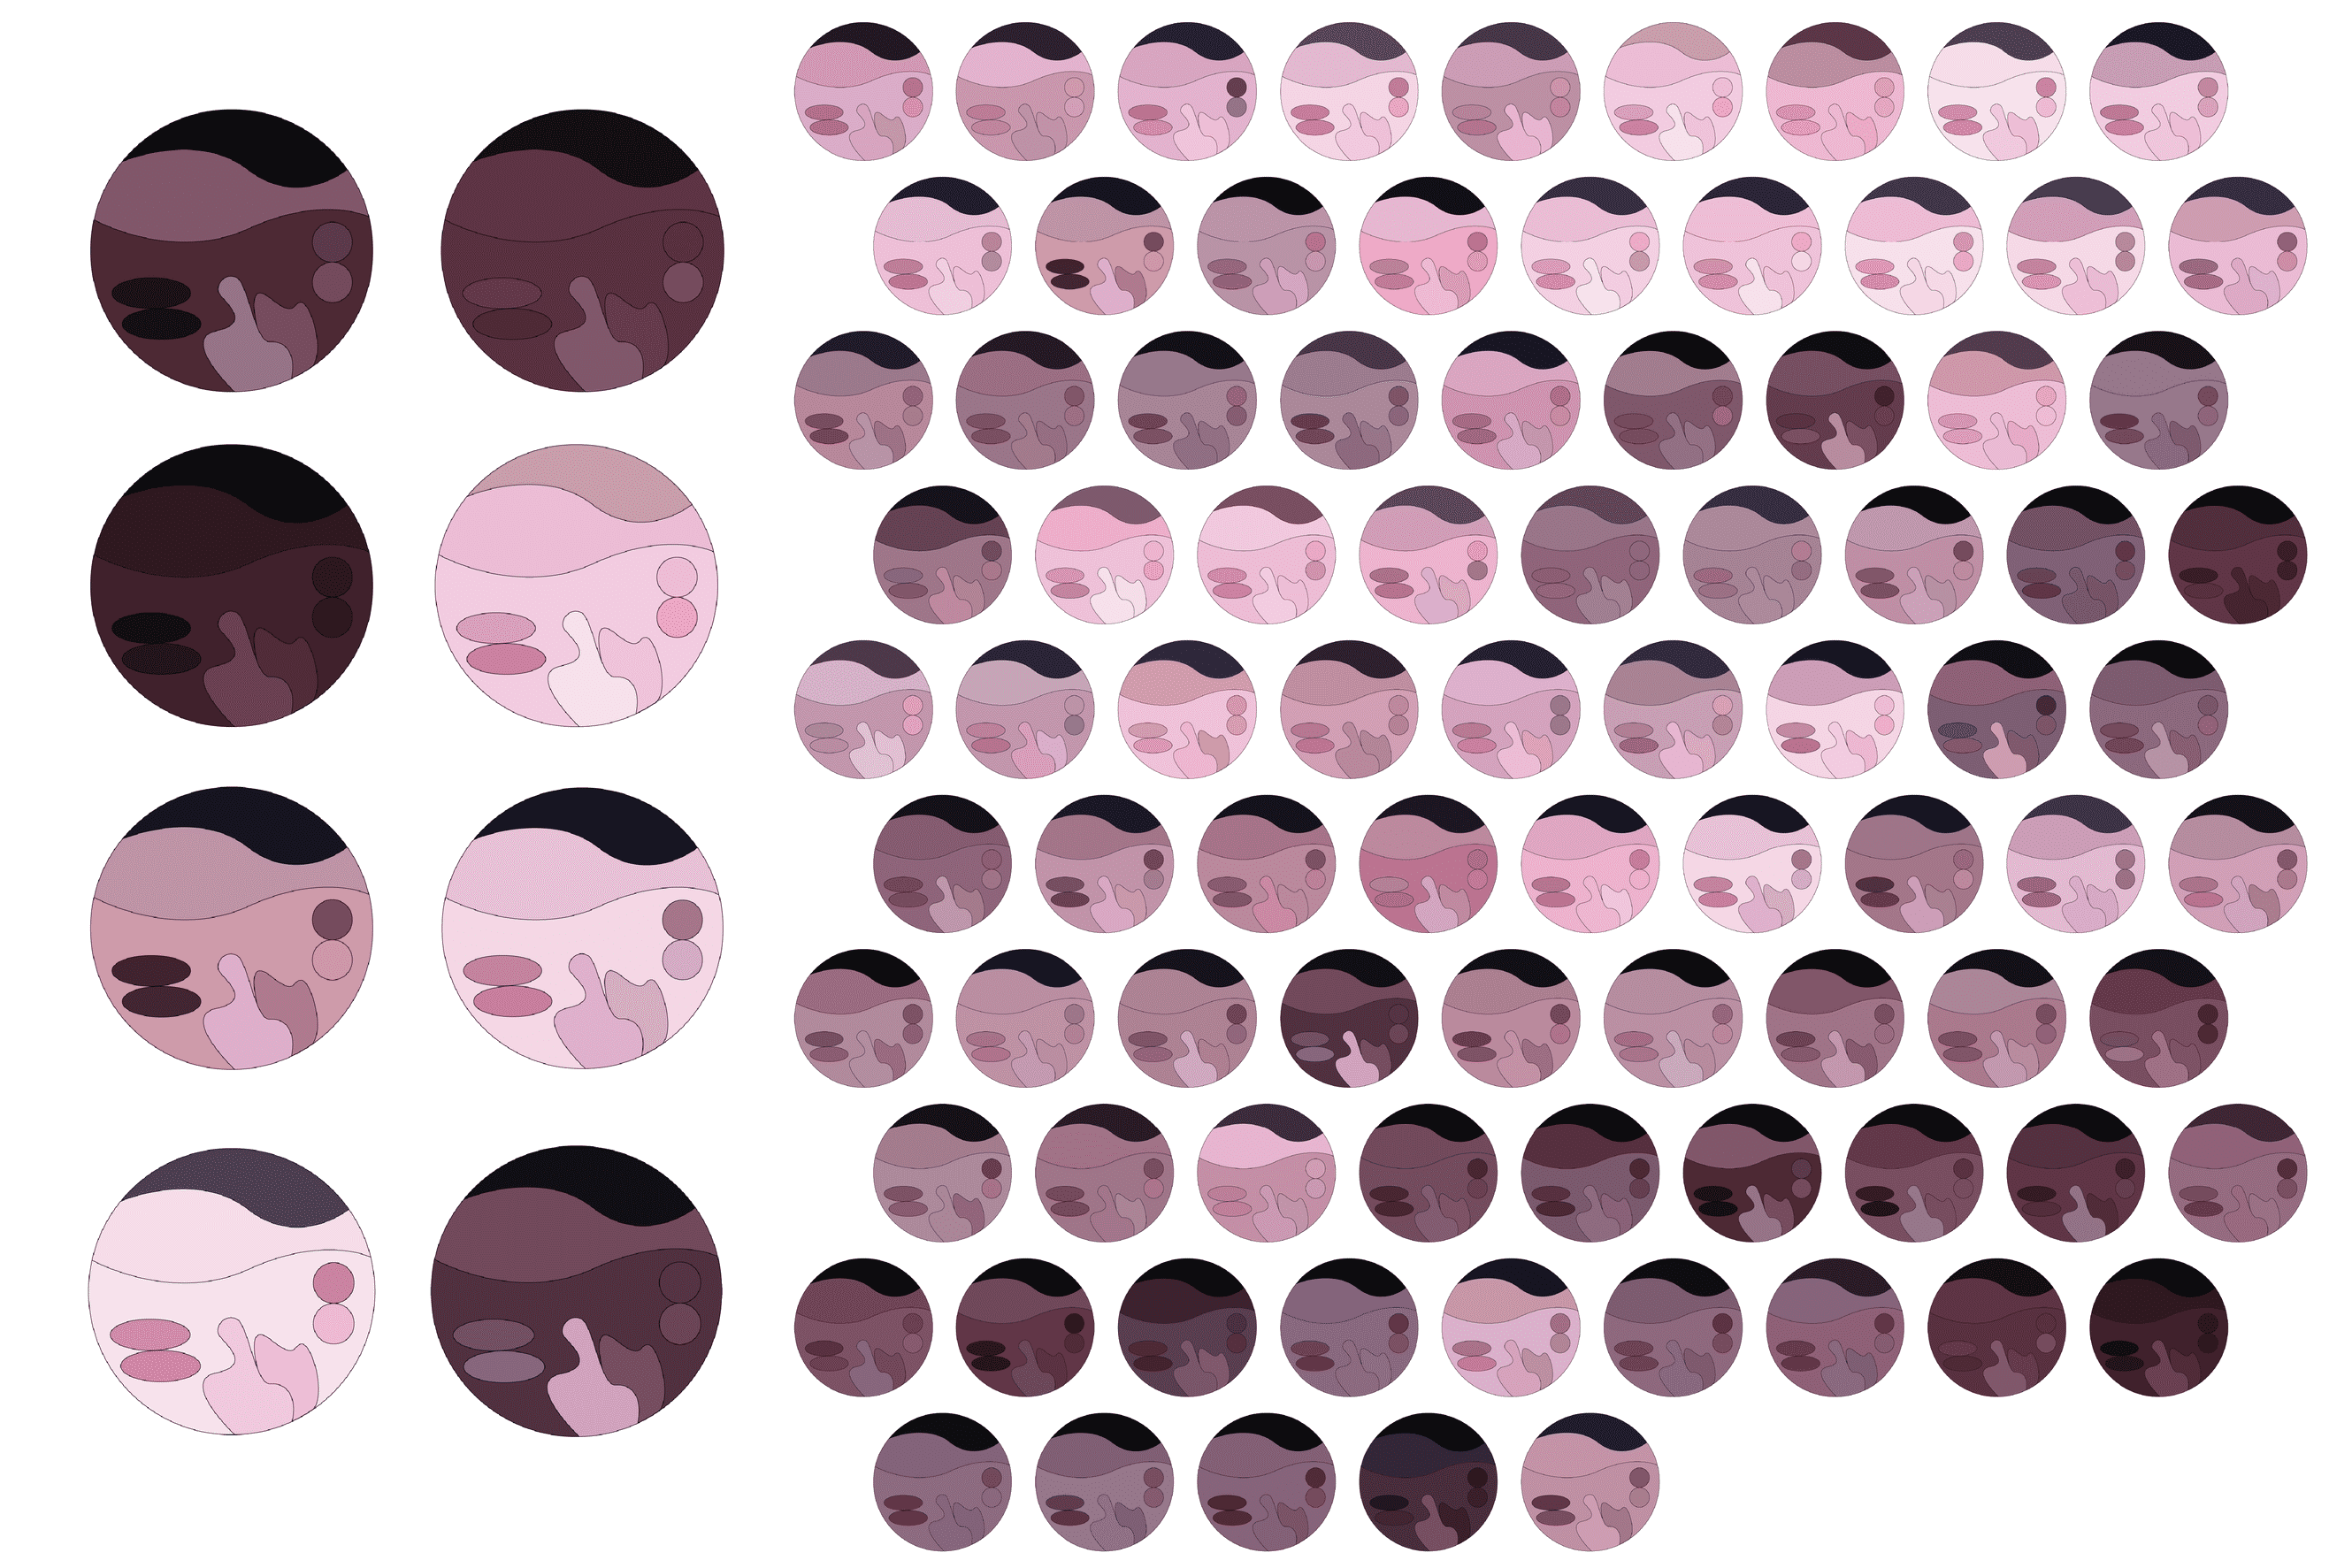
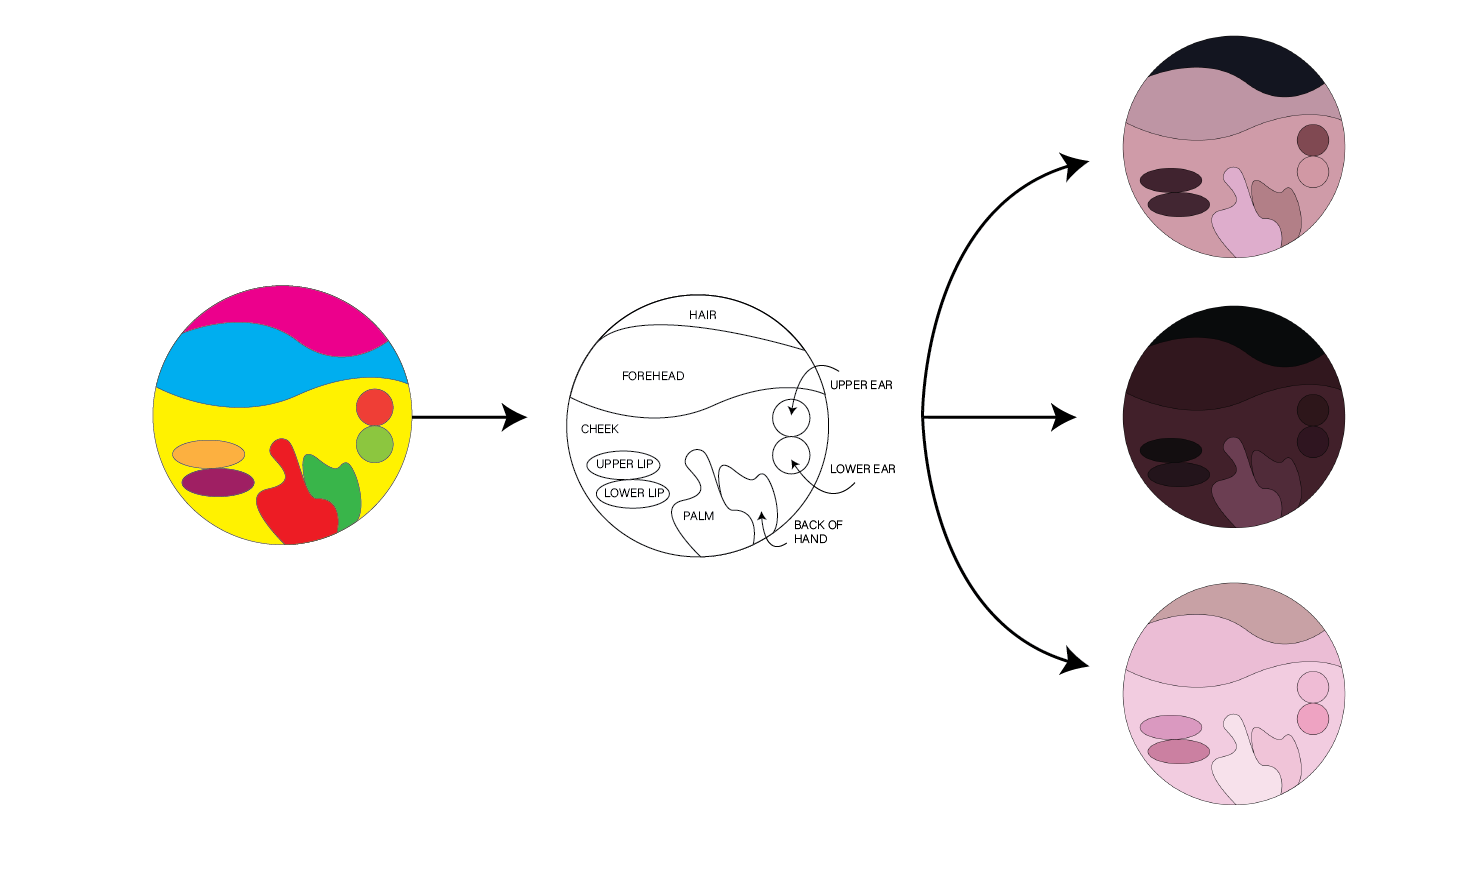
Using Adobe Illustrator, I wrote another script to map the captured color values into colors in an abstract designs, creating a unique image for each person.

The original shape in Adobe Illustrator and three examples of how the colors where mapped.

Overall, I’m pleased with the project’s outcome. The capture process was successful, and I gained valuable experience automating design workflows. While I didn’t have time to conduct a deeper analysis of the RGB data, the project has opened opportunities for further exploration, including examining patterns in the collected color data.

A grid-like visual representation of the entire dataset:

Typology of holes — addressing the unaddressed 

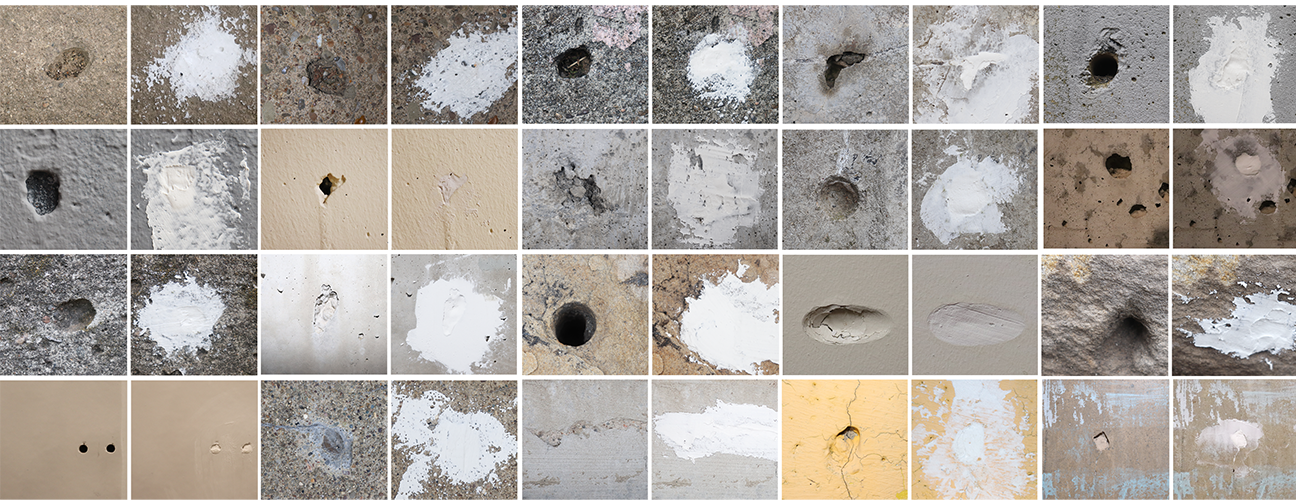
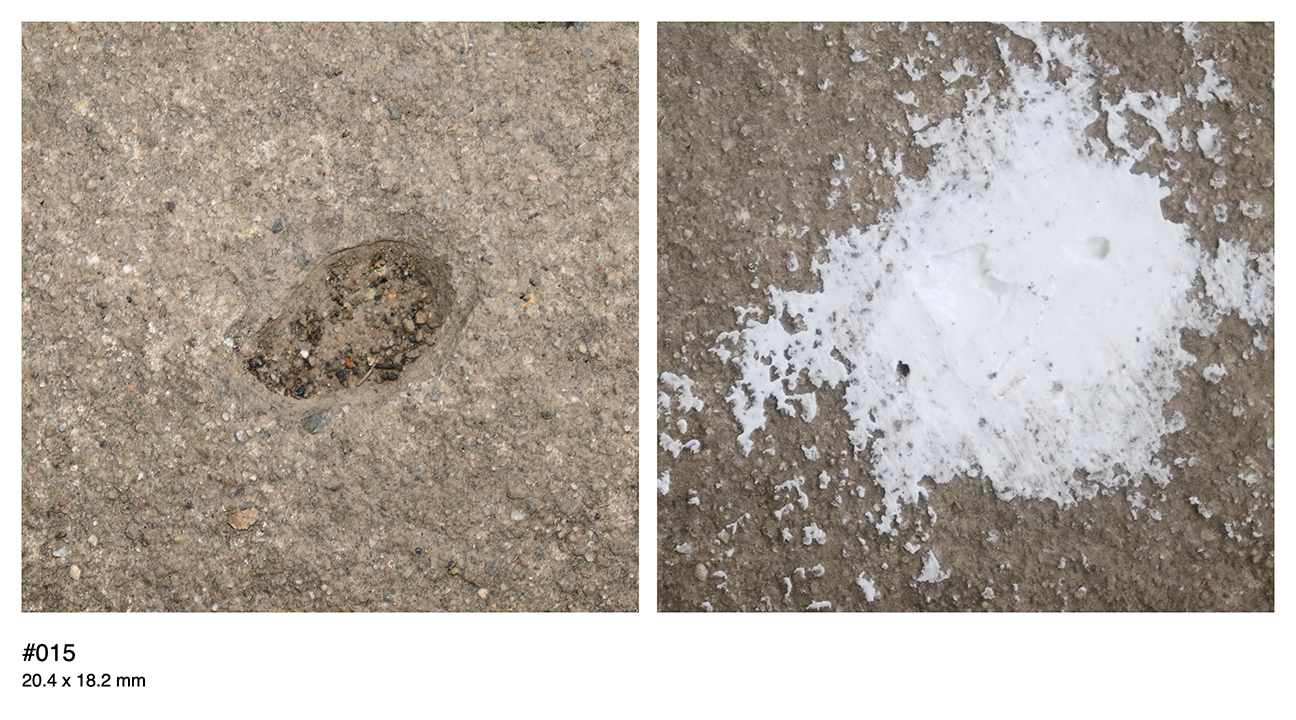
grid of some nicer holes

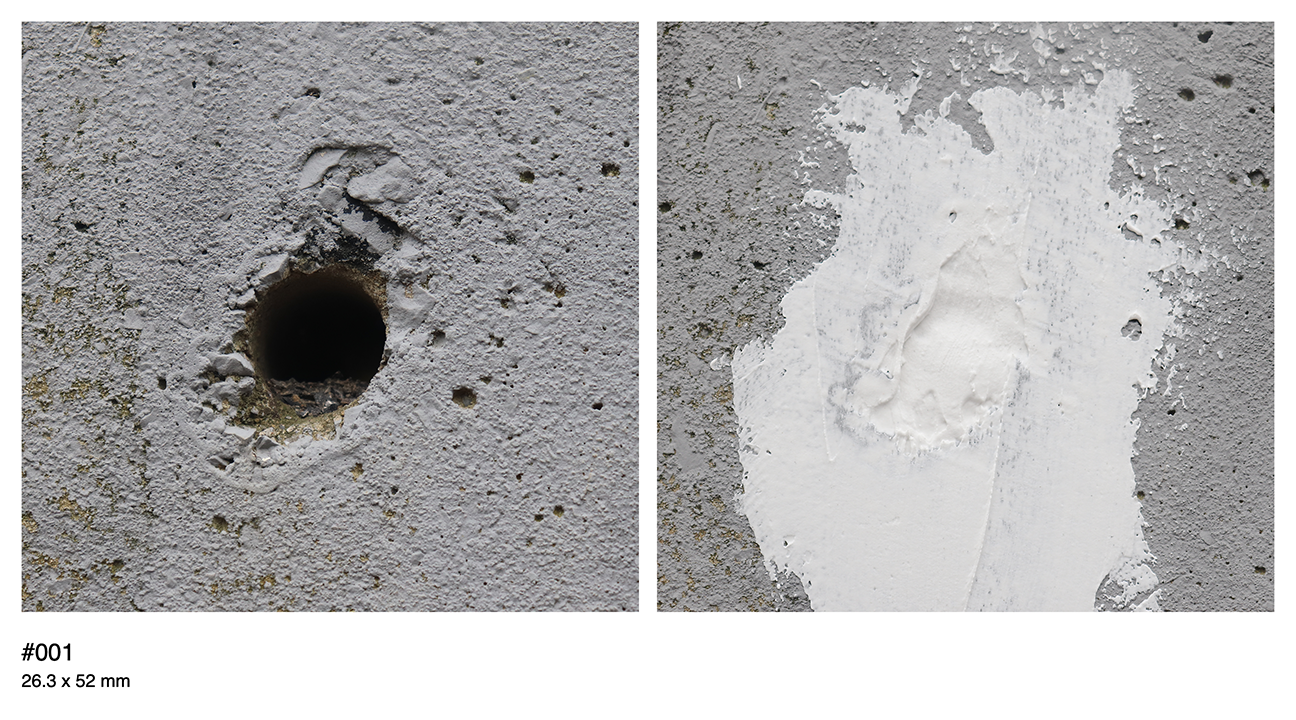
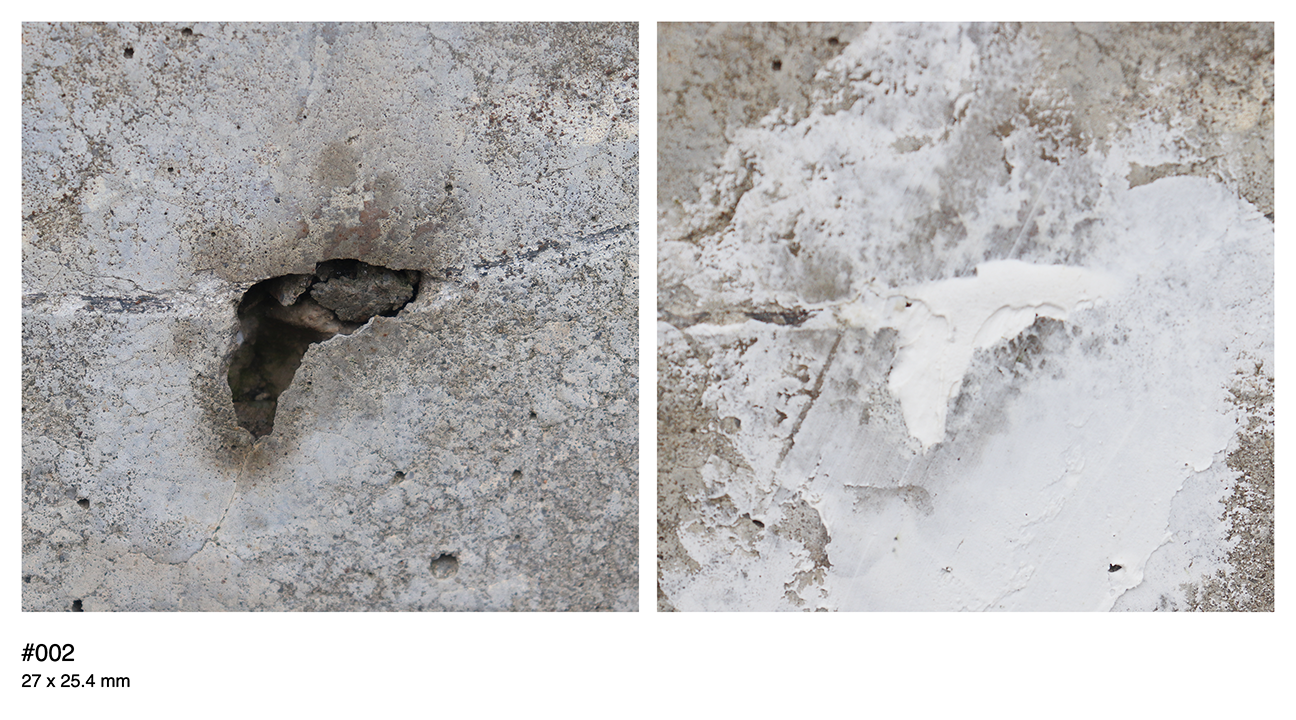
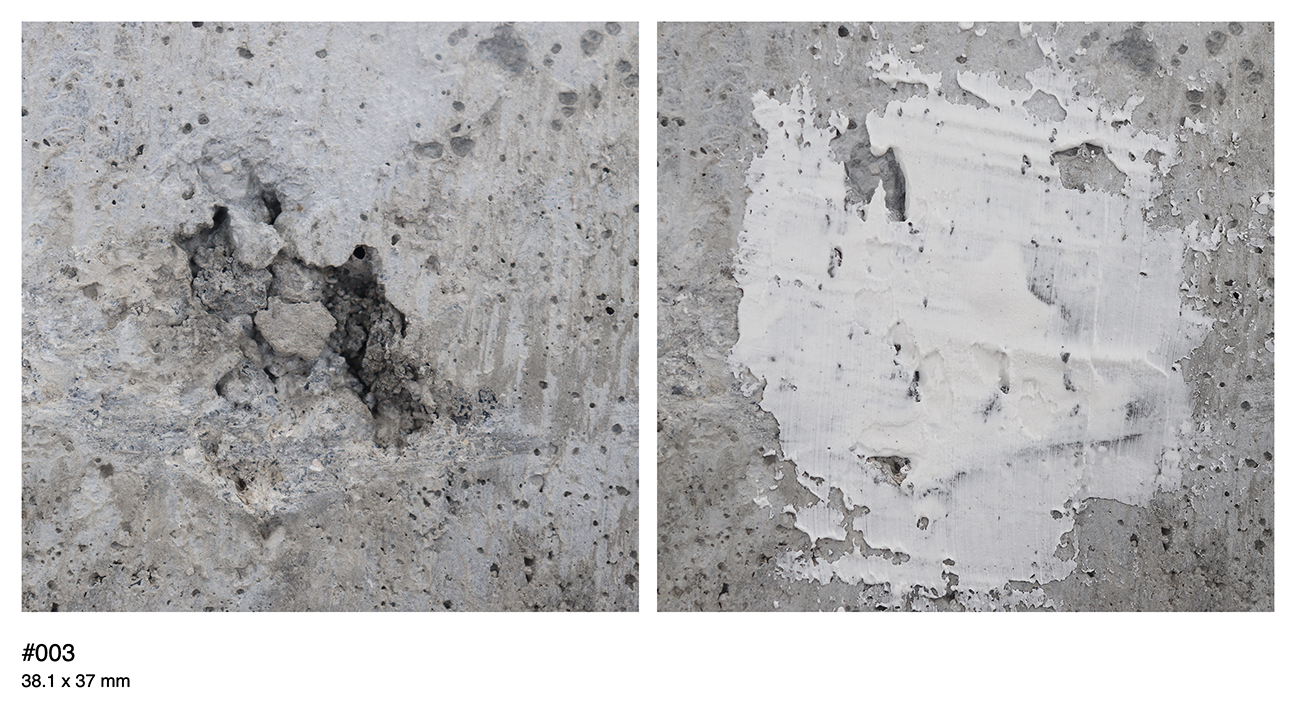
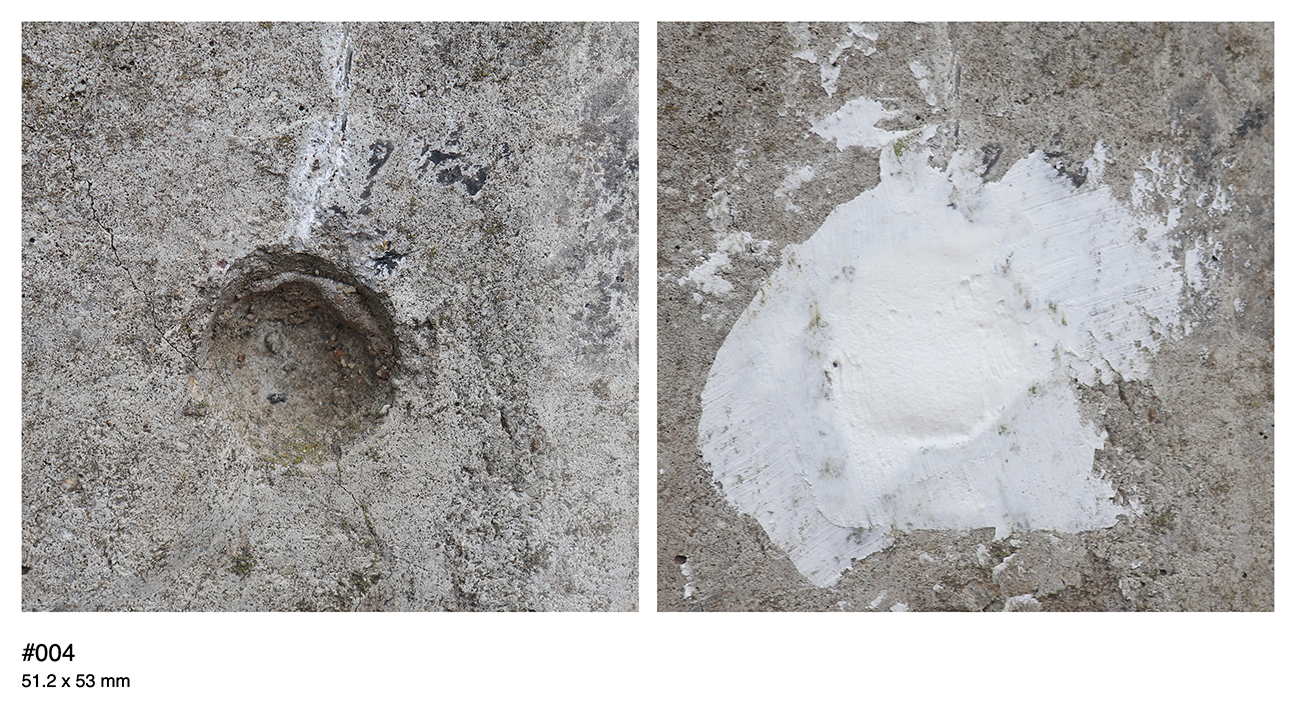
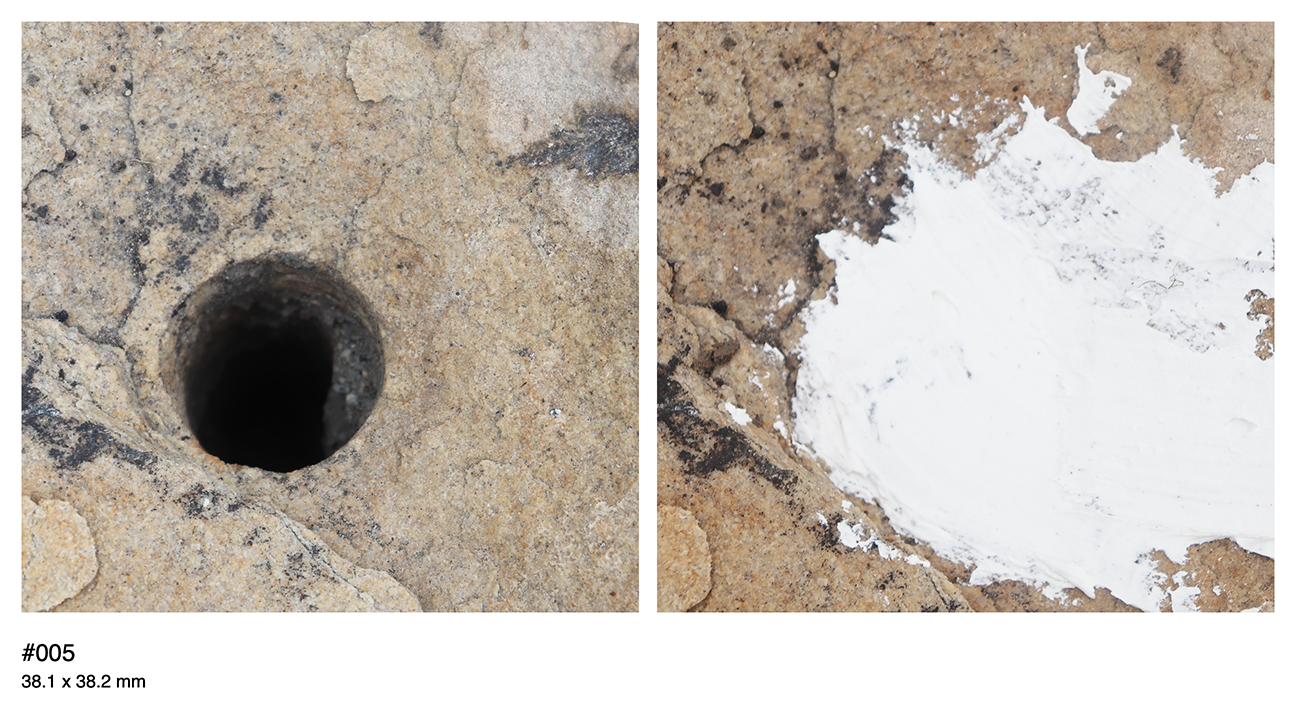
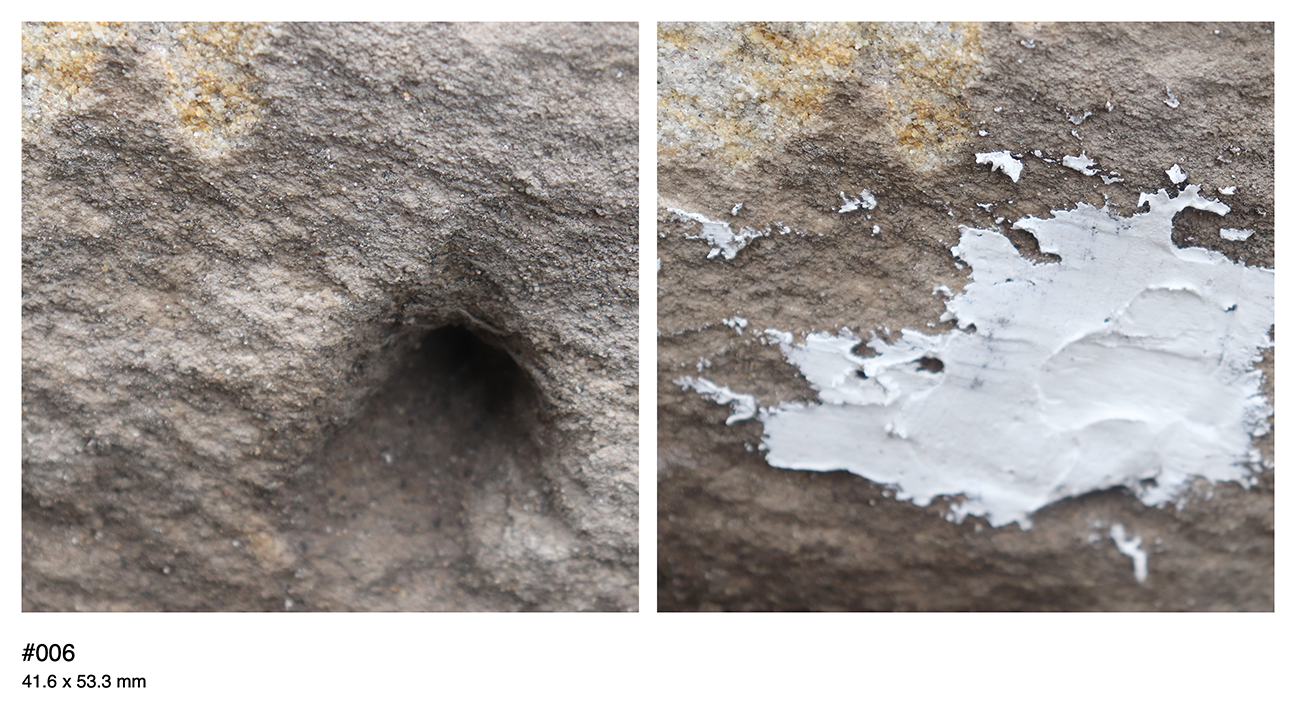
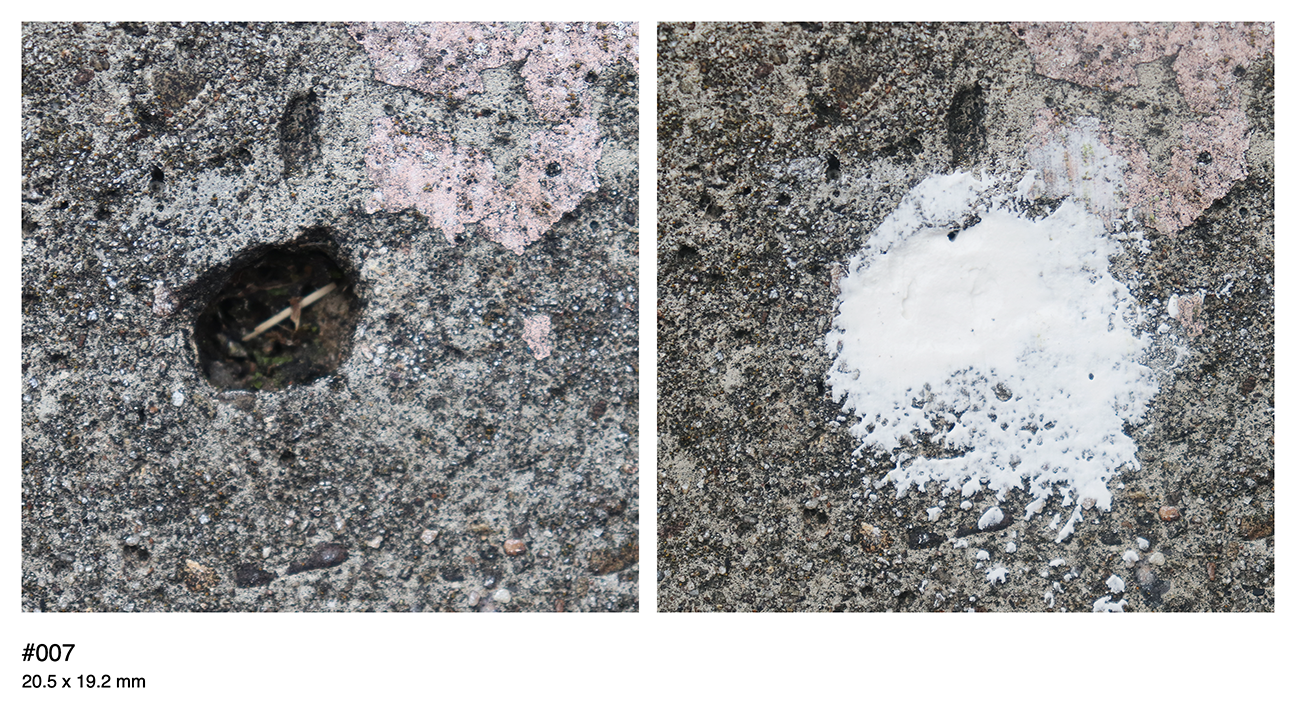
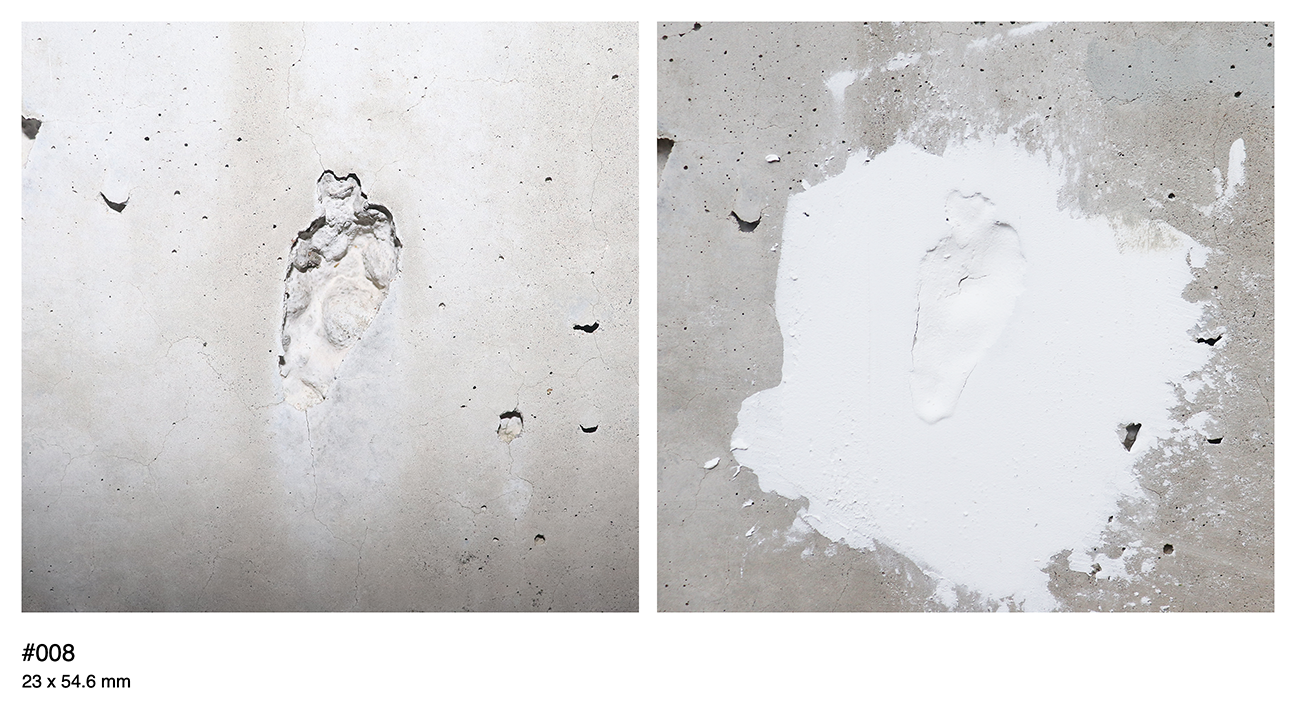
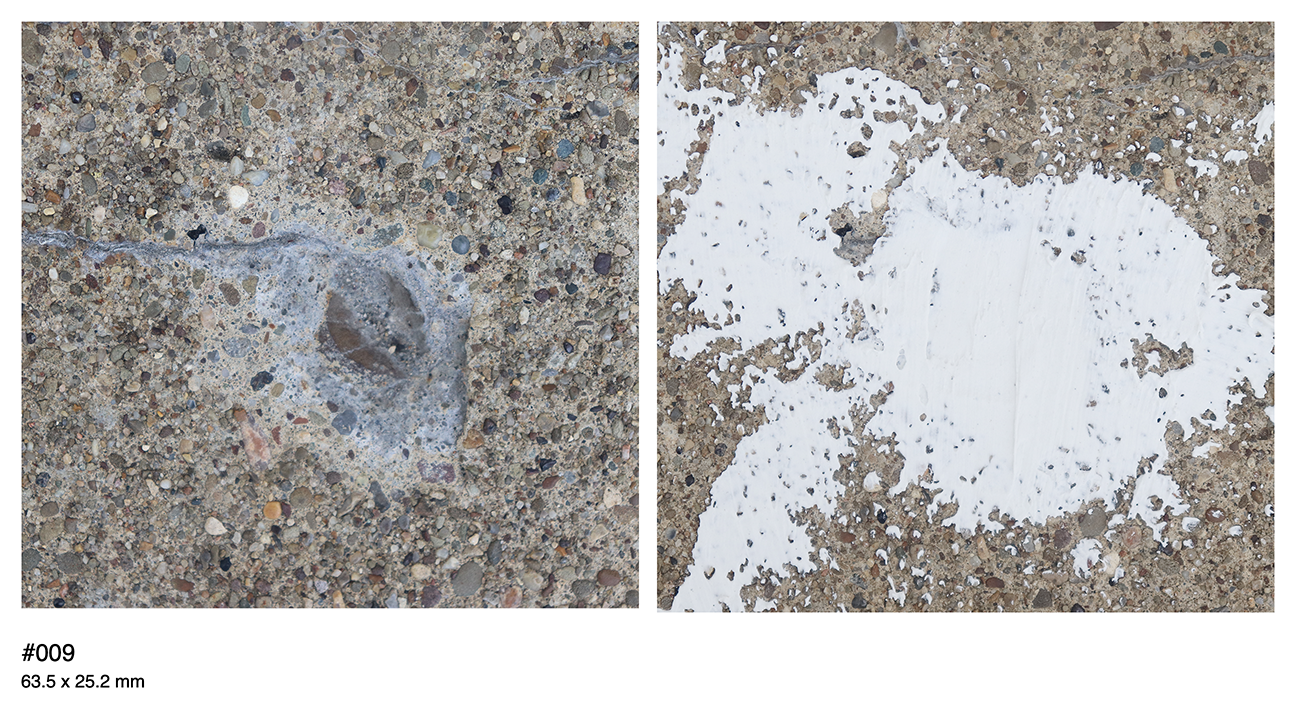
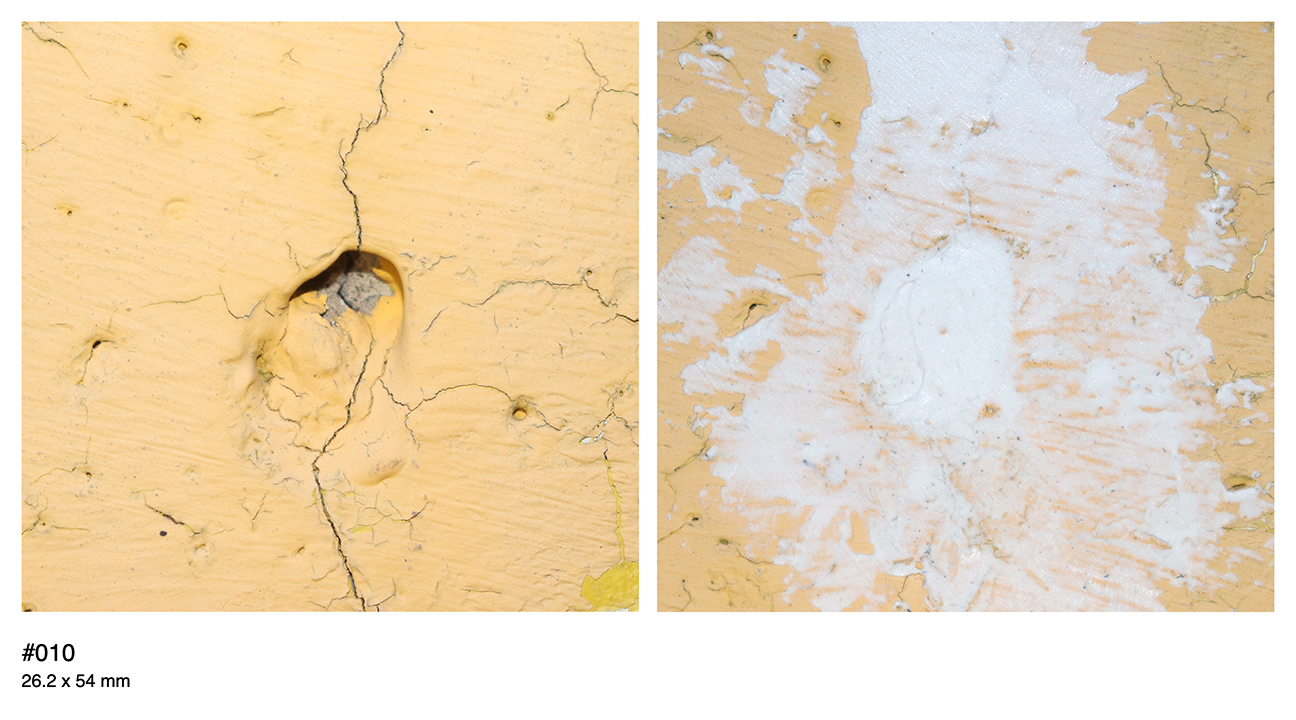
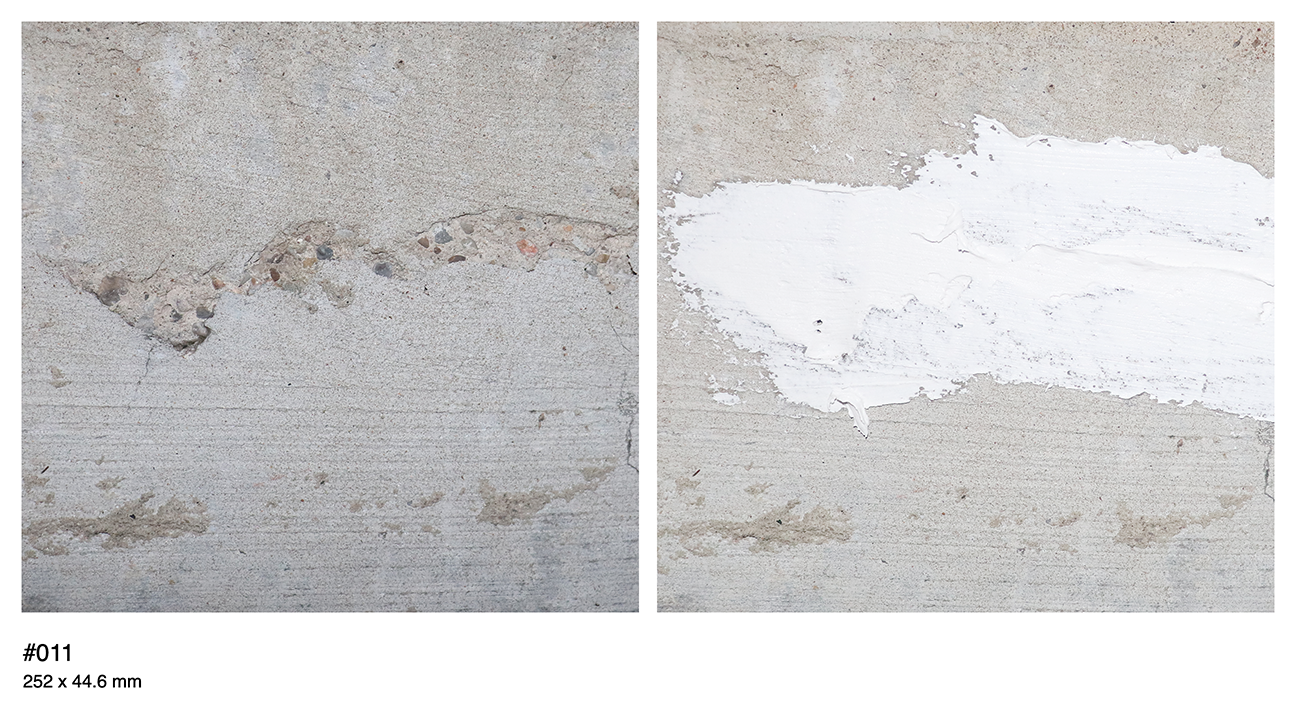
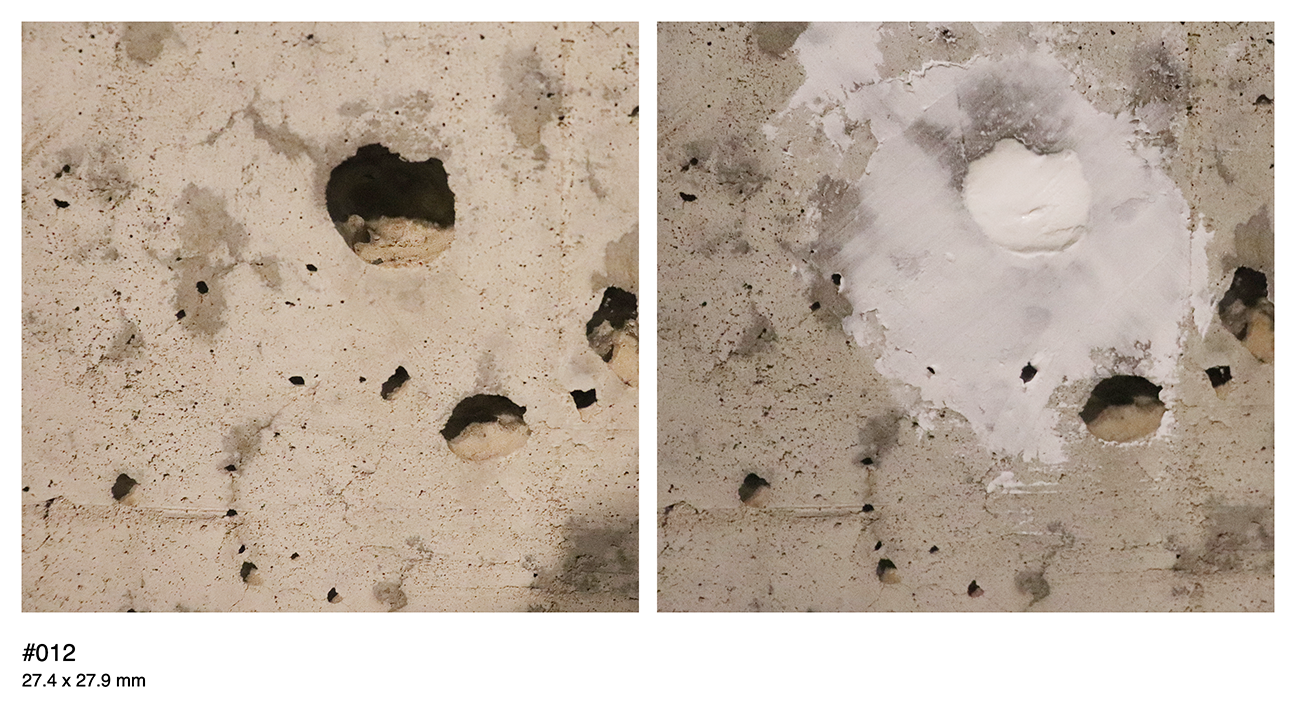
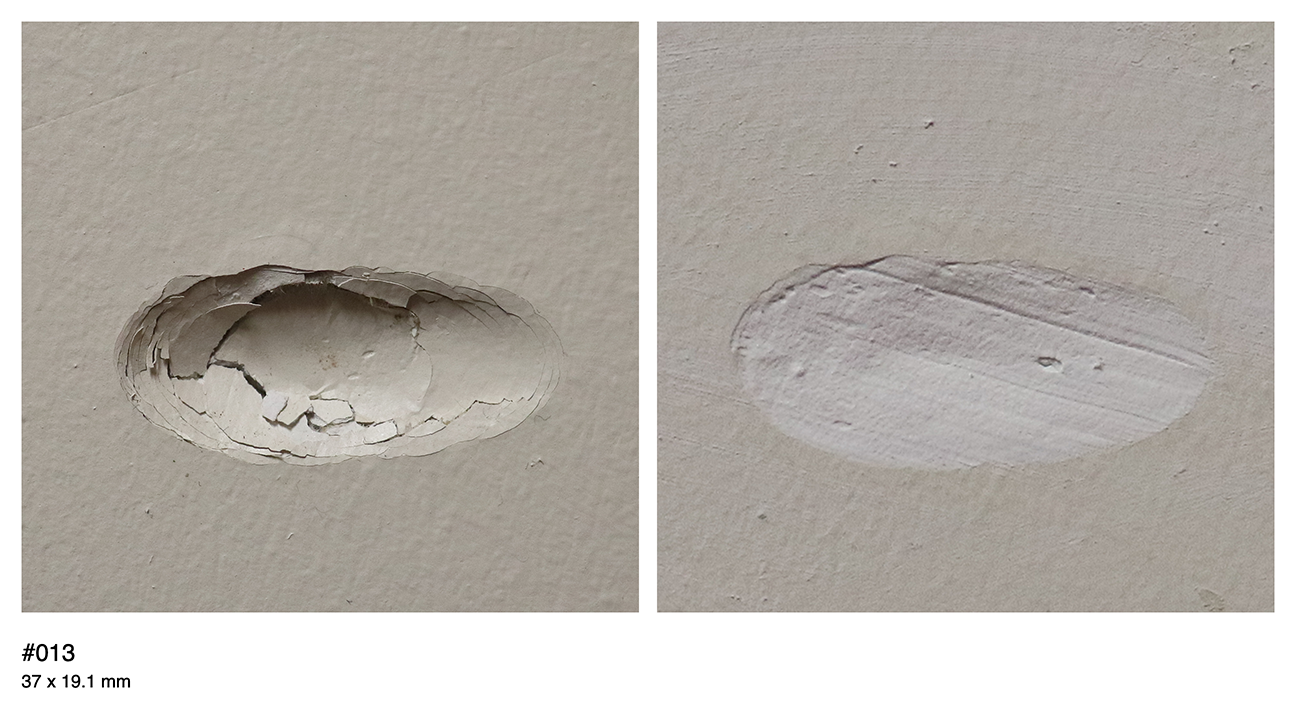
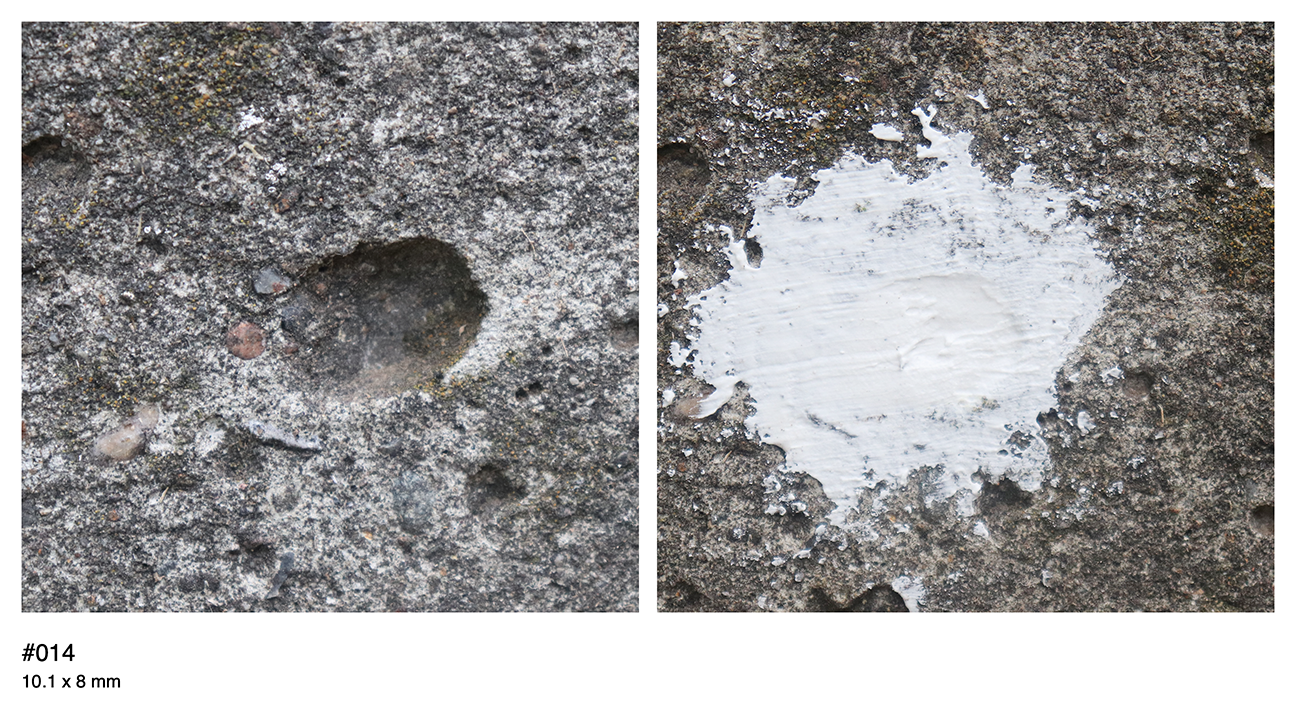
My goal with this project was to find, document, and “fix” interesting holes.

My inspiration was essentially that I had a compulsion to document holes and a compulsion to fill them after that idea was proposed. I was also interested in the idea of capturing very small or unimpressive phenomena next to (I don’t want to type the word “juxtaposed,”) ideas around the movie Melancholia which involves planetary impact, and the act of real-life crater impact on earth sterilizing the local environment(s). I think all of this led to me considering this semi-literal typology machine as capturing something transcendent of the object alone. 

It is the typology of holes, but to me it’s more of a typology of the unadressed through the medium of holes.

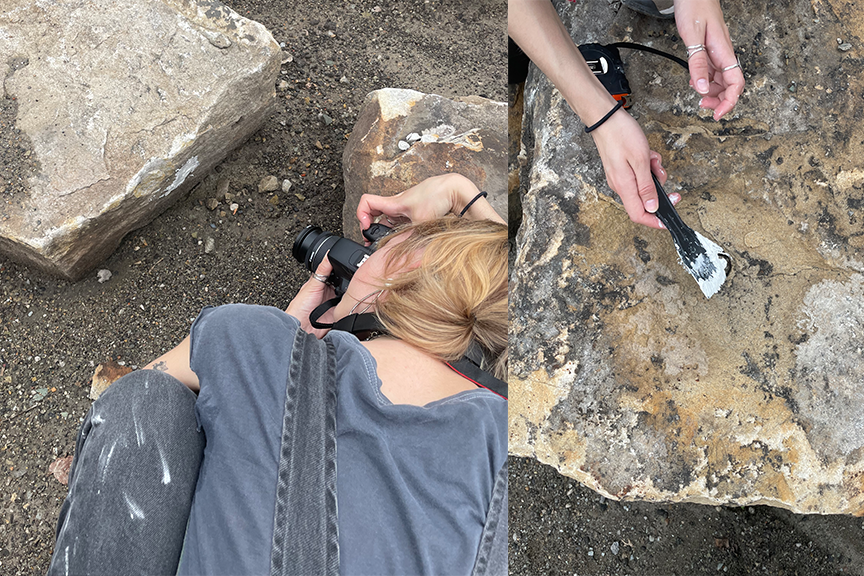
None of this was fleshed out at the beginning. It all started with just wanting to document holes. My process began with portable-scanning the holes. This was interesting to me because it flattened the image and produced more of a satellite photo effect, but I quickly realized I could not fill a hole and then drag a device that I can’t afford across wet spackle. This project also involved a lot of back-and-forth and it became increasingly hard to backtrack my process if I were to look for them after the spackle dried. Some scanned photos below:::

I moved to DSLR and the minute-ness of the holes. Although the loss of scale that occurs with the portable scanner is interesting, I realized that even with a normal camera and measurements below the photos, the holes kind of transcend those bounds.

This was my machine:

I was looking for holes that met my requirements. Ideally they were on a hard surface like stone or a plaster wall, as that implies the motion of impact or something acting on the surface — even if that act is occuring over a large amount of time– more than something that can occur gently (hole in a patch of mud may not imply “impact” as much)

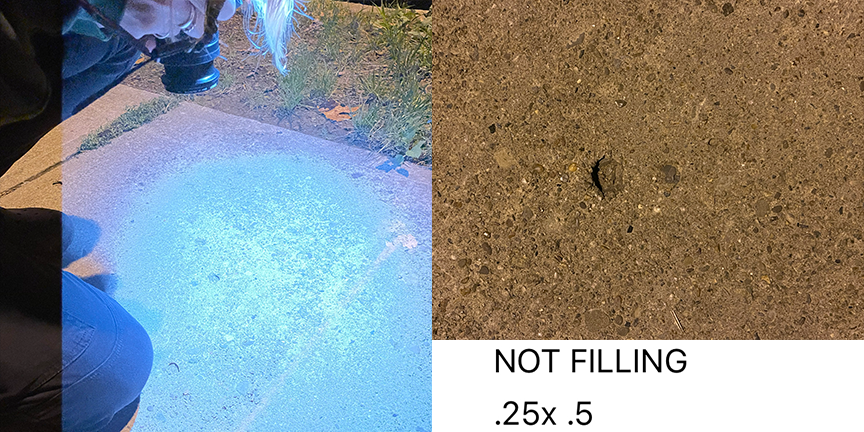
Upon finding a hole I took down measurements, coordinates, an iPhone photo to keep track of which hole I was referencing, and before and after photos with the DSLR camera. Initially the holes were going to literally be tagged, but I quickly dropped this as I found it ugly and overly intrusive.

There is still one somewhere and certainly not on an institutional property so if you see that one… feel free to sticker it up until I can get back to it and paint over the location tag.

More figuring out the process photos:

Overall this was really time consuming as I was logging much more information than what I ended up using and all of that information had to be stored in a manner that made it accessible to me later in the process. It’s also hard to find interesting holes on properties that aren’t clearly and visibly privately owned. I was trying to avoid any weird run-ins if possible. There was a lot of driving and walking (something like 20,000 steps on any given day I set aside to find holes.) I attempted to keep rags and paper towels on me to be able to continually clean the spackle knife, but ran through them faster than expected every time. Somehow no lesson was learned here.

The thing I ultimately focused on here is the meaning or lack of in these objects. Something I had spoken about early in the project is the ability to project on a hole. There is a fear or excitement factor around them of the unknown and there is a need to fix the “problem.”

Here is what holes say to me: Something unaddressed is here. 

My goal was to show that these holes exist and force you all to look at them… and for me to act on them while [attempting to] maintain the ignorance and versatility of a hole as an object. I’m sure the holes can stand alone without the act of me filling them, but I think there is something to be said for a “destructive” capture method. They are captured and can be found (shockingly my lightweight home depot spackle withstood the rain,) but I’m also not fully allowing anyone else to view them the way I did.

Here is a more selective curation of my favorites:

I don’t think this project is over. I would like to continue exploring this, it’s just a matter of that opportunity only arising again over a break when I have more free time. As kind of prefaced earlier, I’m not sure if I did the “””””right””” thing (as far as effectiveness of the project) by filling them and I don’t think any amount of external critique will clarify that internally. 

In the future I would like to return to scanning the holes, I would like to make stickers of the holes, I would like to take some extreme 200 mm+ macro photos of holes, etc…


Schenley Park Trail Typology

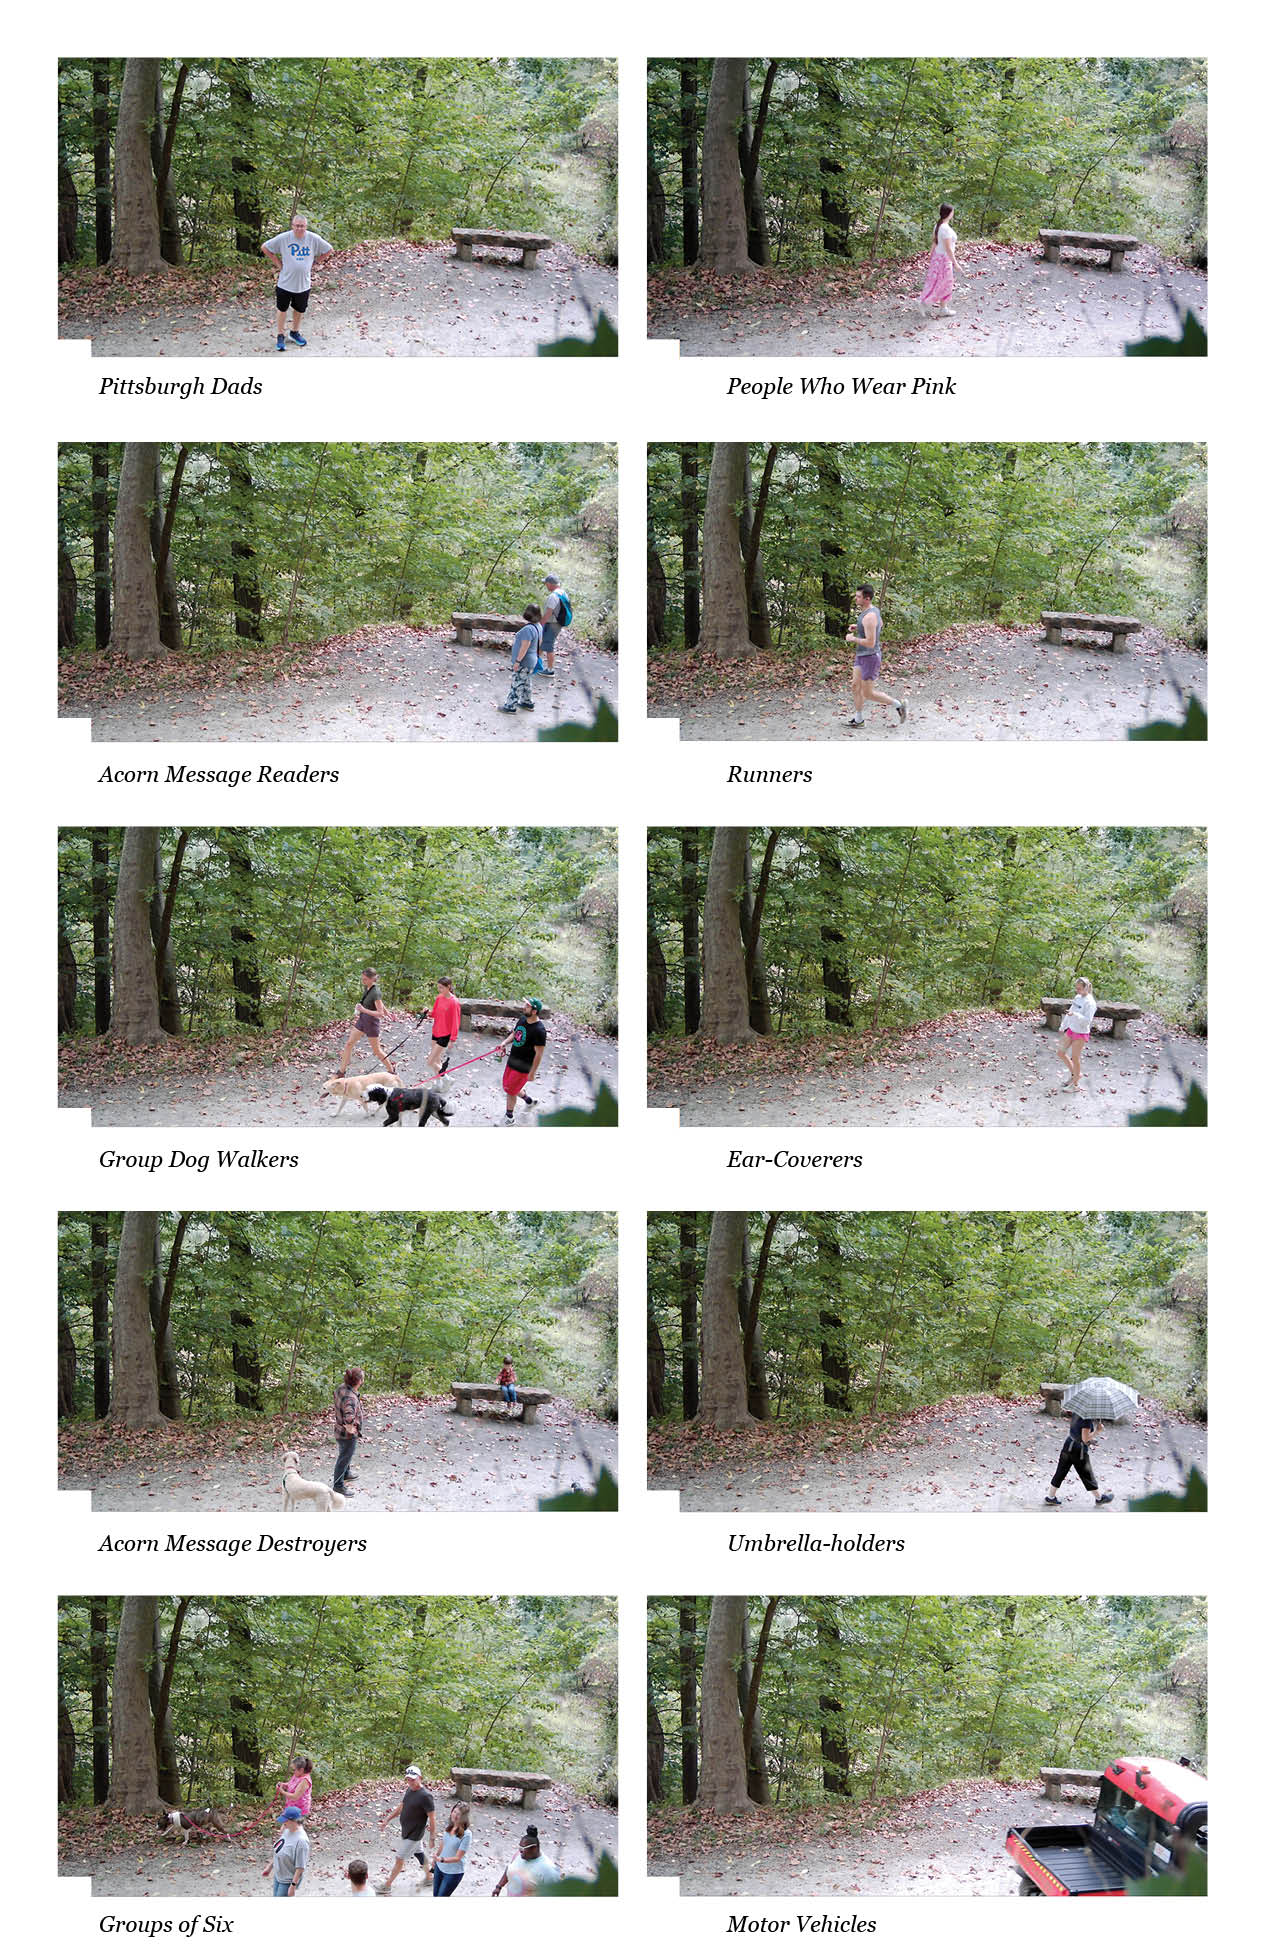
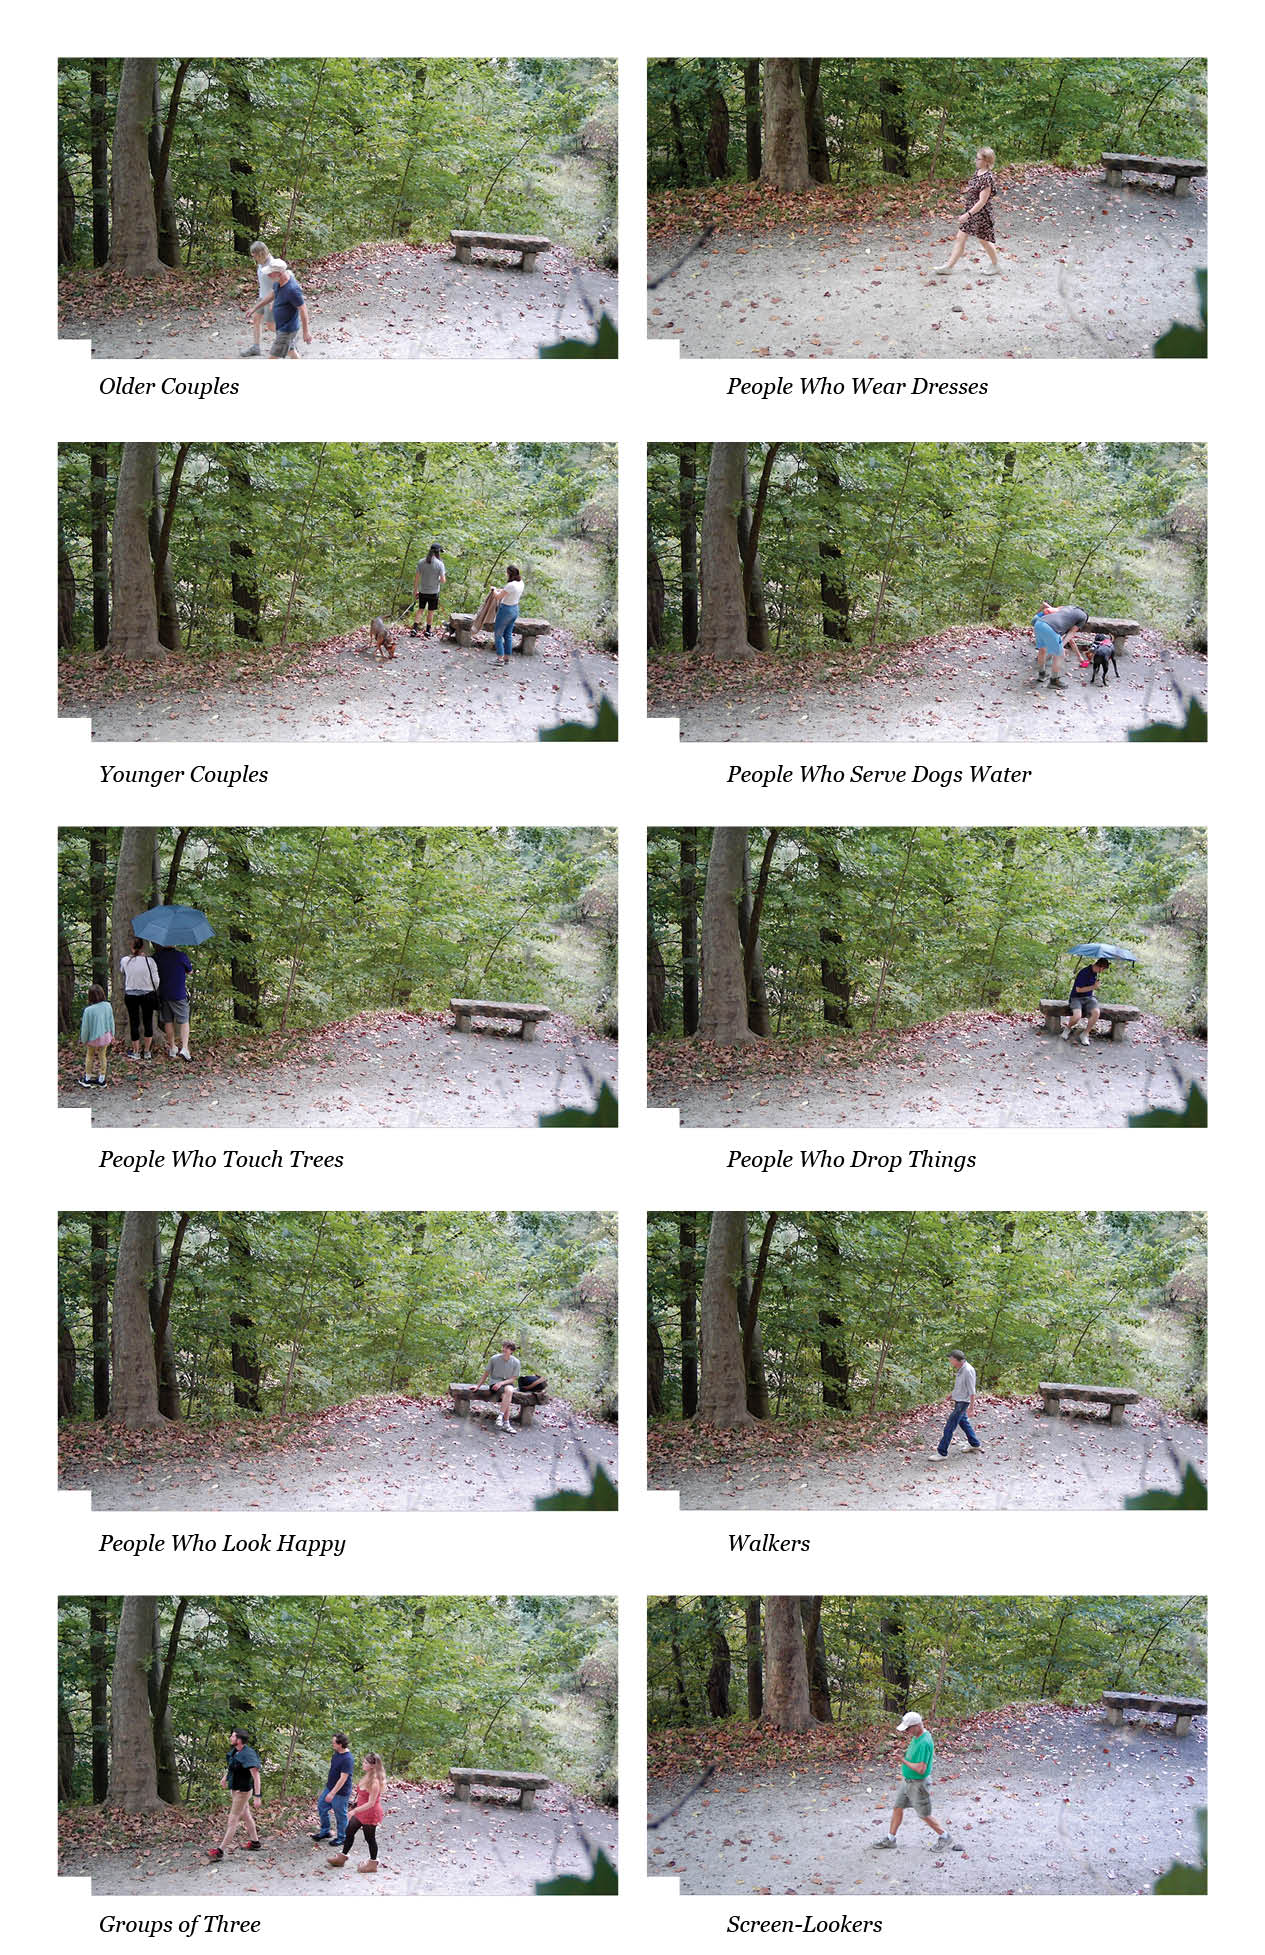
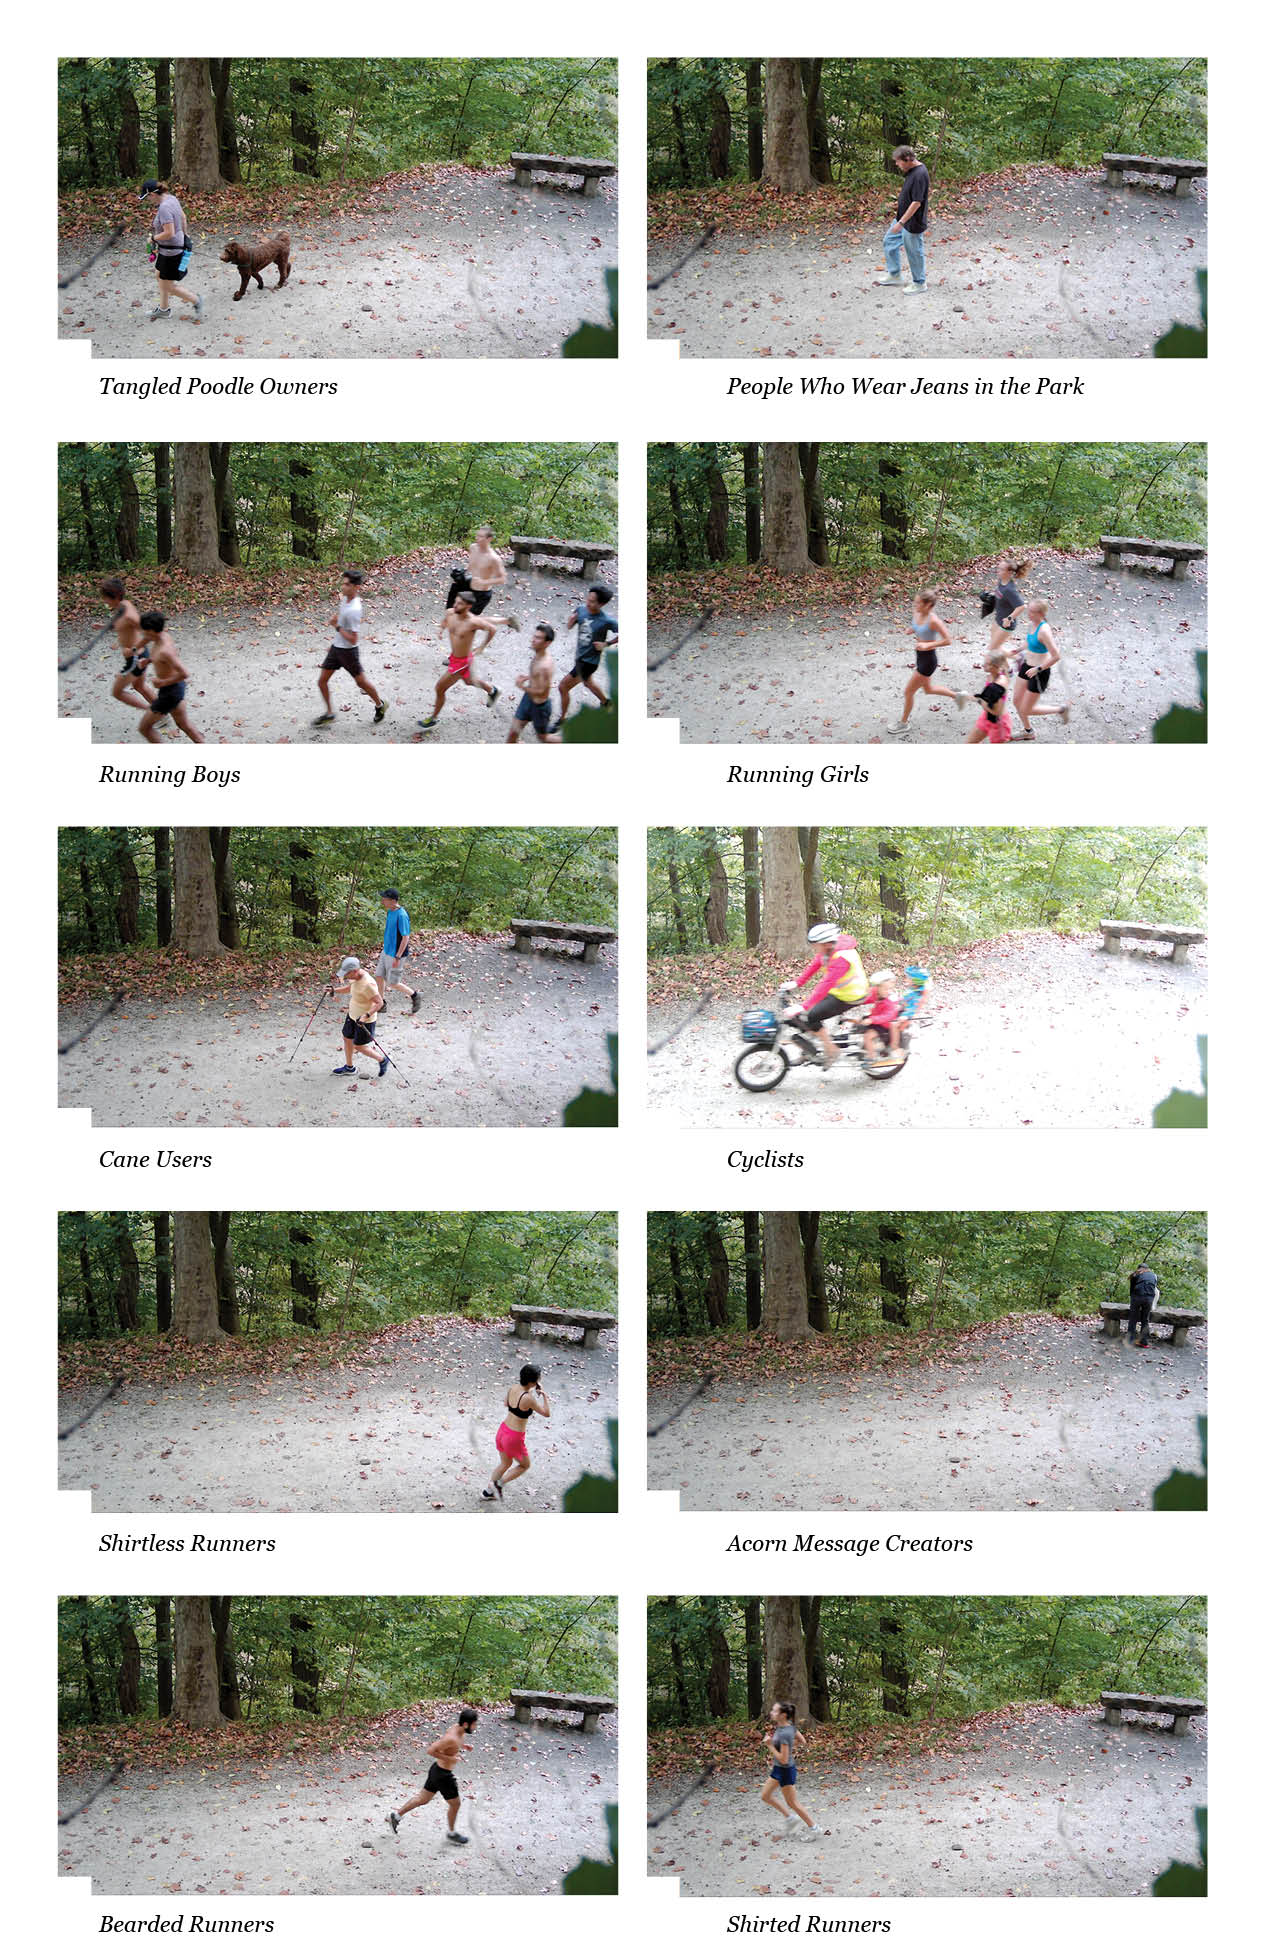
For our first ExCap project, I chose to make typology of actions that take place on a specific section of a trail in Schenley Park. I was interested in the various types of people, animals, and interactions that take place in this spot after once having noticed that someone left a laptop on the bench there and that there was a note on the bench the following day. Just for fun, I chose to present this in a parody nature documentary format. I had so much fun with this and wish to continue, improve and refine… this is as far as I could get for today.


Types of Schenley Trail Goers (video footage is not exhaustive)

In setting up this trail capture system, I had many highs and lows. Below is a log of my travails.

Friday, September 27th

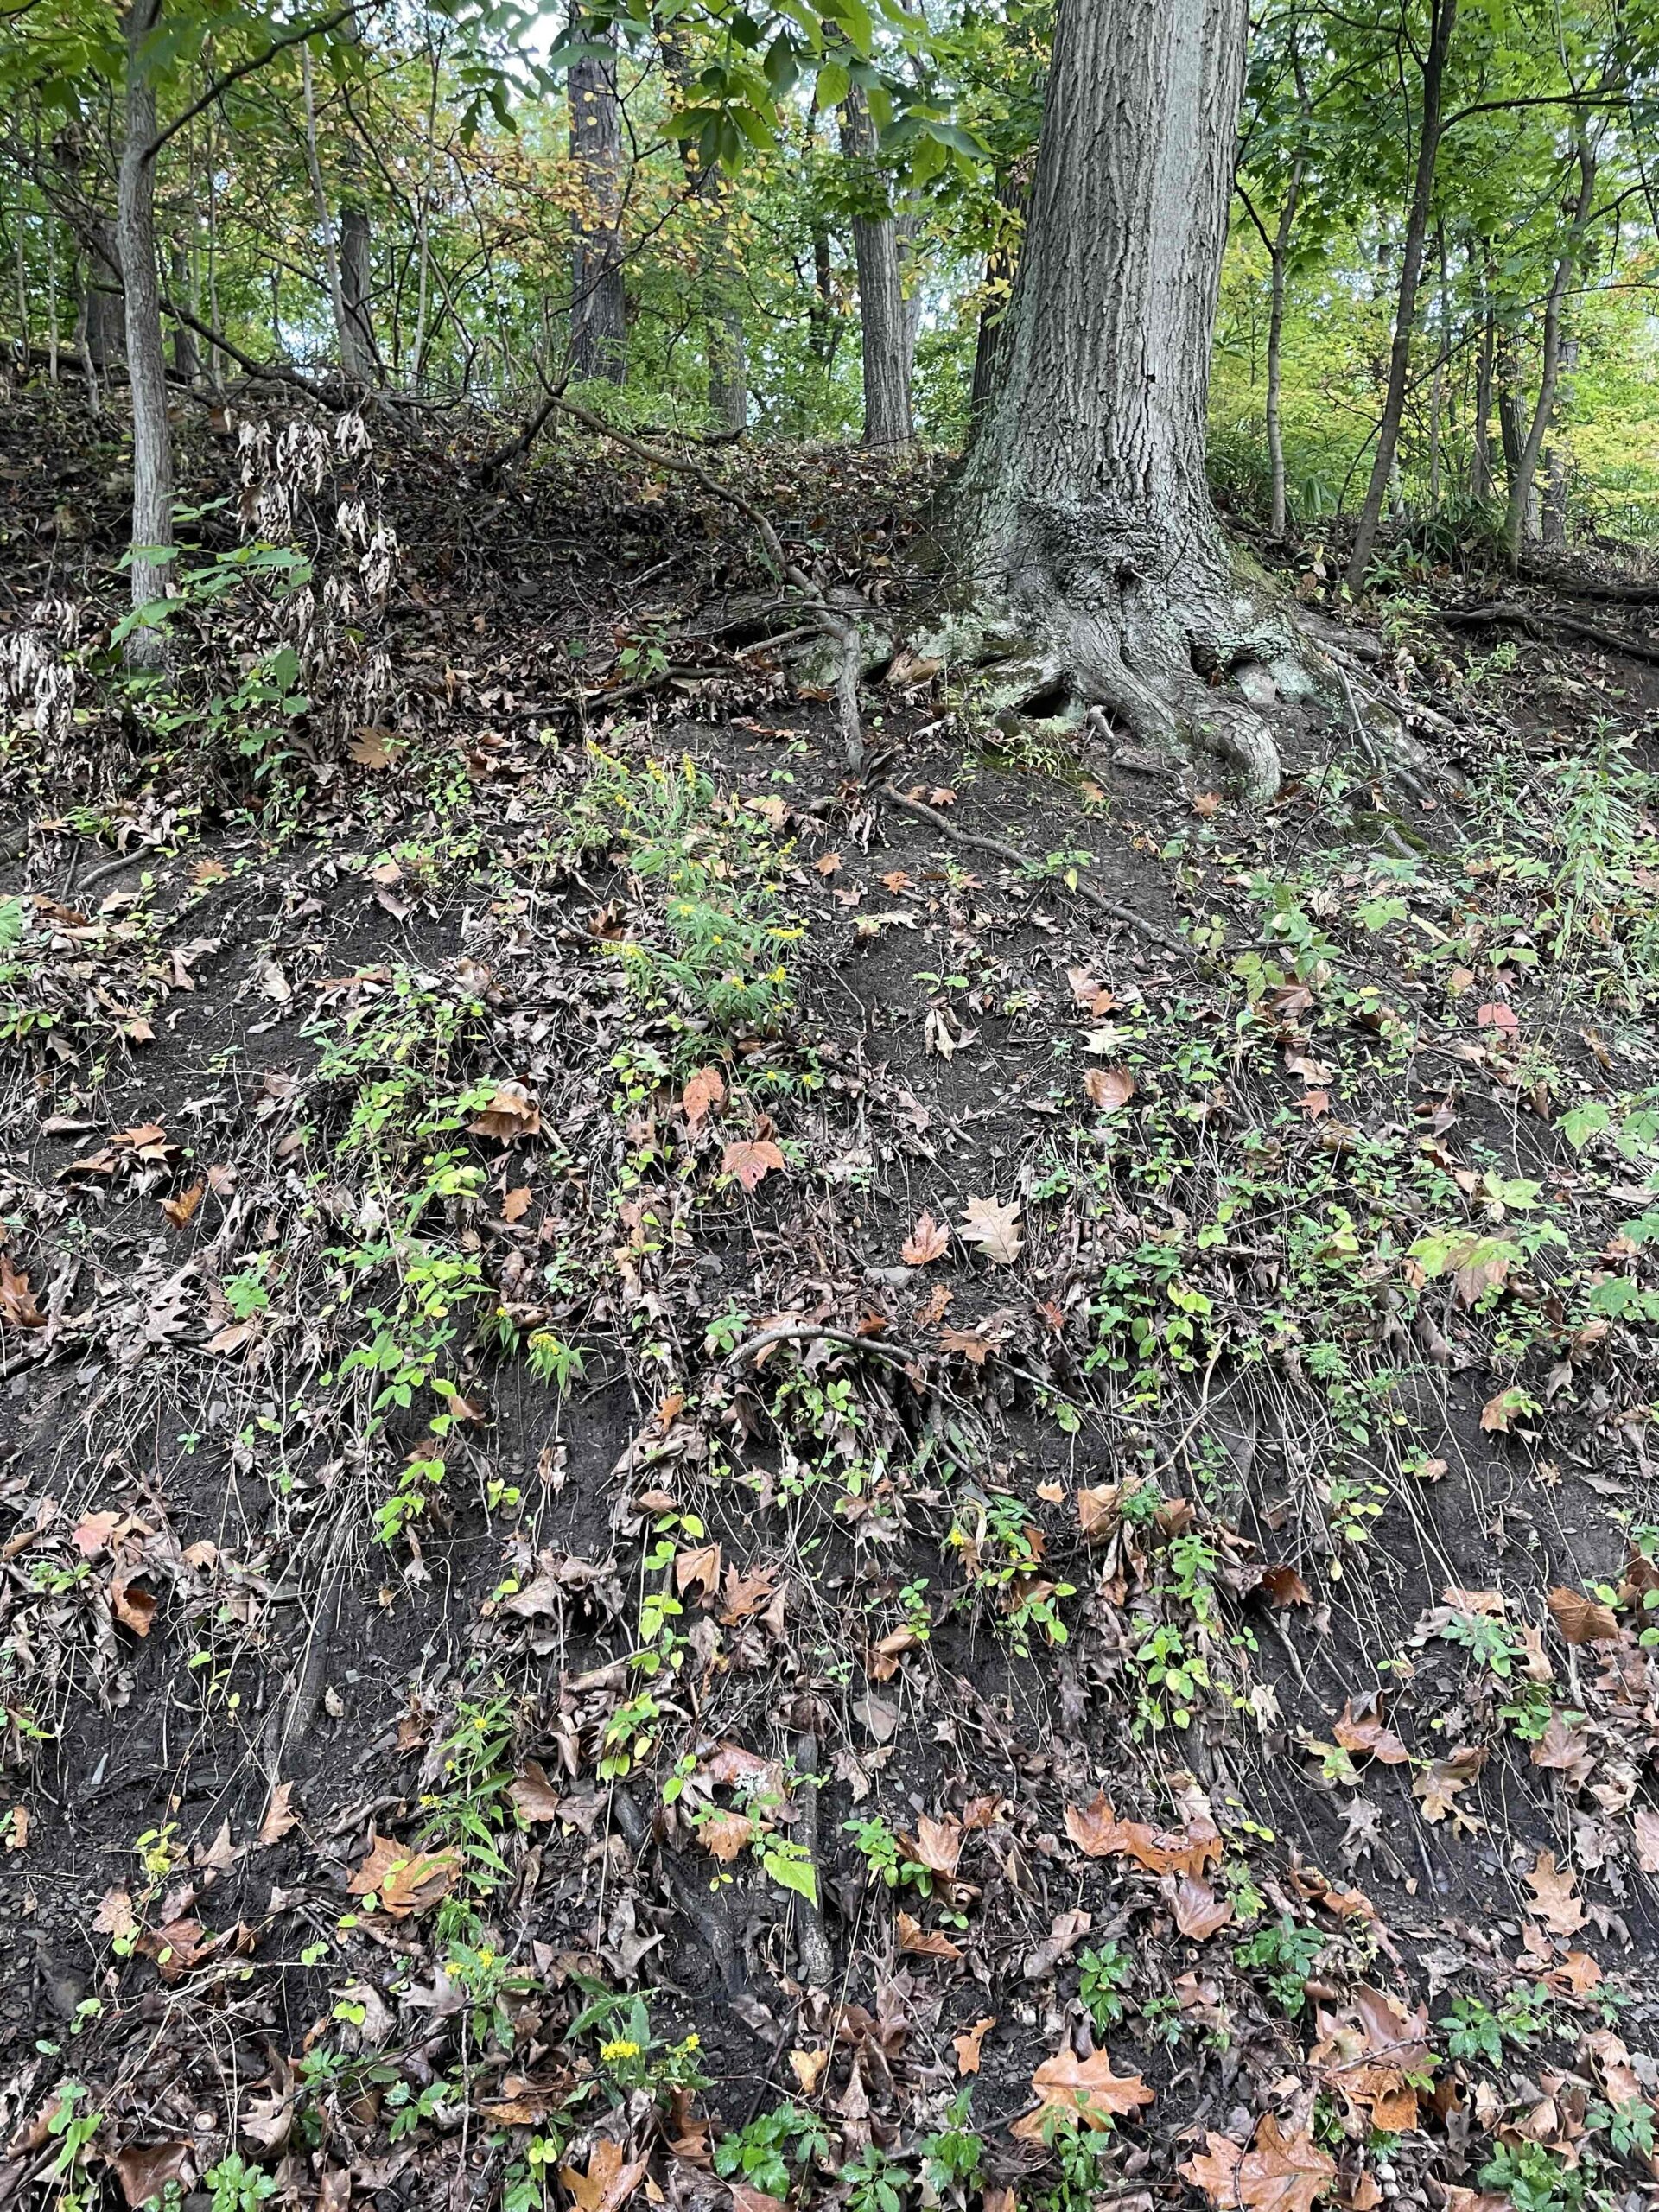
I spent 3 hours in Schenley Park, from 4:00pm to just after 7:00pm. The first hour was spent setting up the trail cam. (I wanted to find a sturdy and inconspicuous spot that I could easily access. It’s important for my project to maintain the same view, so I needed to find a spot that would allow me to remove and replace the camera in the same spot easily. I asked my friend Audrey to come to the park with me and asked if she could bring her ladder. She did, although the spot I selected didn’t require the use of the ladder. Thanks Audrey!) For the next 2 hours, I left the trail cam mounted by the tree. I was content and excited to see what it might capture.

A good friend and an unnecessary ladder.

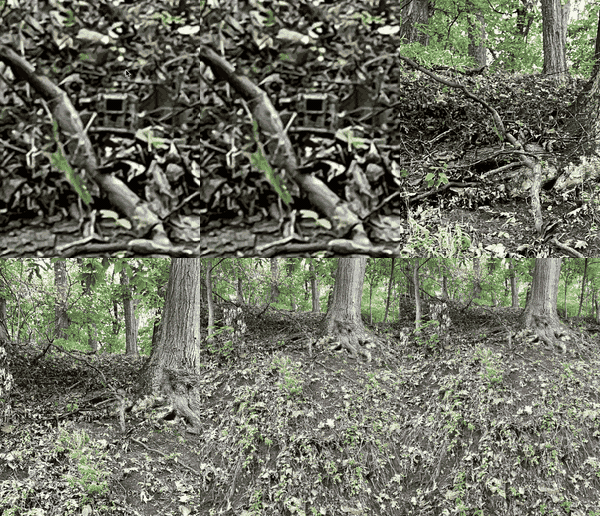
above, the trail cam set up from behind. below, the trail cam set up from the trail! It’s so camouflaged!


zoomed and highlighted, in case you couldn’t find it.

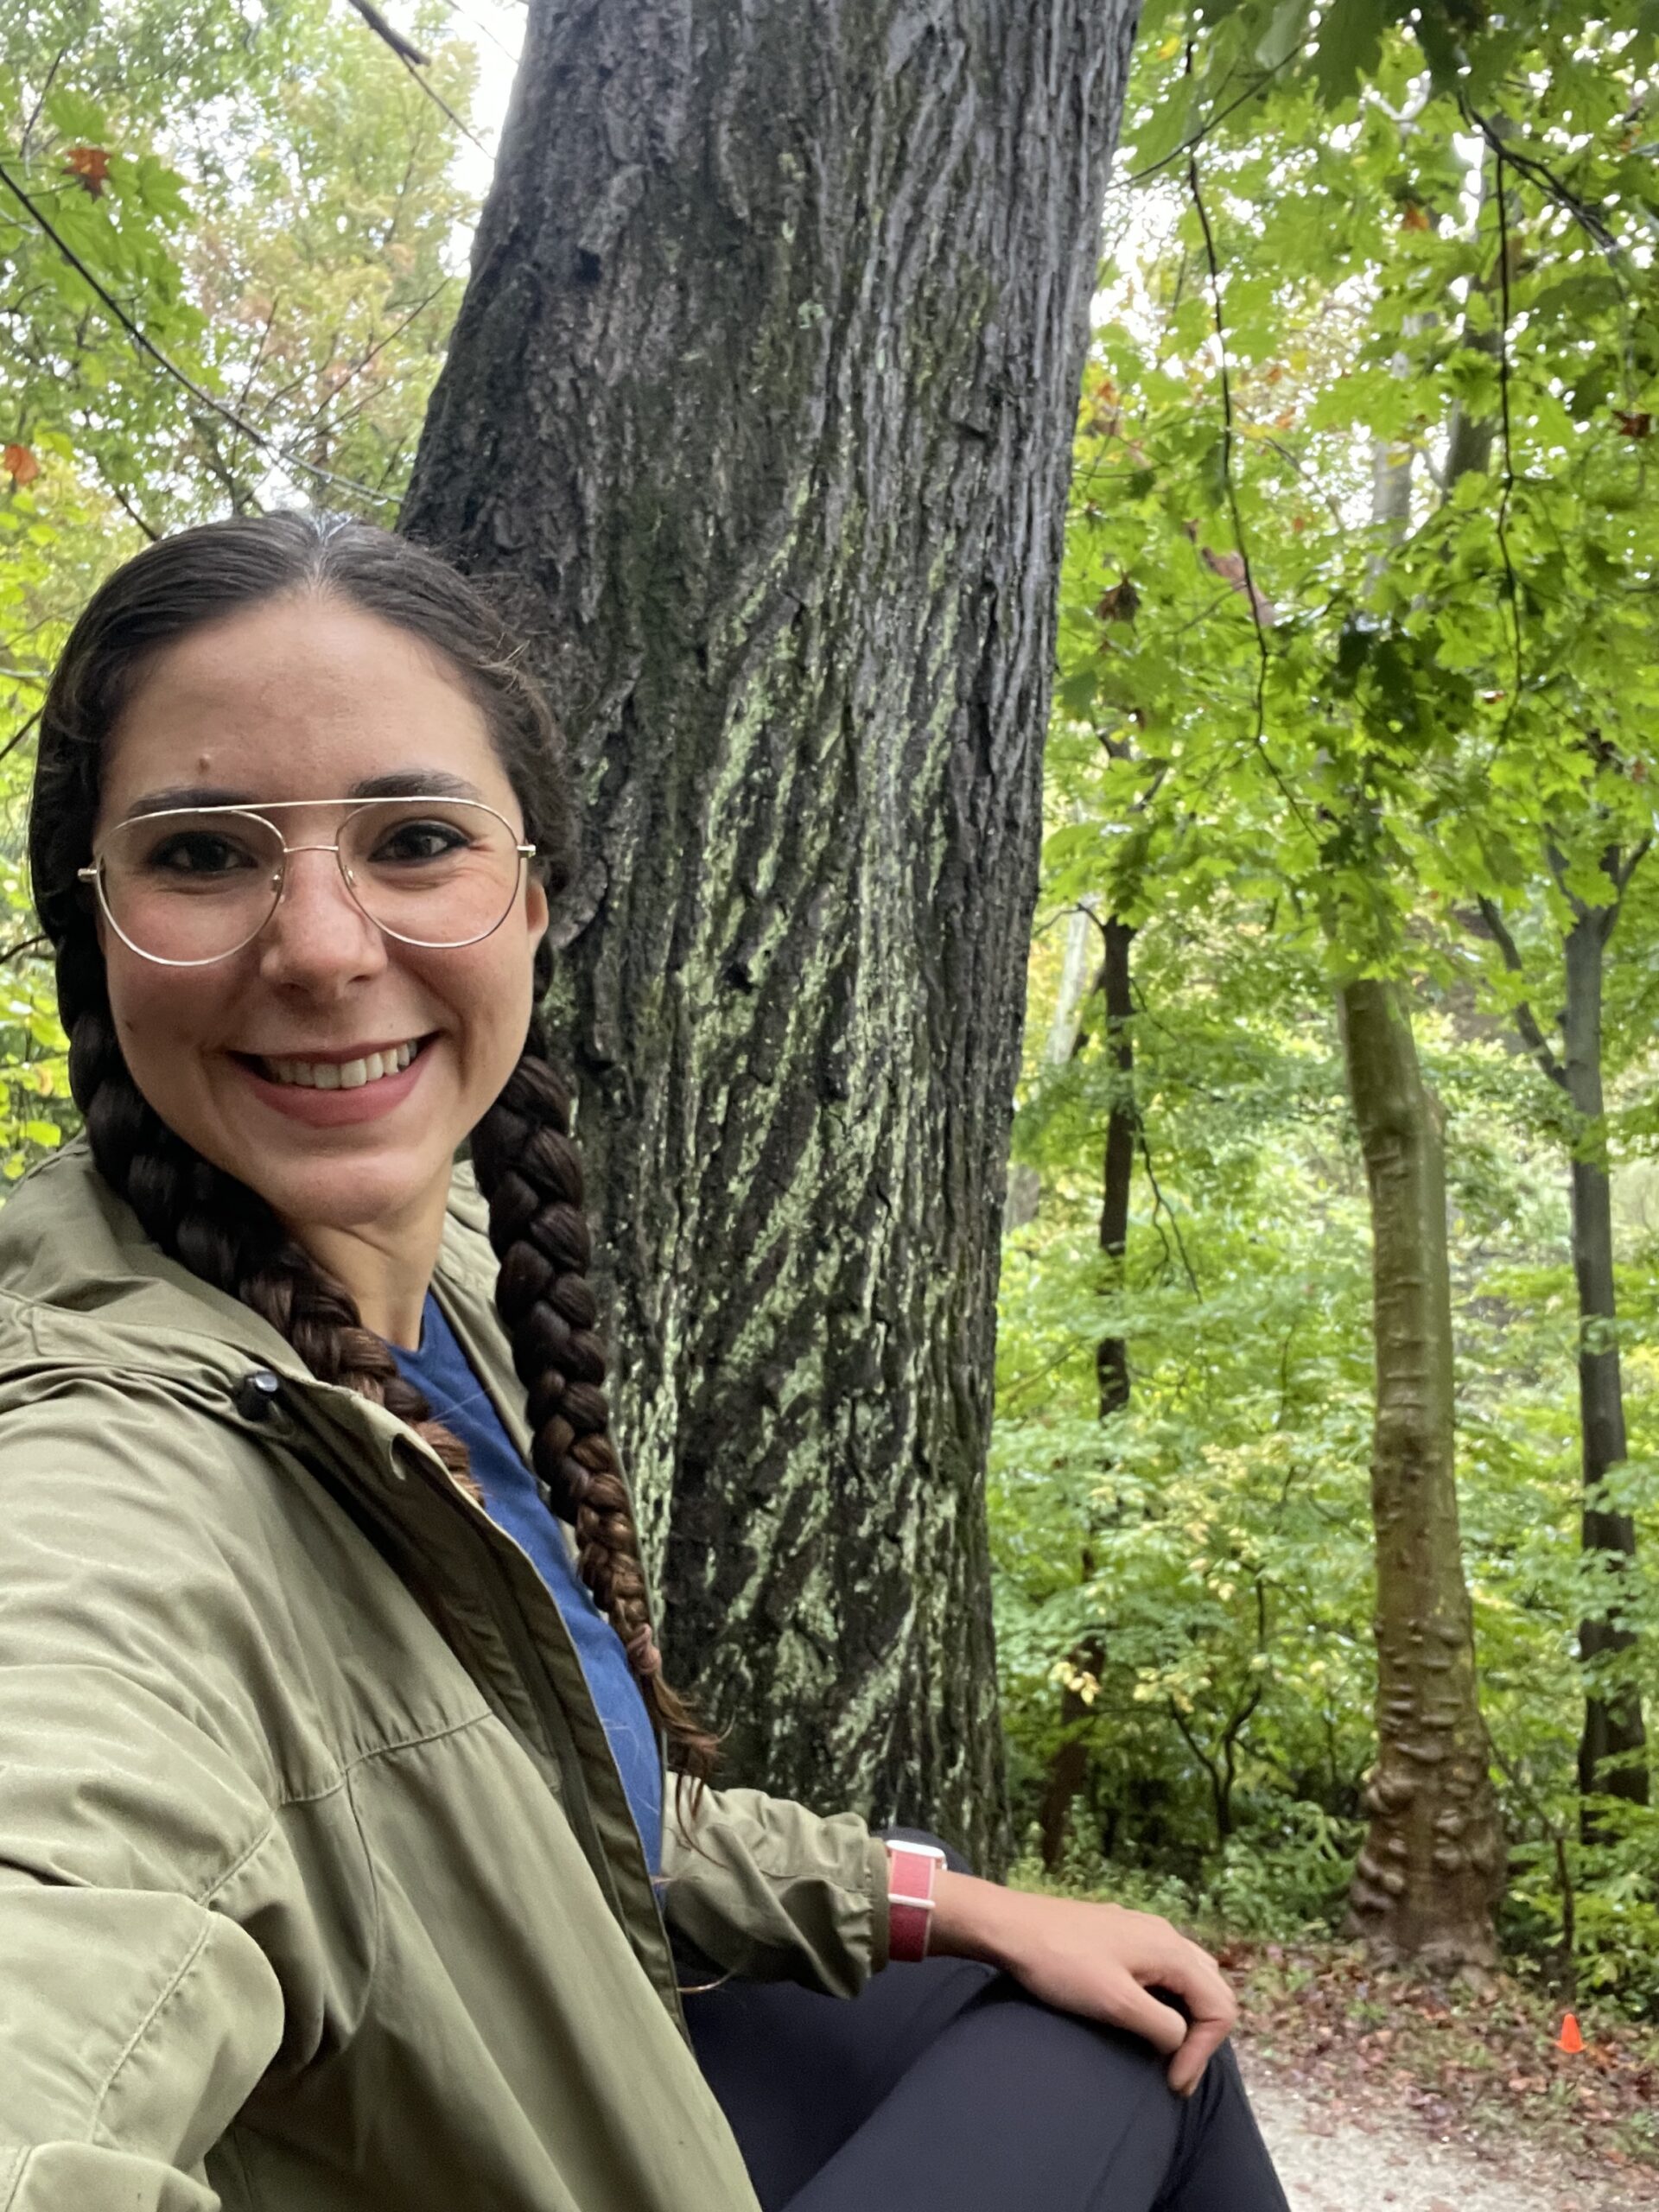
~A reflection on my setting up the trail cam.~ I got very dirty while setting up the trail cam because I climbed up and down the dirt hill to set it up. I startled some deer that were on the hill. They must have thought I was a freaky human, because I’m sure most humans they encounter don’t climb the steep hills, pressing their hands and knees into the dirt as I did. As I was setting it up, I was sitting next to a tree (for support). Seated beside the tree, toggling the trail cam settings, I saw many people pass through the trail below. Walkers, bikers, dogs, joggers. Not a single person or dog looked up at me. I was not hiding… had they looked up they would have seen me. But they did not look up.

Saturday, September 28th

Currently, I am sitting at a table in Schenley Park Café. It is Saturday, September 28th at 10:32AM. I arrived at the park a little after 8:30am to set the trail cam up. I’m worried because yesterday, I left the trail cam for 2 hours, thinking it was recording activity. I stayed nearby, reading while waiting for nightfall, with the camera in view. My plan was to collect the camera as soon as it stated getting dark. (Around 7:15pm). I picked up the camera, super excited, because I had seen various passerby on the trail… but it turned out that that the trail cam hadn’t filmed a thing!! I was confused!! Frustrated!! Because I had tested the set up before in studio, and on the trail, and the video recording based on motion detection worked as I expected.

I decided it would try again the next morning. Early. This takes us to the present moment. While I sat upon the hill by the tree setting up the trail cam, not a single passerby noticed me. More groups of joggers, walkers, etc. I even filmed some of them with my phone. I continue to be shocked at the fact that so far no one saw me. I wonder how they would react if they did see me! My guess it’s they would be startled and think I am a weirdo. 

I’m sitting here, writing these notes, feeling very worried that the trail cam may not be recording. I think it is, because I spent time setting up and confirmed that it was recording before I left it. The interface is not helpful in confirming what the camera is doing. This makes me wish there was a way for me to access the live footage, to receive confirmation that the camera is indeed recording, and that I am not wasting my time. Although I actually enjoyed the time I spent waiting for nightfall in the park yesterday, of course I felt like my efforts had been a waste. Because of this, I have submit request to borrow a GoPro Hero 5 from IDeATe. I hope I can pick it up today. I’ll pick a second spot for the GoPro and will remain nearby as it films! I have downloaded a bluetooth remote control app for the GoPro, so I hope that can allow me to control it from afar. At least this way, I will KNOW that the recording is happening while it happens instead of having to wait and see. This lack of immediate feedback from the recording device makes me think of photography when you didn’t know what you were capturing, or if the camera was working well, until you developed it. In this case, I don’t get to see what the camera is capturing until I remove it from its spot. This is inconvenient!

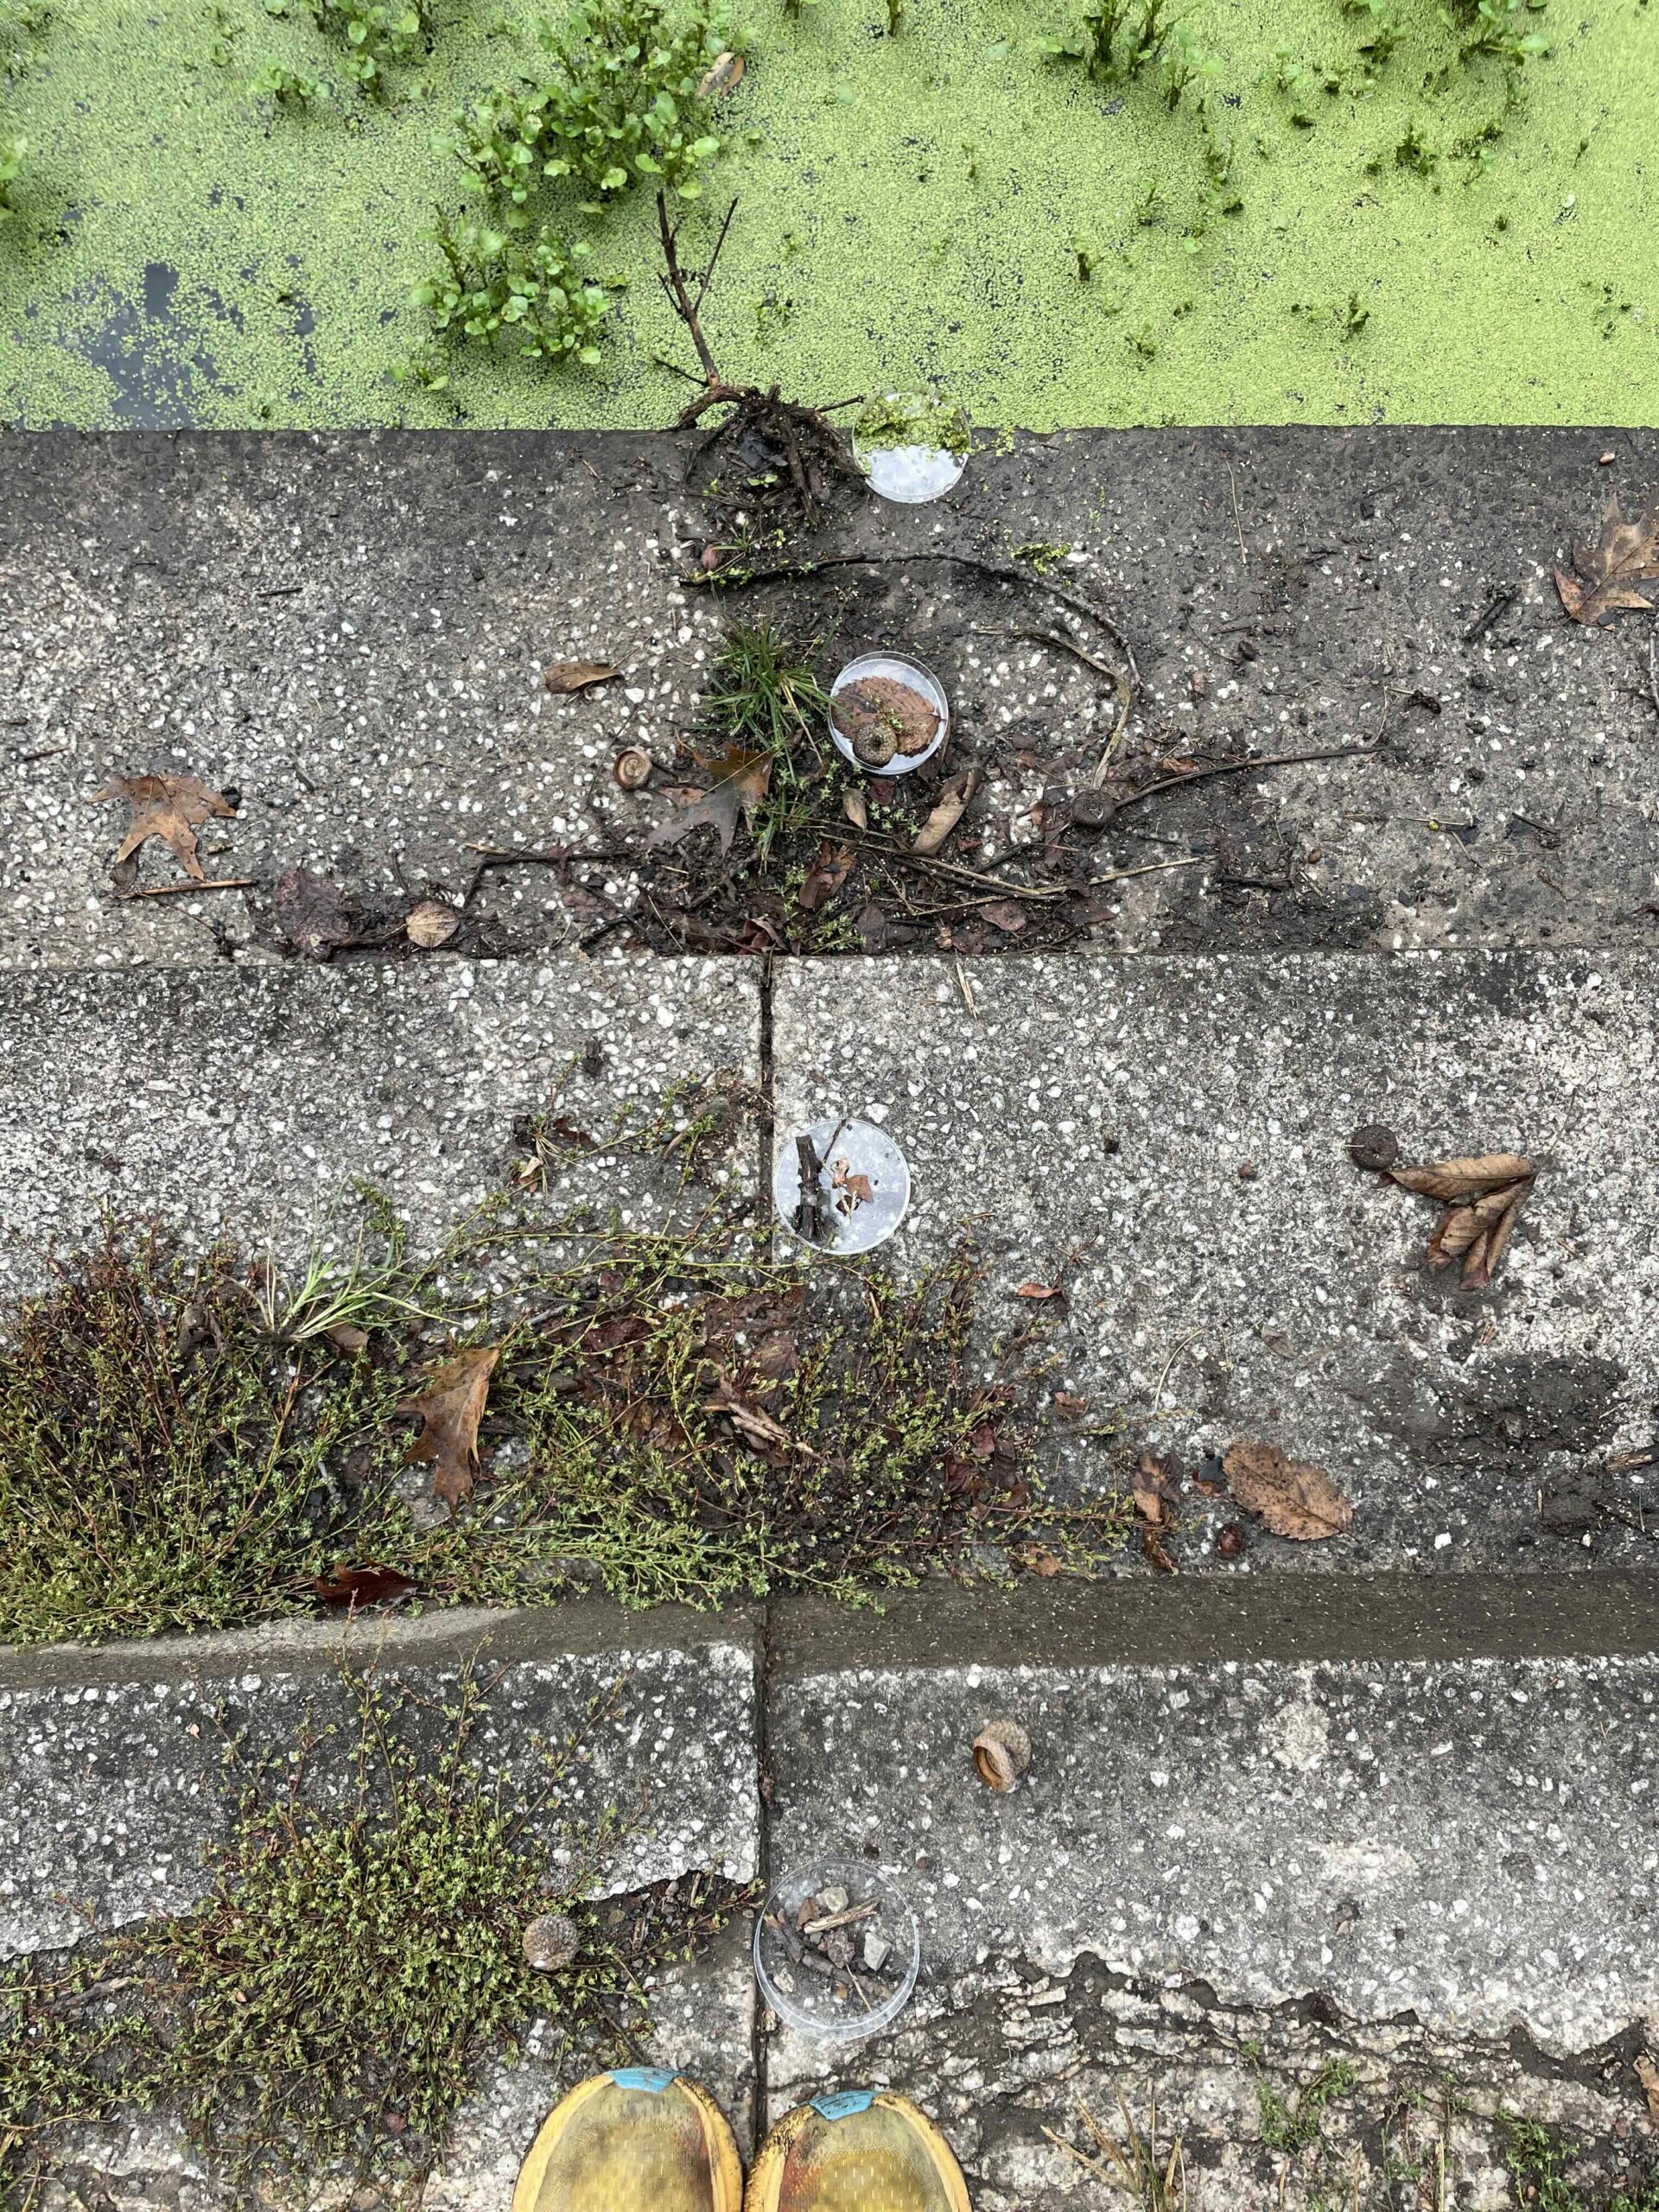
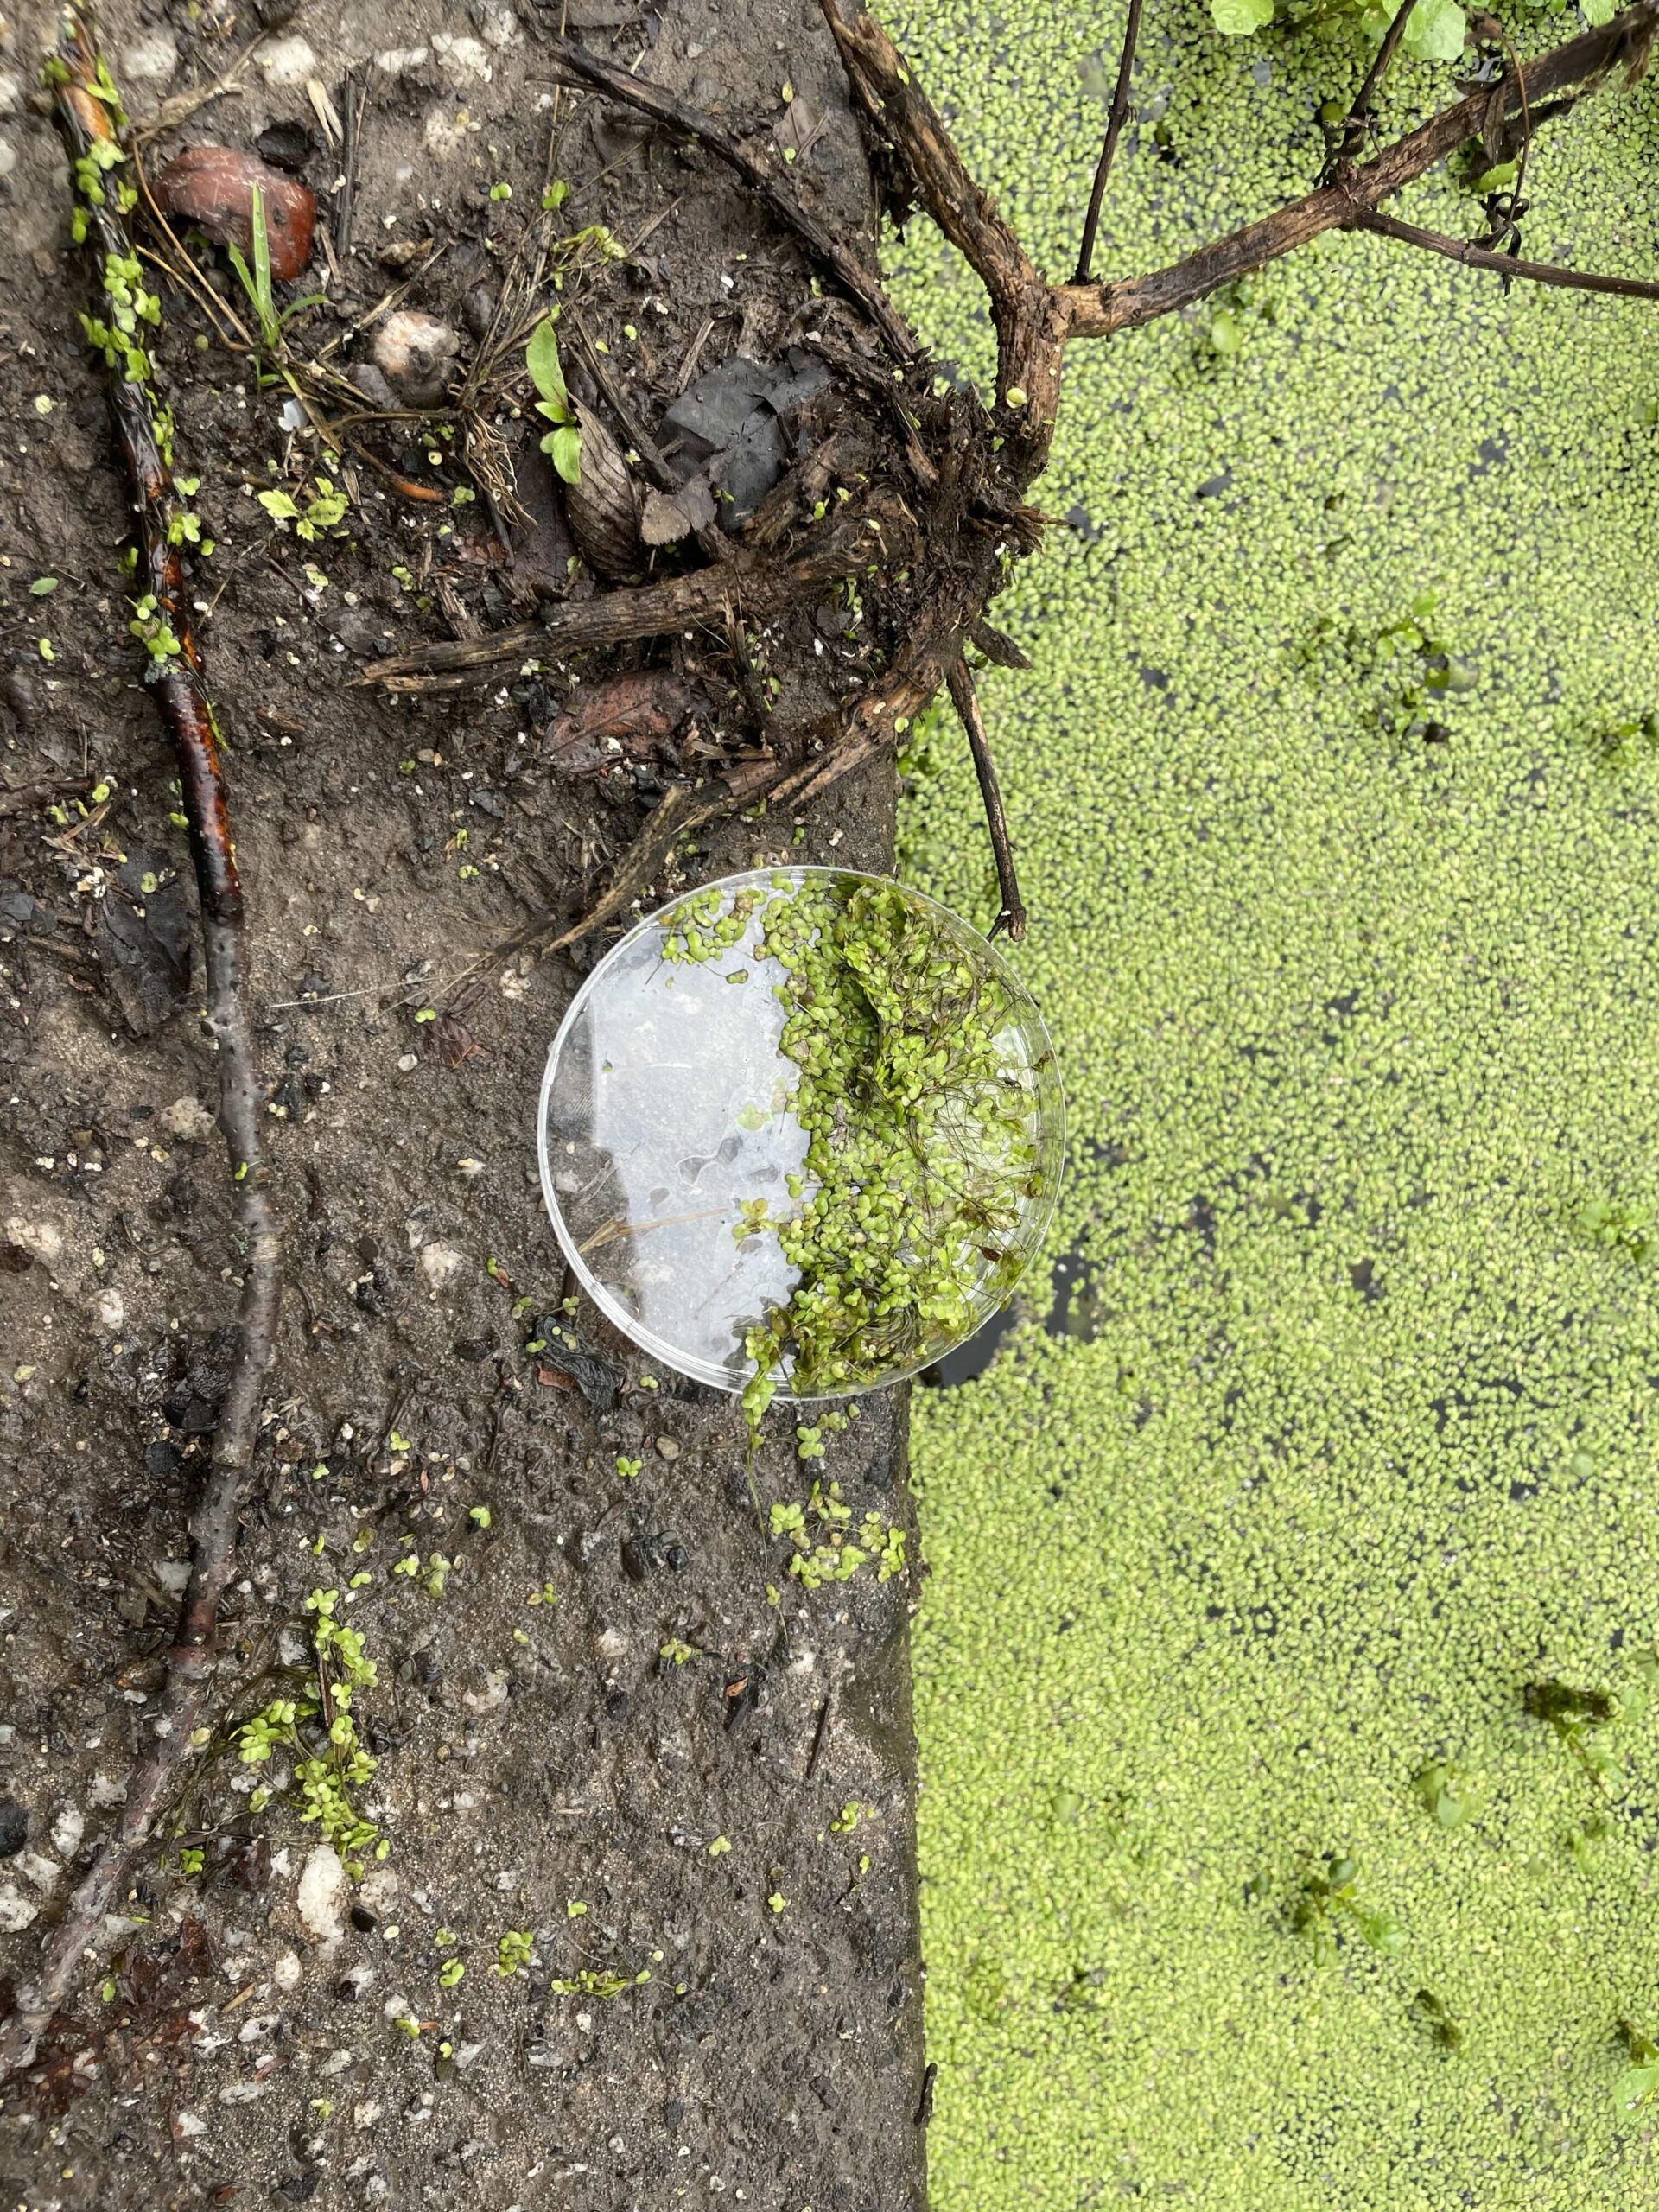
Speaking of spending time in the park – well… I’ve actually never spent so much time ~still~ in the park. When I’ve spent a lot of time in Schenley, I’m usually in motion, either walking or running. Through my stillness, I’ve noticed and become interested in some new features in the park that I hadn’t thought about before. The first is the variety of textures on the park surfaces. I’ve collected some sort of transect samples in petri dishes (I used petri dishes only as a means of standardizing the amount of material samples collected). I really want to put these dishes under the STUDIO microscope. I was amazed by what I saw under the microscope when we did the spectroscopy workshop a couple weeks ago because though it I was able to see the movements microscopic bug on a leaf that was impossible to see with the naked eye. This was shocking! Amazing! I almost couldn’t believe what I was seeing. It was like a portal into another dimension, where the familiar looked so different, it became unfamiliar. And I questioned what is really there. We see something like a leaf and we think we know what is it. But do we? 

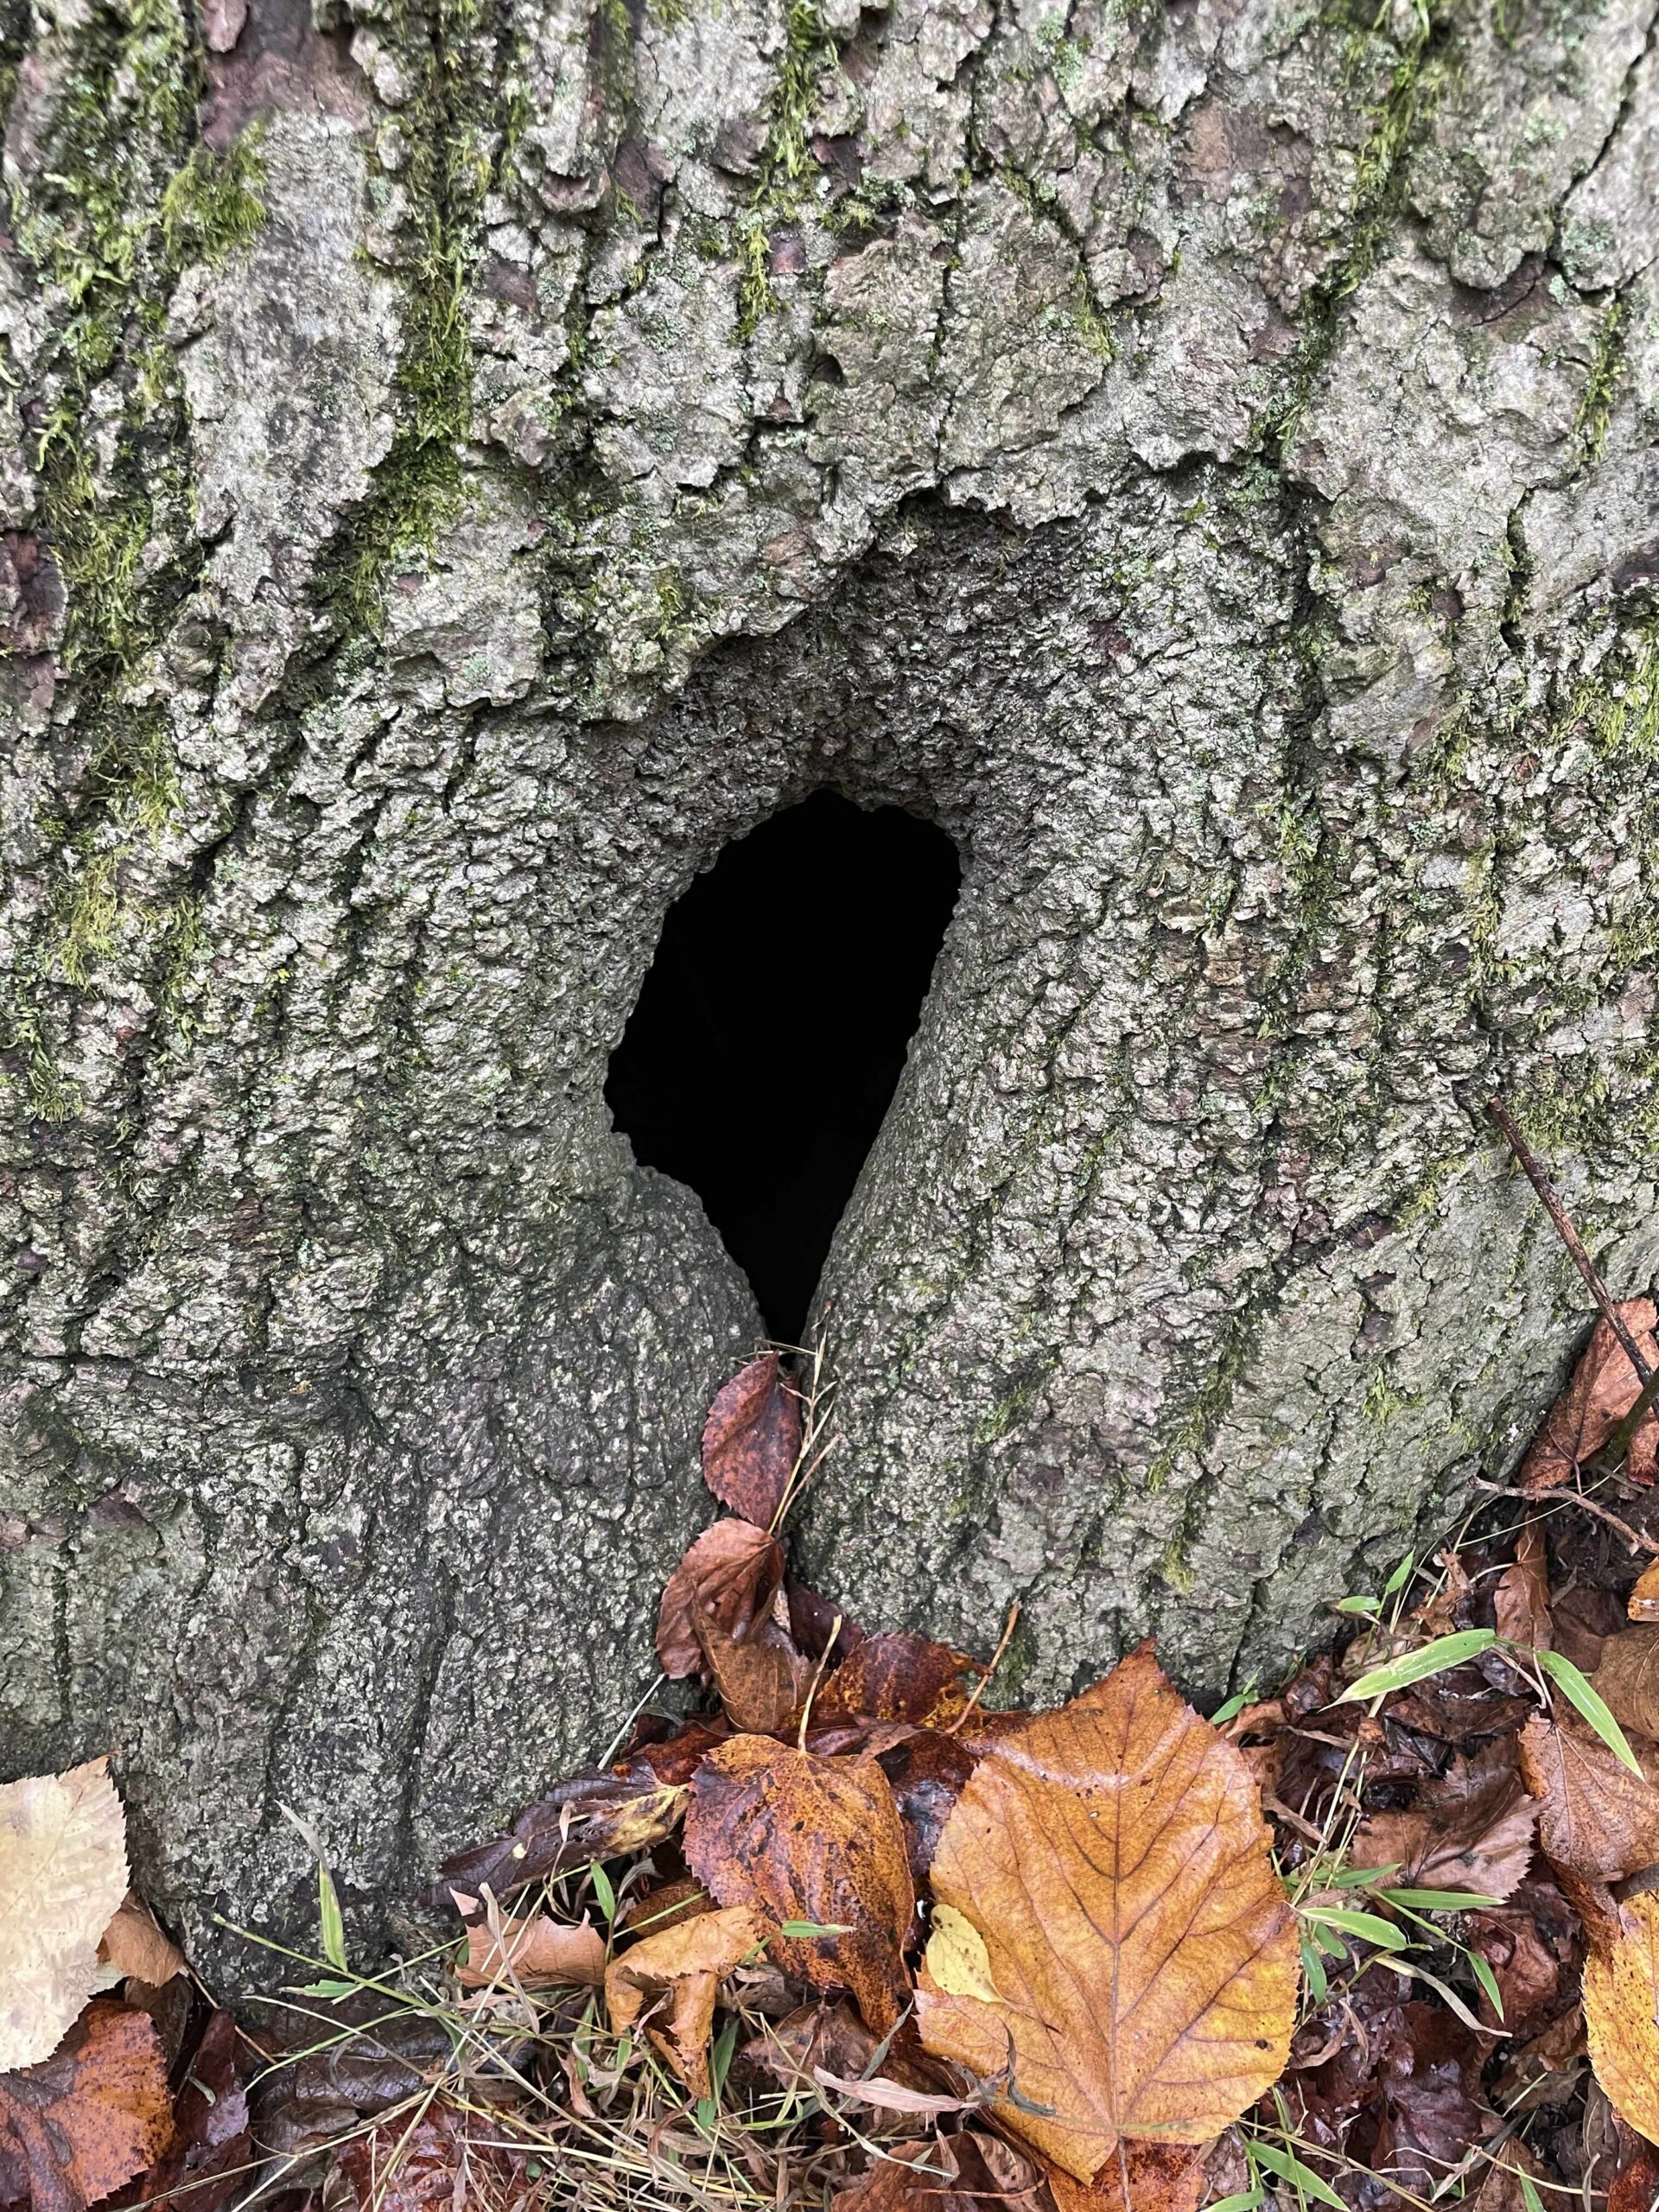
The other new interest is in tree hollows! They are everywhere and they are so mysterious to me! What goes on inside them? As humans don’t see what’s inside of them usually because our bodies are too big. Also they are dark. I would love to use a probe to scan or capture the forms they have on the inside and the activities they allow for plants, animals, fungi, & bacteria. How best to capture tree hollows? What devices could I use to capture the secrets of the tree hollows?

Doesn’t this look like a black hole?

So it is now 11:22am. At noon I will go to the trail cam and confirm that it has been recording videos. WISH ME LUCK! After I check on it I’m going to go to IDeATe to try to borrow a GoPro…

UPDATE I last checked trail cam footage around 12:00pm and it was recording! I’m sooo excited. Set it up again, I think it’s working.. I hope it’s working… I borrowed a go pro from ideate…. It’s 3:09PM

Tuesday, October 1st

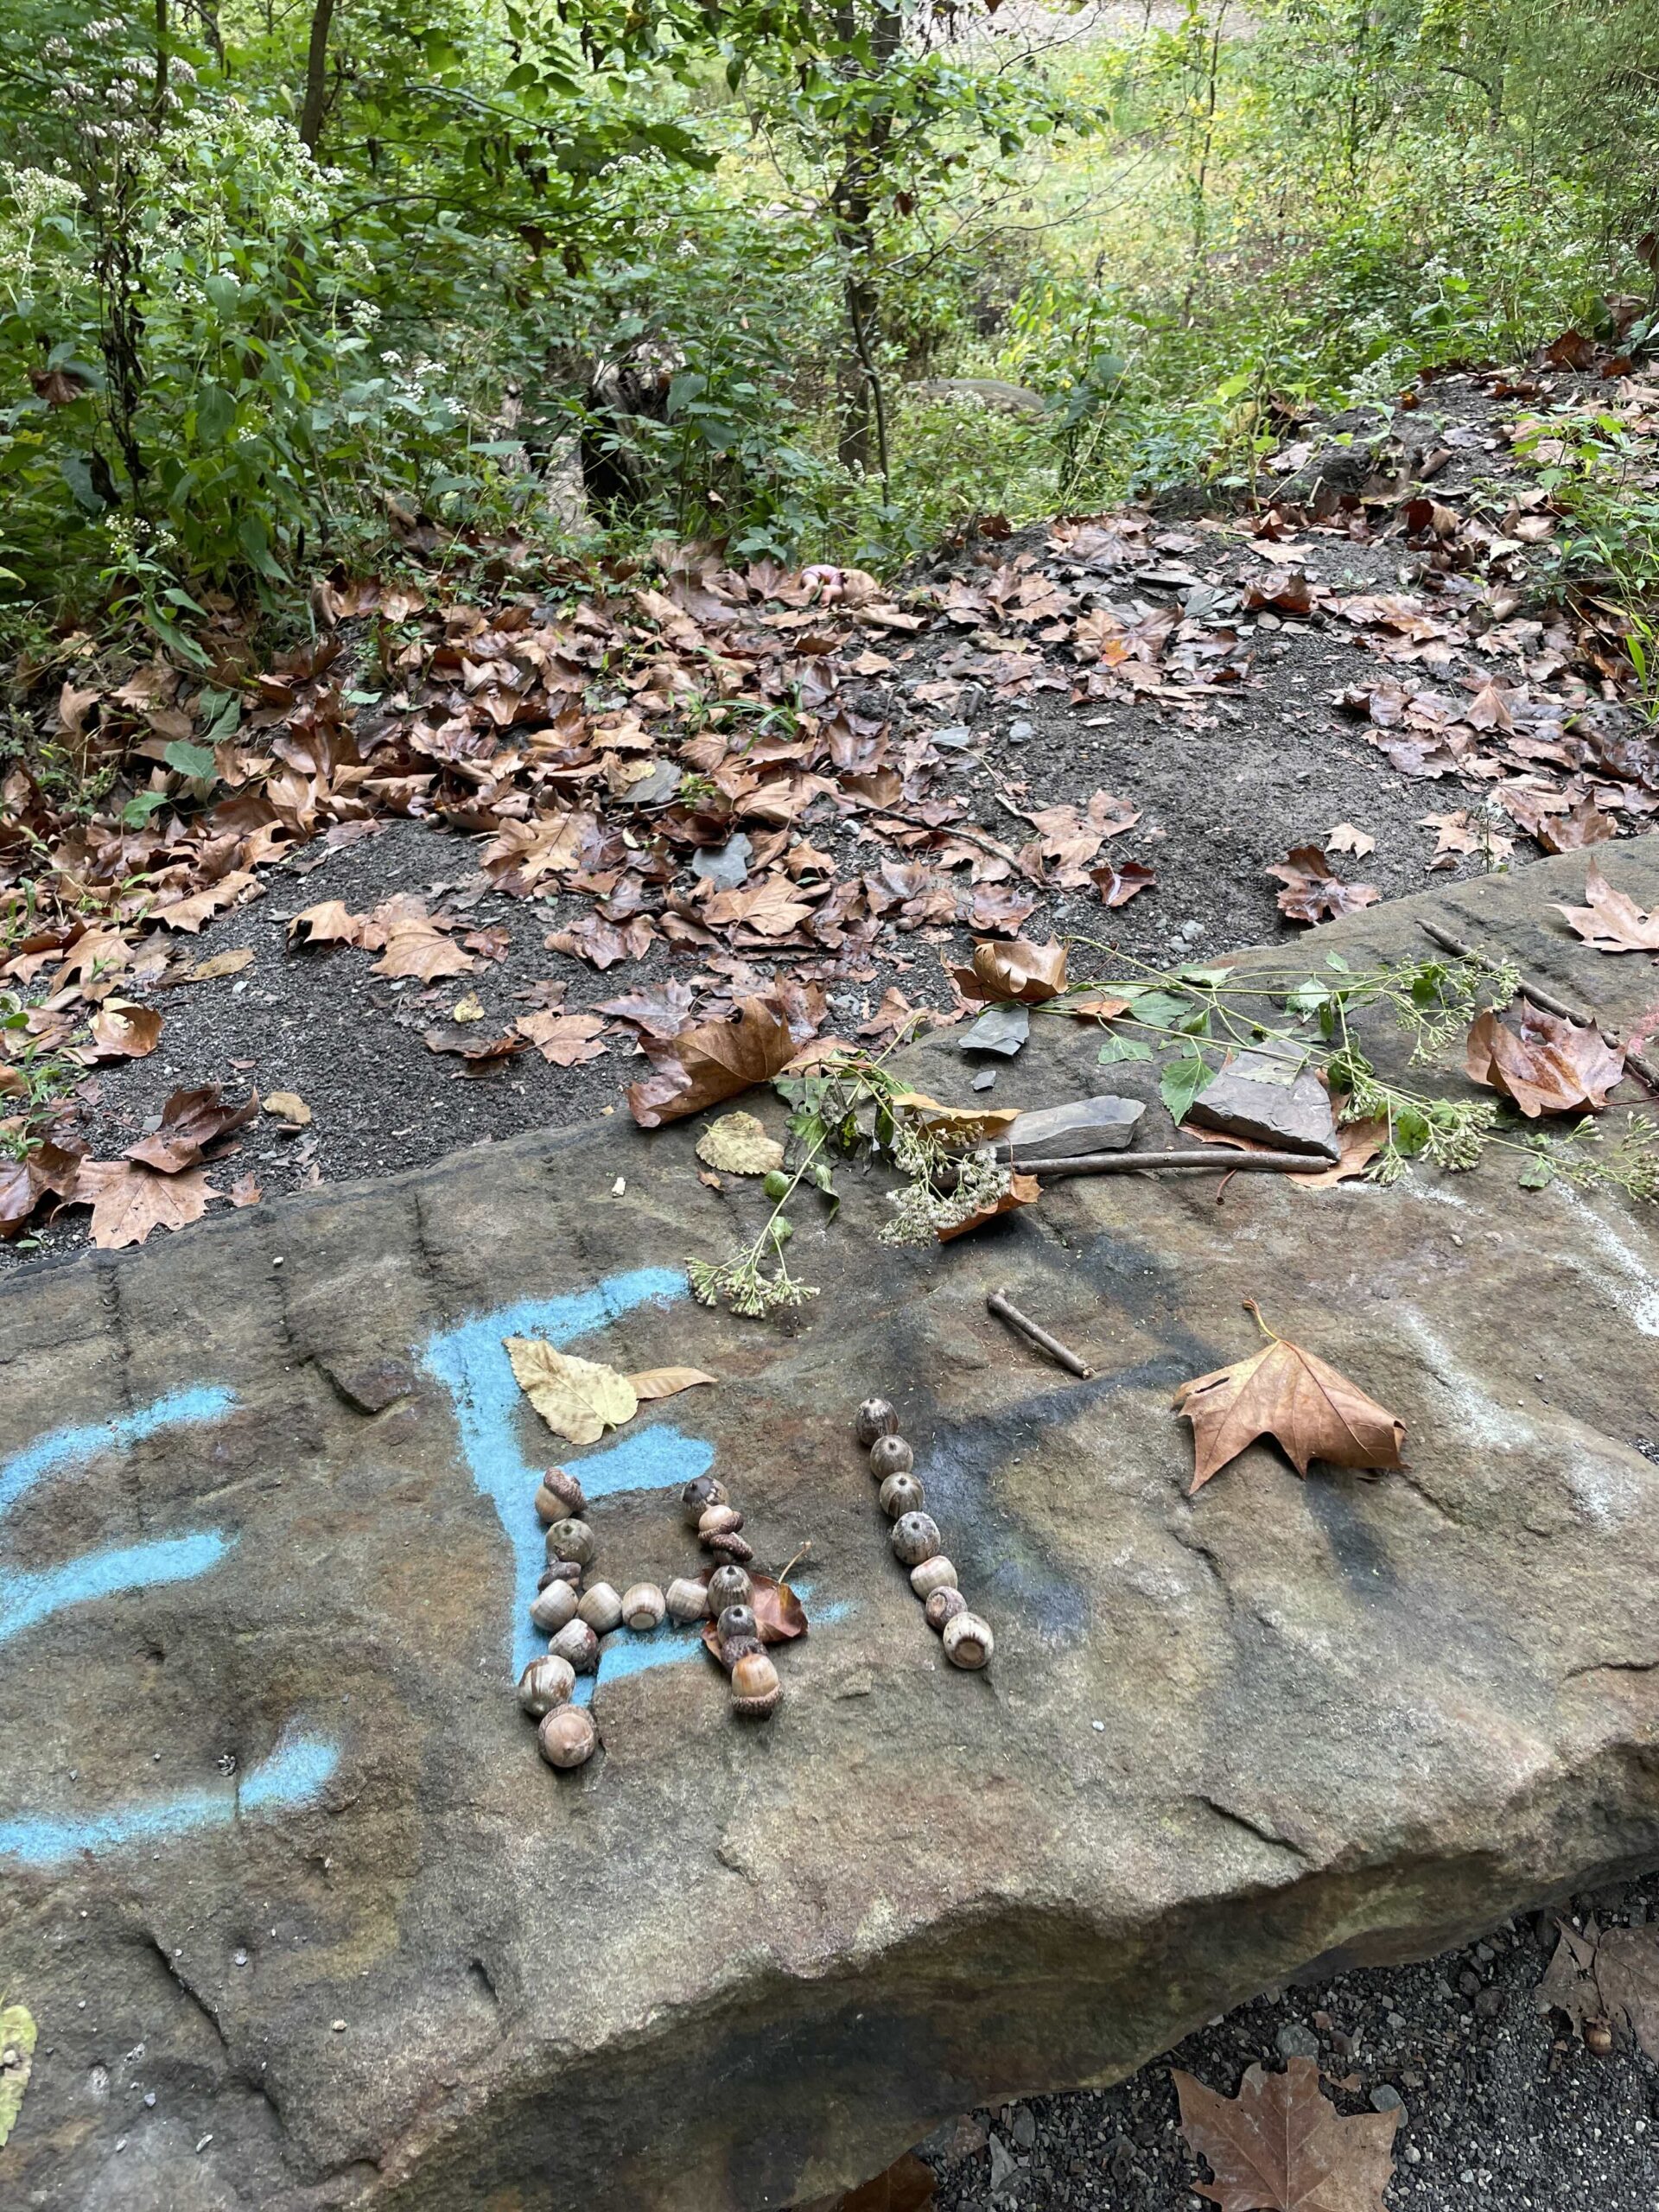
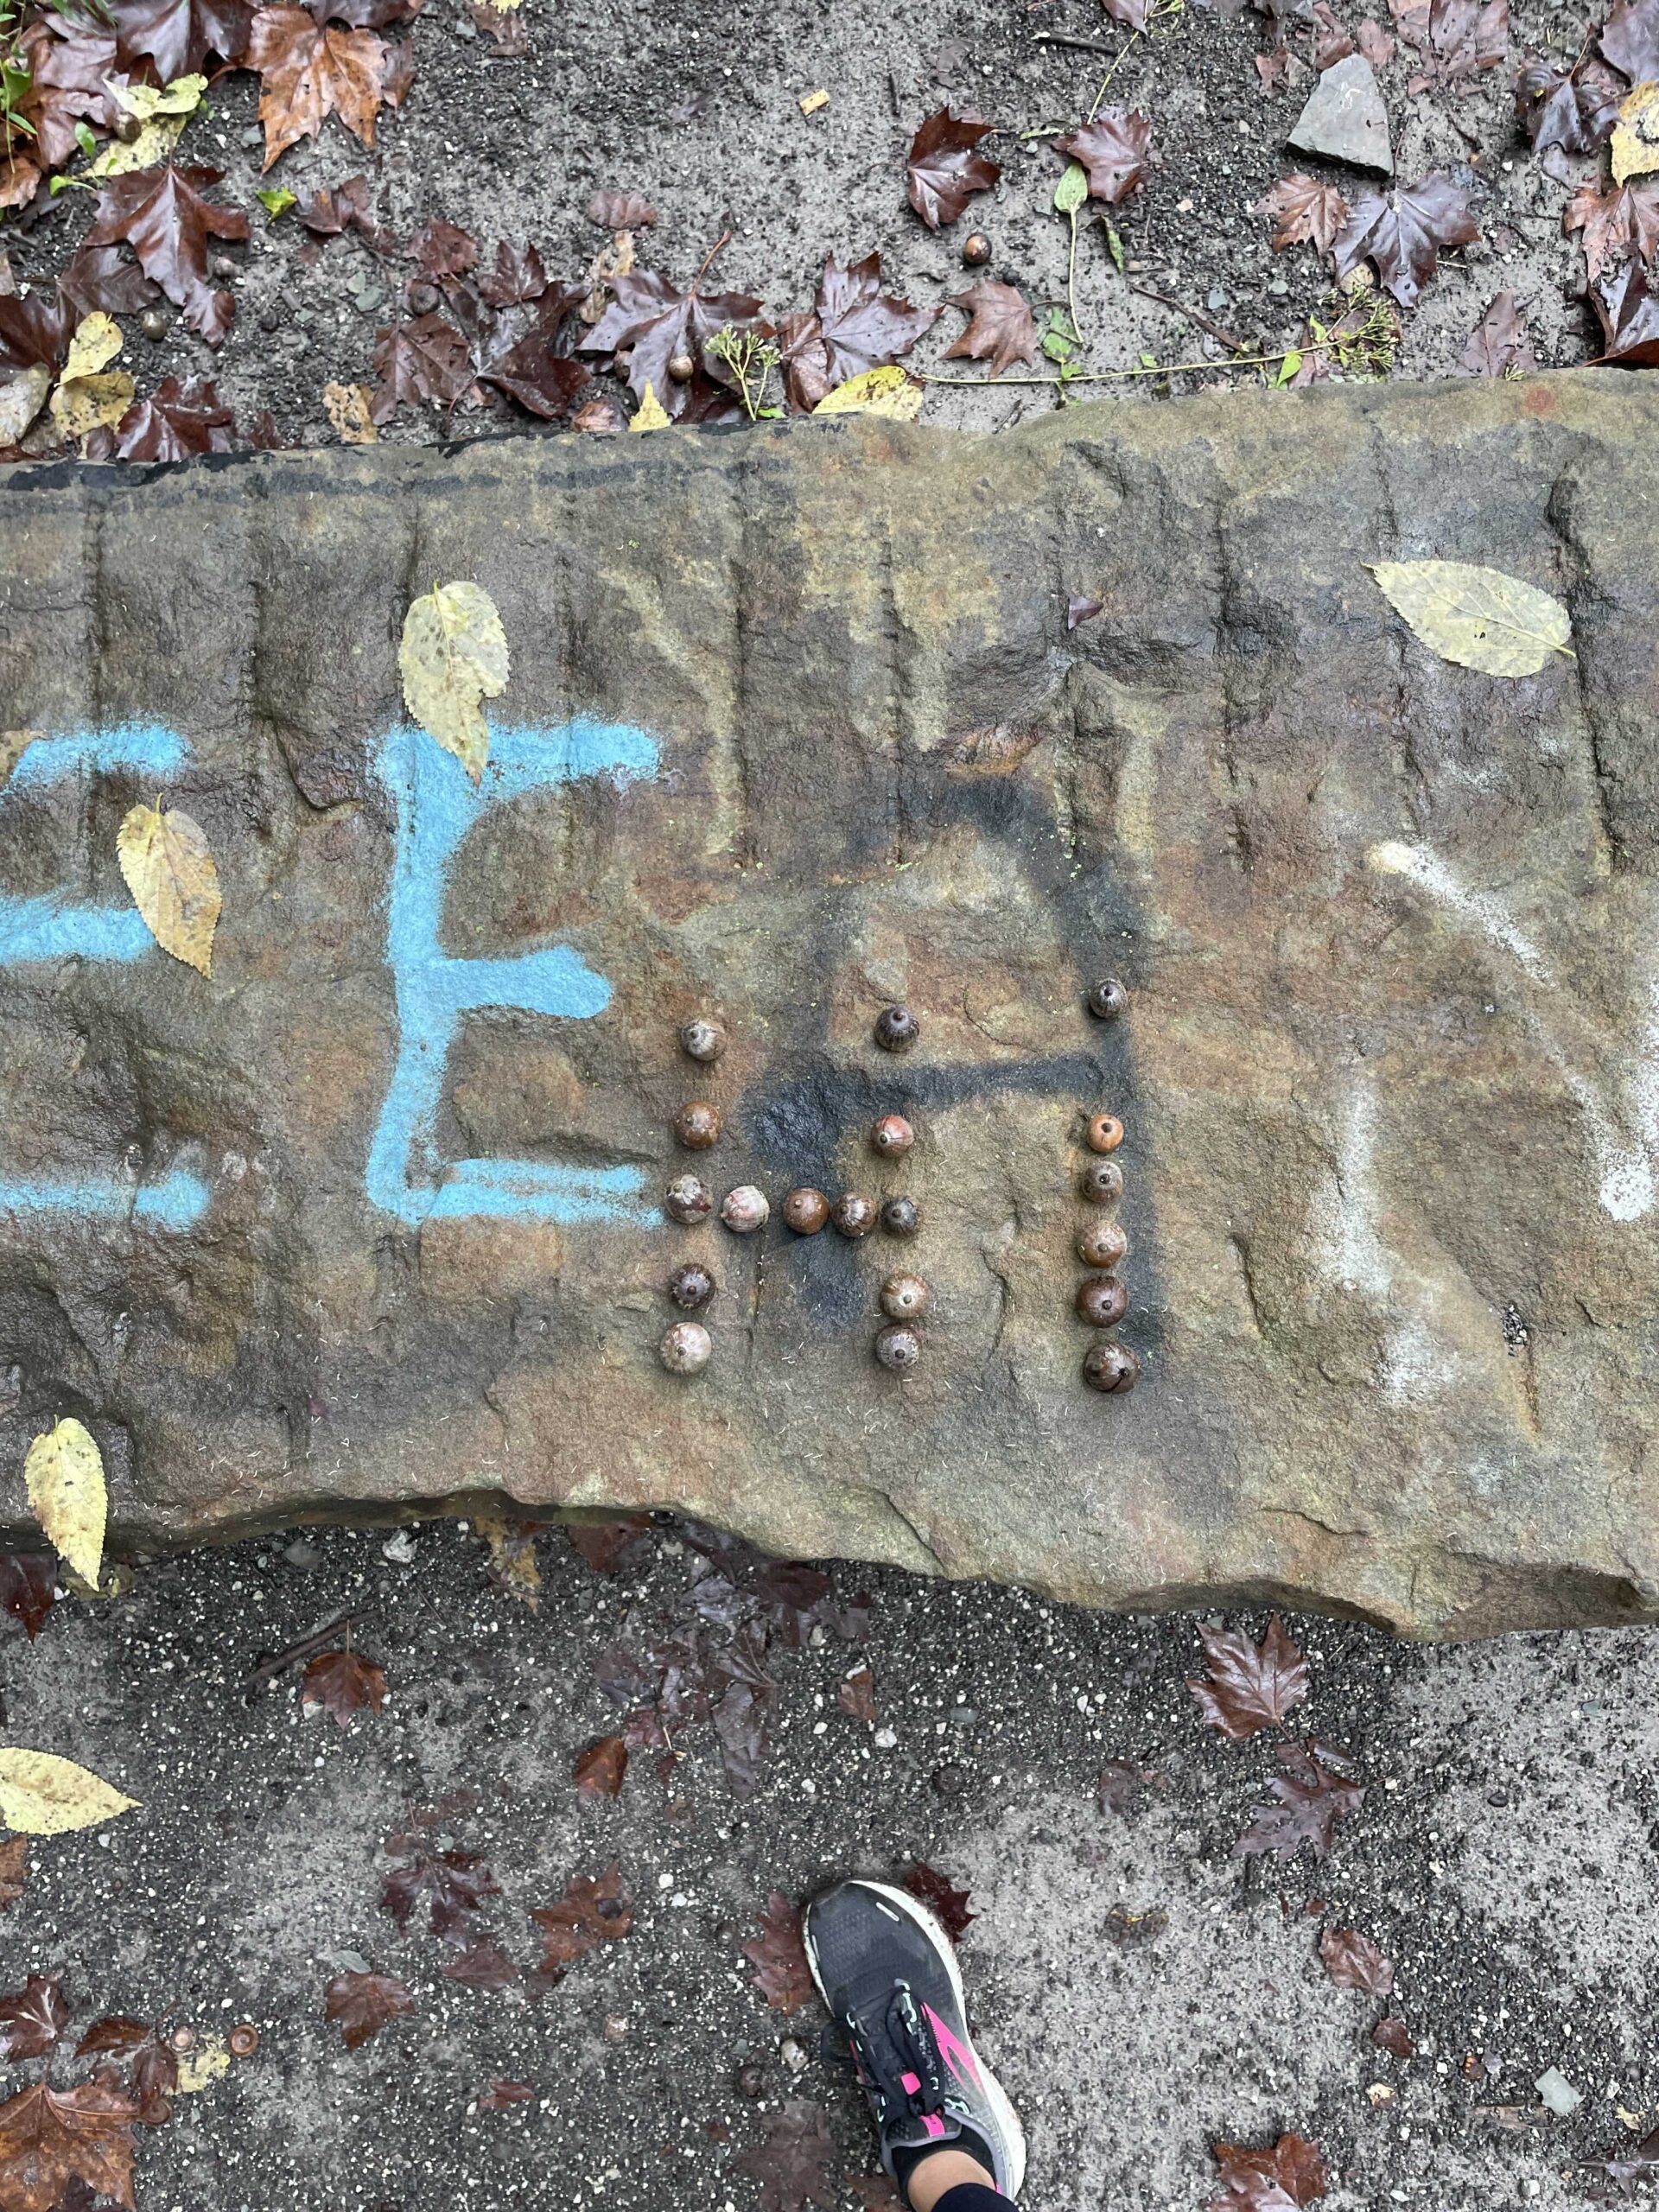
9:00am. Update on Schenley Trail Cam – This morning I witnessed something truly amazing.The acorns I left on the bench on Sunday were scattered across it. As I returned to my perch on the hill to set up the trail cam this morning, a passerby stopped by the bench. He spent a few minutes rearranging the acorns on the bench. Since I was so close to him, I tried my hardest to remain completely still. Once he left, I saw the message he wrote. It says “Hi” — this is so amazing to me. Why is it so amazing? Perhaps because that was the message I left, and because he had the exact same idea. It felt like mystical telepathy.

The acorn message that I left on the bench on Sunday.

Below is a link to the video of the guy placing the acorn message below.

IMG_8475

The acorn message that someone place on the bench on Tuesday morning.
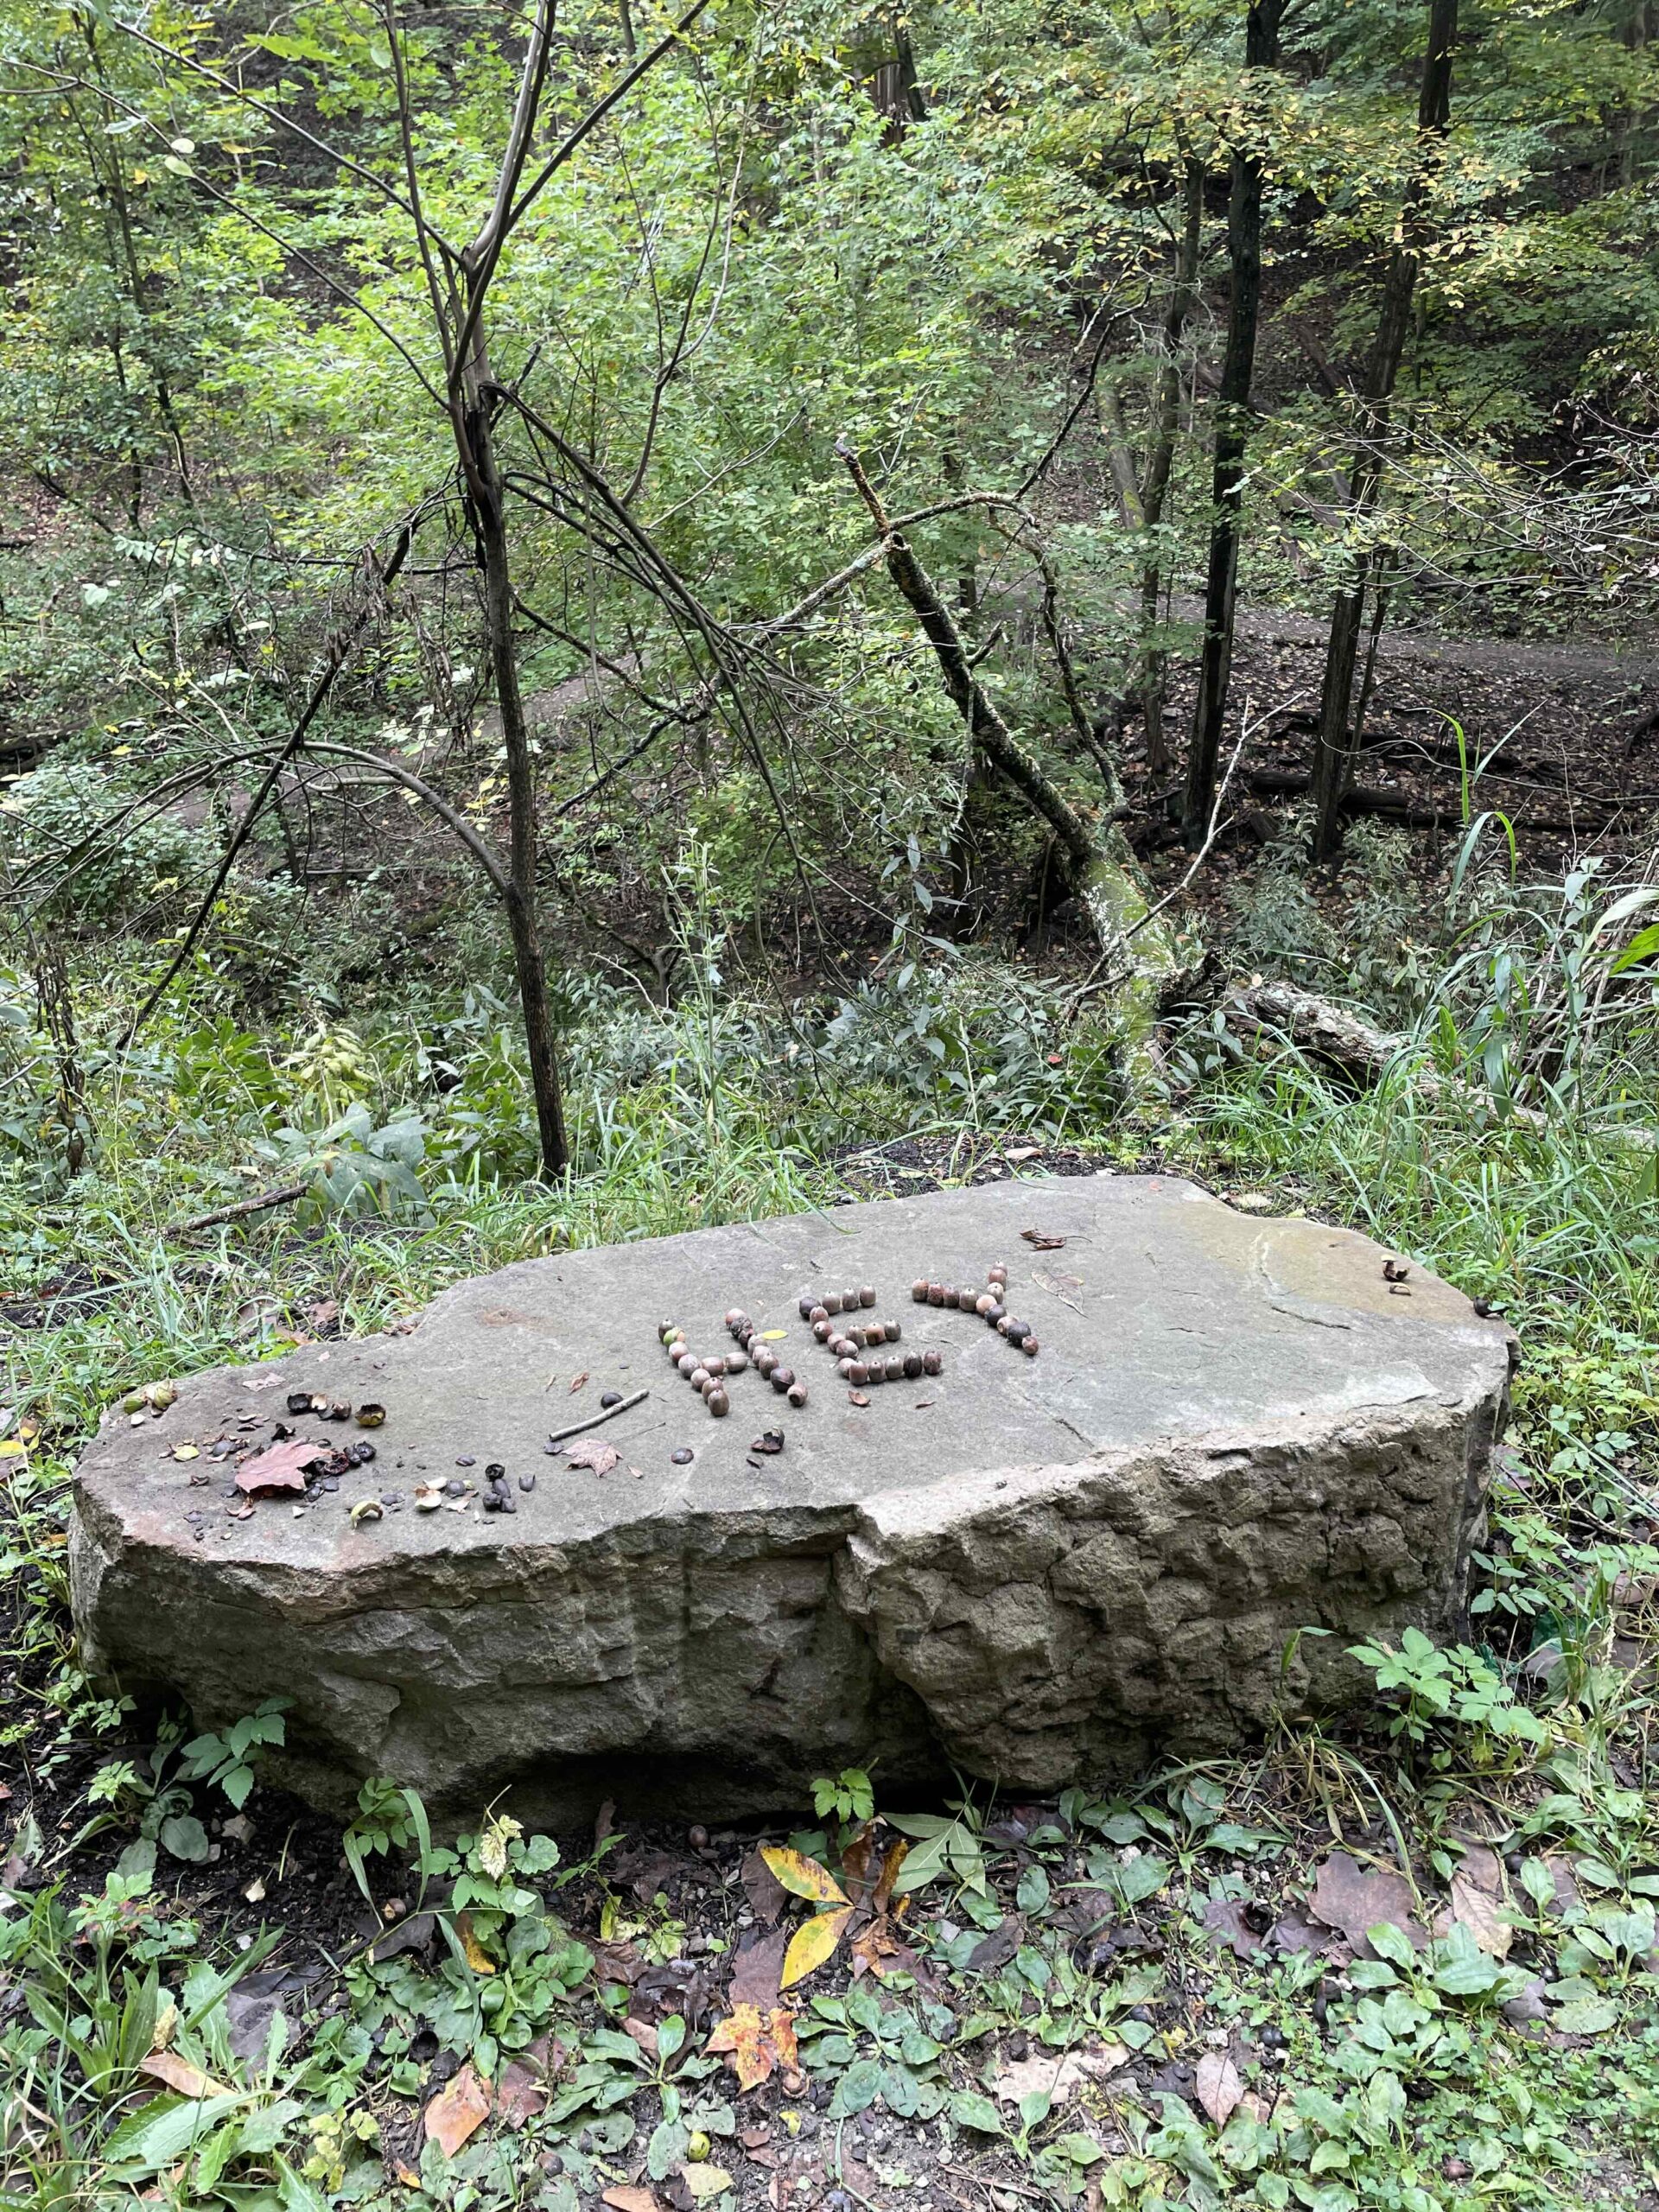
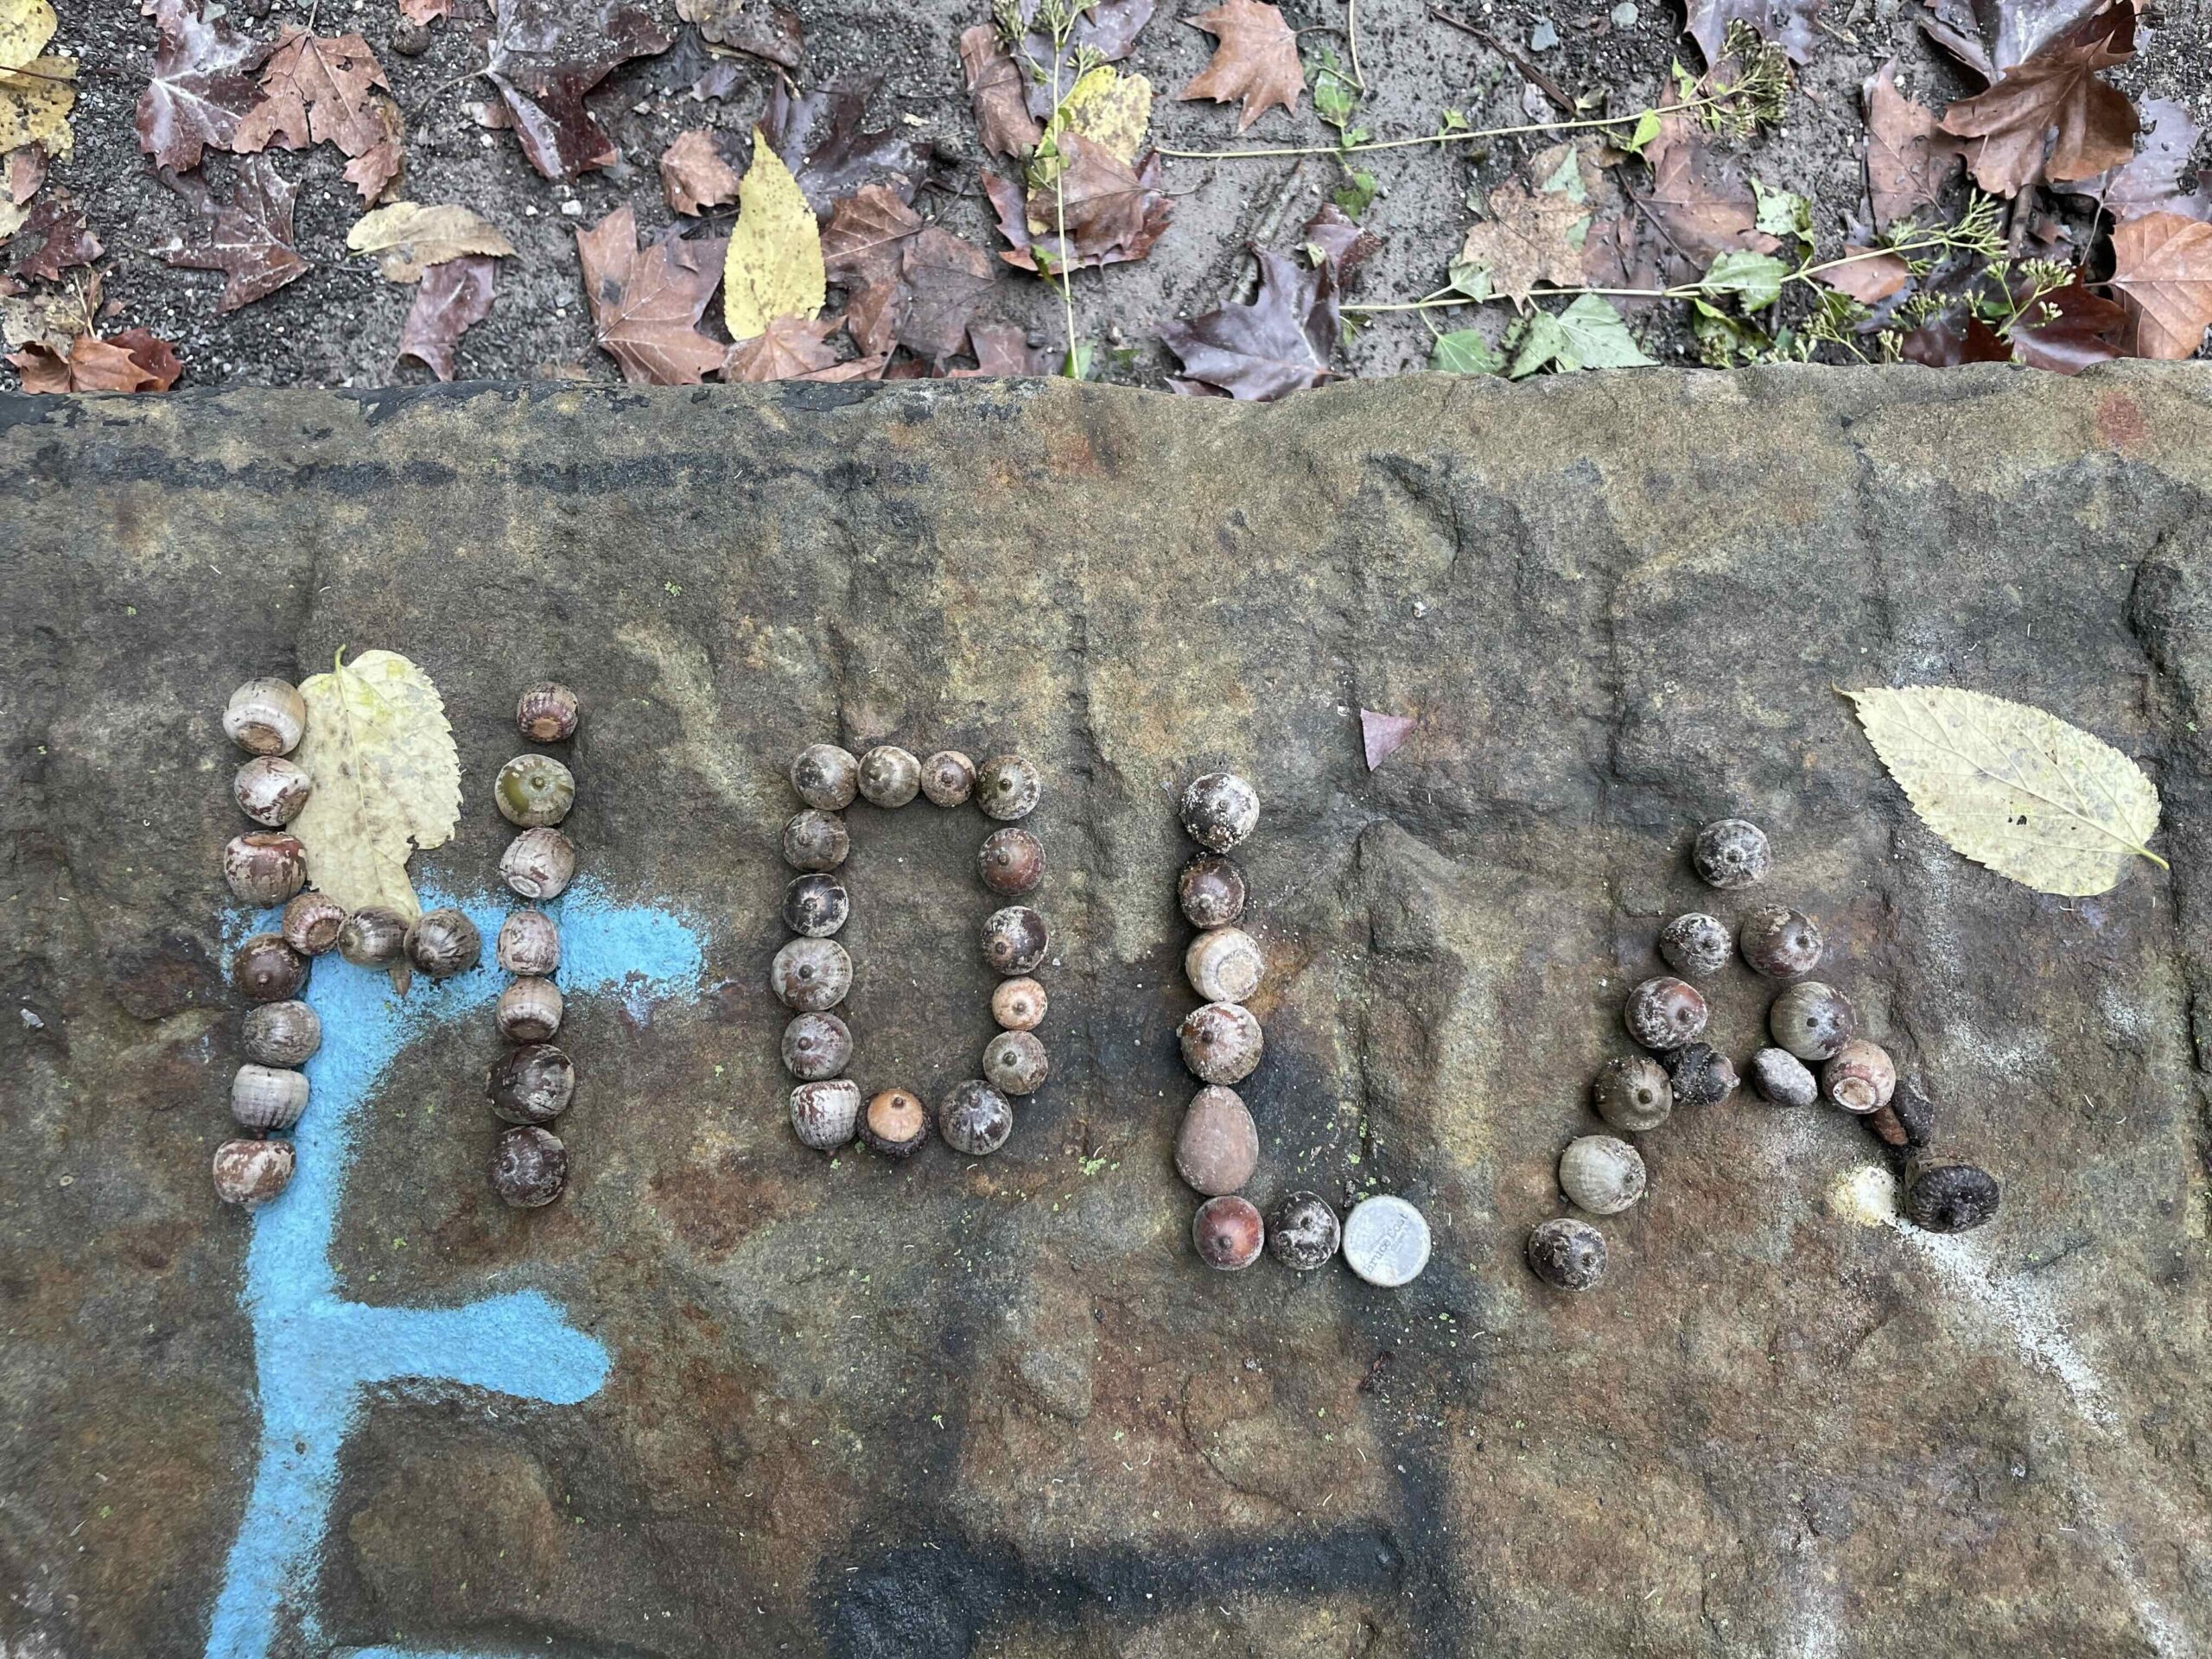
IMG_8475

Finally, I just want to express that I’ve enjoyed this project so much and am inspired to do more! I’m eager to investigate human behavior and non-human mysteries in the park. I’m eager to leave more messages for people; I want to capture more footage from my spot; and I want to make new and better videos from my collected footage! What if I could keep this going as the leaves changed colors? Today I also saw deer in front of this spot, unfortunately the trail cam did not capture them.

I’m excited about the acorn messages and have tried some alternative versions. I have also placed some on another bench a few minutes walk away.

-Kim

dead things in jars (and how to capture them)

TLDR: Tested ways to get high quality 3DGSplats of dead things. Thanks to Leo, Harrison, Nica, Rich, Golan for all the advice + help! Methods tested:

  1. iPhone 14 camera (lantern fly) -> ~30 jpegs
  2. iPhone 14 camera + macro lens attachment (lantern fly) -> ~350 jpegs, 180 jpegs
  3. Canon EOS R6 + macro lens 50mm f/1.8 (lantern fly) -> 464 jpegs, 312 jpegs
  4. Canon EOS R6 + macro lens 50mm f/1.8 (snake) -> 588 jpegs, 382 jpegs
  5. Canon EOS R6 + macro lens 50mm f/1.8 (axolotl) -> 244 jpegs
  6. Canon EOS R6 (snake) -> 1 mp4 7.56GB, 2 mp4 6.38GB
  7. Canon EOS R6 (rice) -> 1 mp4 4.26GB, 3 mp4 9.05GB
  8. Canon EOS R6 (rice) -> 589 jpegs
  9. Canon EOS R6 (axolotl) -> 3 mp4 5.94GB
  10. Canon EOS R6 (honey nuts) -> 2 mp4 3.98GB

I will admit that I didn’t have any research question. I only wanted to play around with some cool tools. I wanted to use the robot and take pictures with it. I quickly simplified this idea, due to time constraints and temporarily ‘missing’ parts, and took up Golan’s recommendation to work with the 3D Gaussian Splatting program Leo set up on the Studio’s computer in combo with the robot arm.

This solves the “how” part of my nonexistent research question. Now, all I needed was a “what”. Perhaps it was just due to the sheer amount of them (and how they managed to invade the sanctuary called my humble abode), but I had/have a small fixation on lantern flies. Thus, the invasive lantern fly became subject 00.

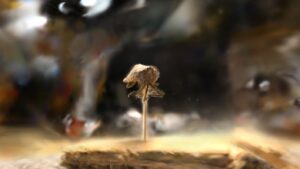
So I tested 3DGS out on the tiny little invader (a perfectly intact corpse found just outside the Studio’s door), using very simple capture methods aka my phone. I took about 30-50 images of the bug and then threw it into the EasyGaussian Python script.

Hmmm. Results are… questionable.

Same for this one here…

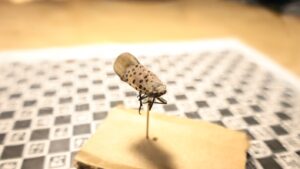
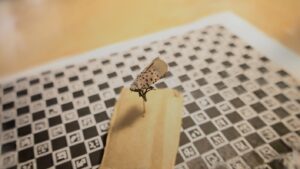
This warranted for some changes in capturing technique. First, do research on how others are capturing images for 3DGS. See this website and this Discord post, see that they’re both using turntables and immediately think that you need to make a turntable. Ask Harrison if the Studio has a Lazy Susan/turntable, realize that we can’t find it, and let Harrison make a Lazy Susan out of a piece of wood and cardboard (thank you Harrison!). Tape a page of calibration targets onto said Lazy Susan, stab the lantern fly corpse, and start taking photos.

Still not great. Realize that your phone and the macro lens you borrowed isn’t cutting it anymore, borrow a Canon EOS R6 from Ideate and take (bad) photos with low apertures and high ISO. Do not realize that these settings aren’t ideal and proceed to take many photos of your lantern fly corpse.

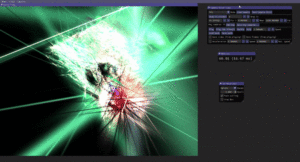
Doom scroll on IG and find someone doing Gaussian splats. Feel the inclination to try out what they’re doing and use PostShot to train a 3DGS.

Compare the difference between PostShot and the original program. These renderings felt like the limits of what 3DGS could do with simple lantern flys. Therefore, we change the subject to something of greater difficulty: reflective things.

Quote from Char Stiles article talking about Gaussian Splats. https://www.media.mit.edu/posts/splat/

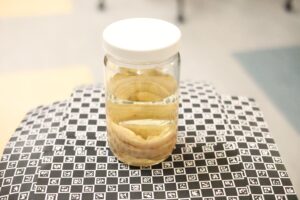
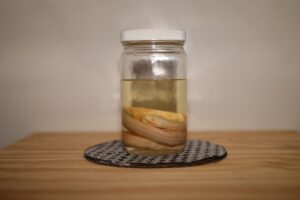
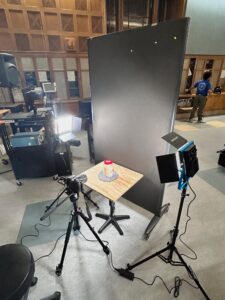
Ask to borrow dead things in jars from Professor Rich Pell, run to the Center for PostNatural History in the middle of a school day, run back to school, and start taking photos of said dead things in jars. Marvel at the dead thing in the jar.

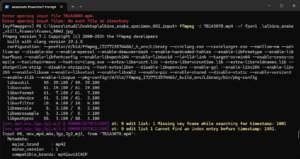
Figure out that taking hundreds of photos takes too long, and start taking videos because photos take too long to take. Take the videos, run it through ffmpeg, splice out the frames and run the 3DGS on those frames.

I think the above three videos are the most successful examples of 3DGS in this project. They achieve the clarity I was hoping for and the allow you to view the object from multiple different angles.

The following videos are some recordings of interesting results and process.


Reflection:
I think this method of capturing objects only really yields itself to be presented in real time via a virtual reality/experience or video run-throughs of looking at the object in virtual 3D space. I will say that this gives the affordance of allowing you to look at the reflective object in multiple different POVs. I think during this process of capturing, I really enjoyed being able to view the snake and axolotl in different perspectives. In the museum setting, you’re only really able to view it from a couple perspectives, especially since these specimens are behind a glass door (due to their fragility). It would be kinda cool to be able to see various specimens up close and from various angles.

I think I had a couple of learning curves, with the camera, software, and preprocessing of input data. I made some mistakes with the aperture and ISO settings, leading to noisy data. Also could’ve speed up my workflow by going the video-to-frames route sooner.

I would like to pursue my initial ambitions of using the robot arm. First, it would probably regularize the frames in the video. Second, I’m guessing that the steadiness of preprogramed motion will help decrease motion blur, something I ended up capturing but was too lazy to get rid of in my input set. Third, lighting is still a bit of a challenge. I think 3DGS requires that the lighting relative to the object must stay constant the entire time. Overall, I think this workflow needs to be used on a large dataset and to create some sort of VR museum of dead things in jars.

To Do List:

  • Get better recordings/documentation of the splats -> I need to learn how to use the PostShot software for fly throughs.
  • House these splats in some VR for people to look at from multiple angles at your own leisure. And clean them up before uploading them to a website. Goal is to make a museum/library of dead things (in jars) -> see this.
  • Revisit failure case: I think it would be cool to paint these splats onto a canvas, sort of using the splat as a painting reference.
  • Automate some of the workflow further: parse through frames from video and remove unclear images, work with robot,
  • More dead things in jars! Pickles! Mice! More Snakes!

Separating the Work from the Surface: Typology of CFA Cutting Mats

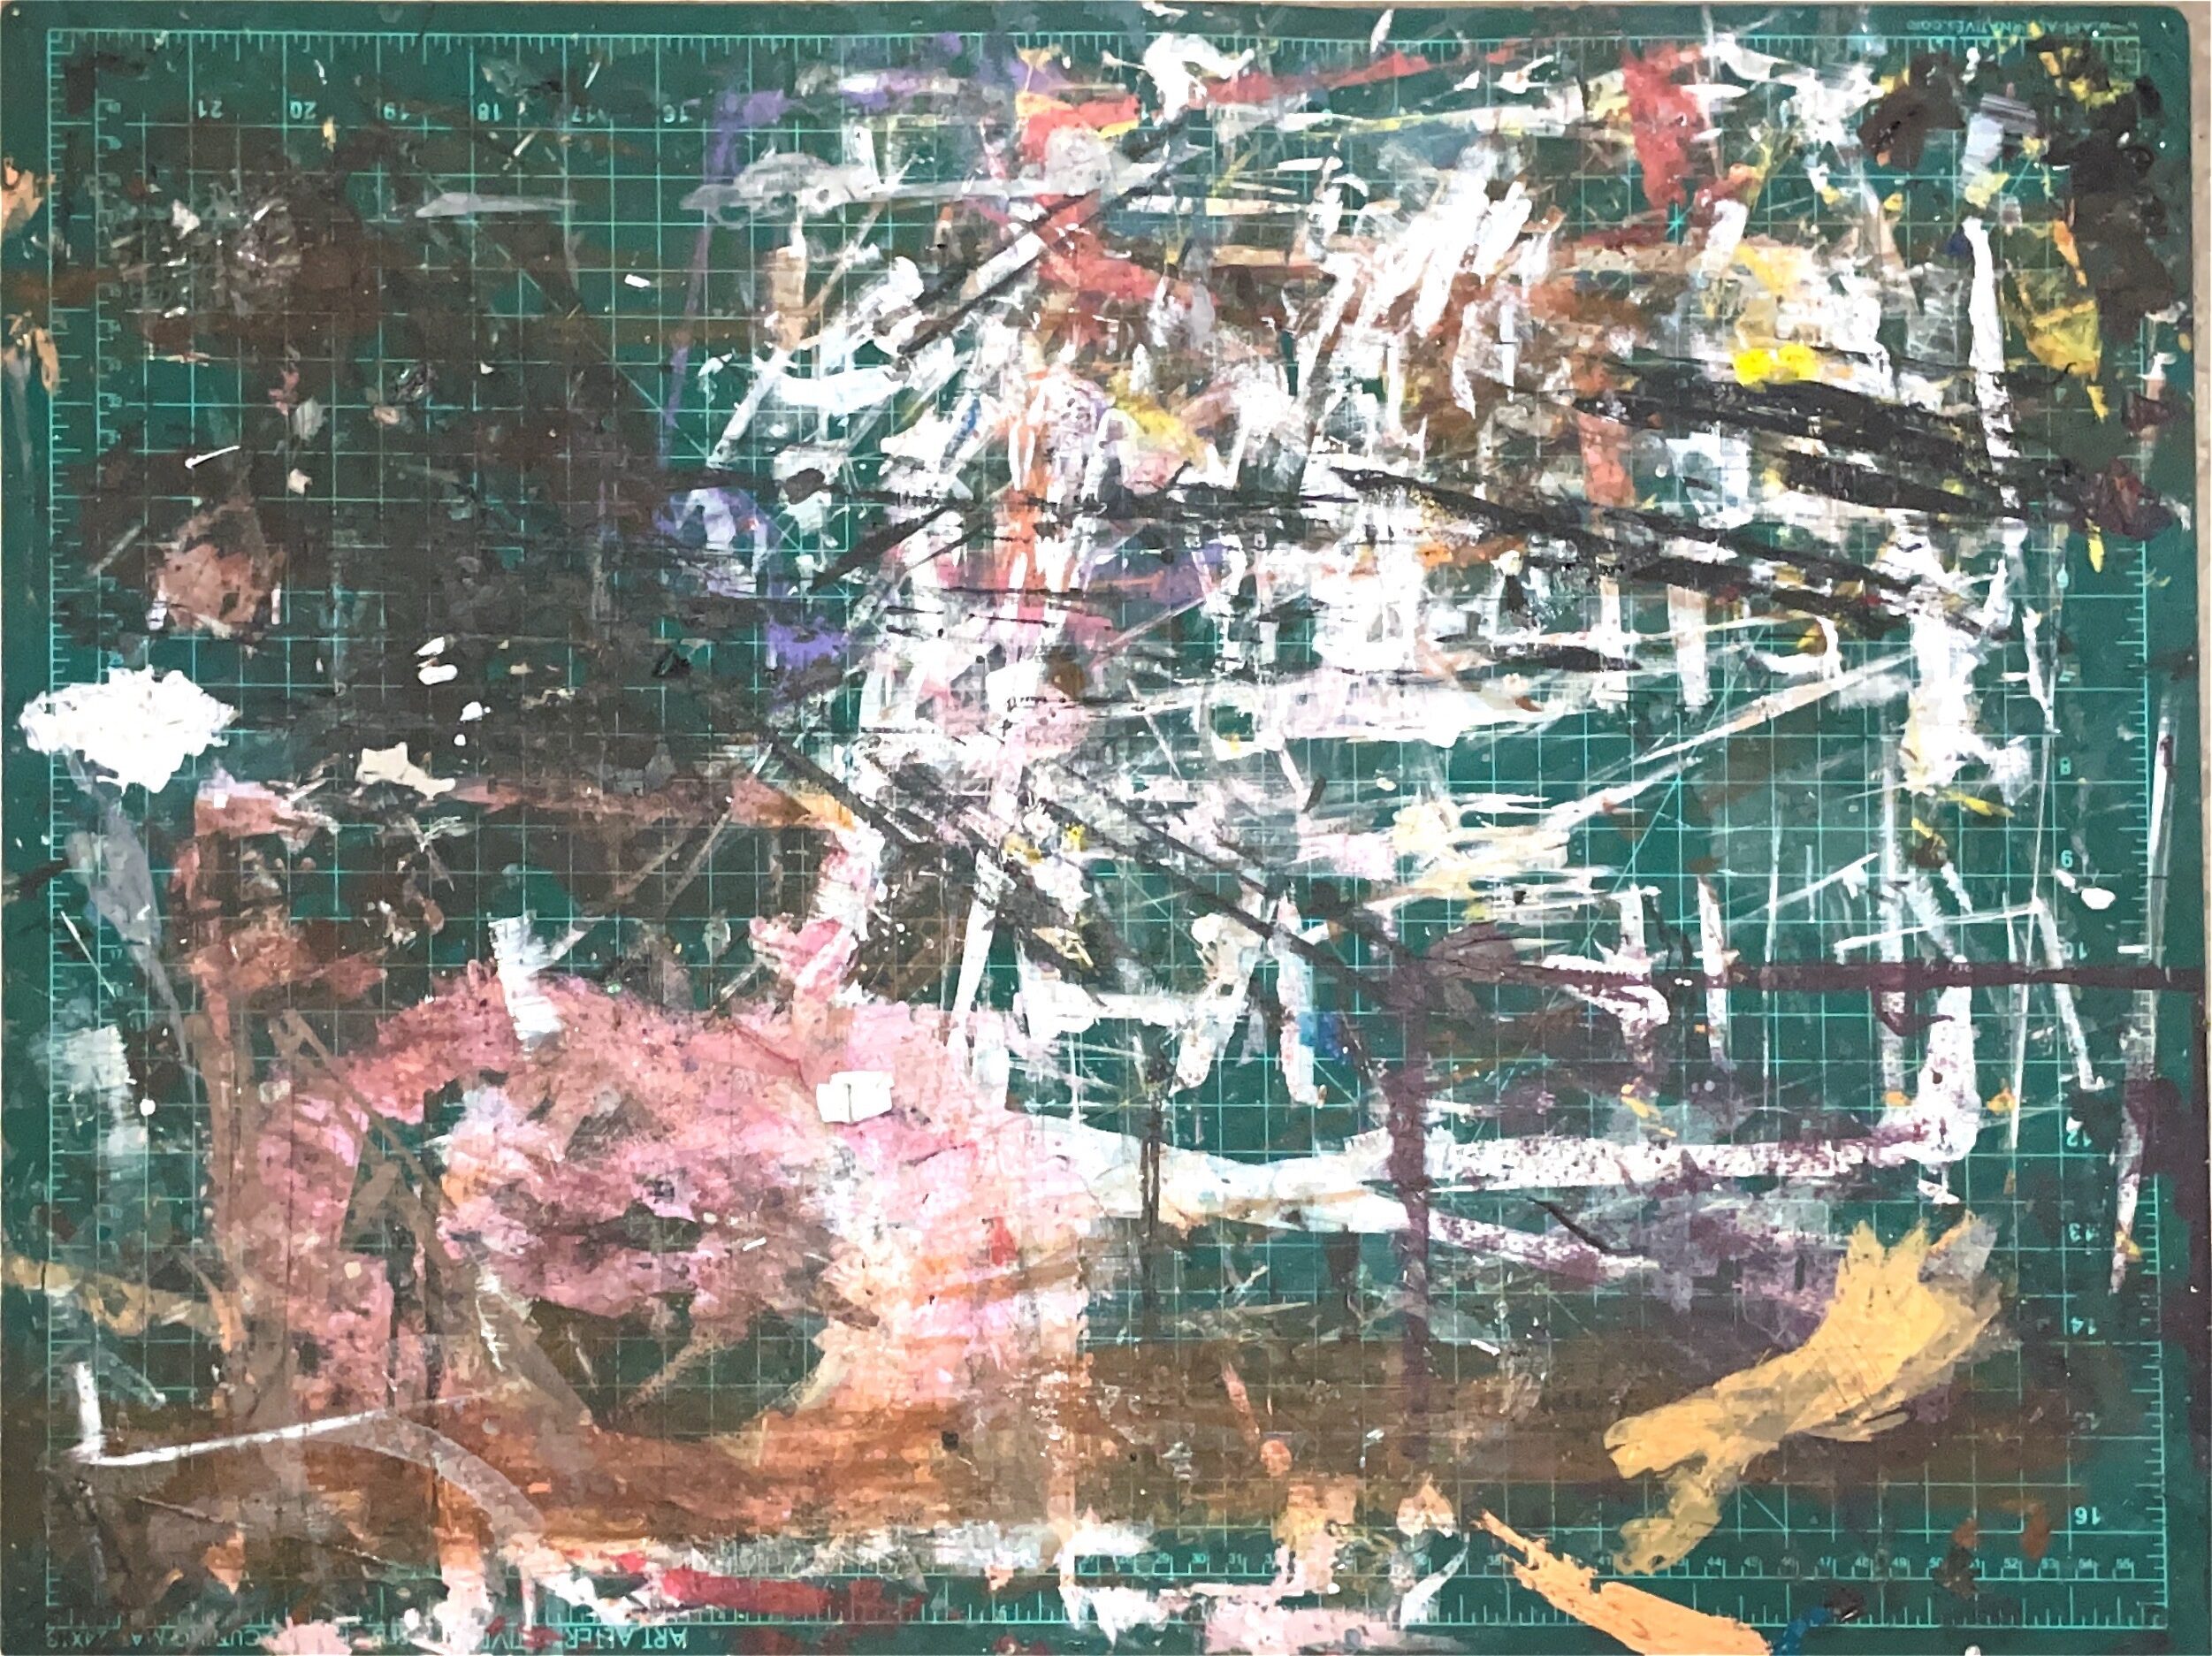
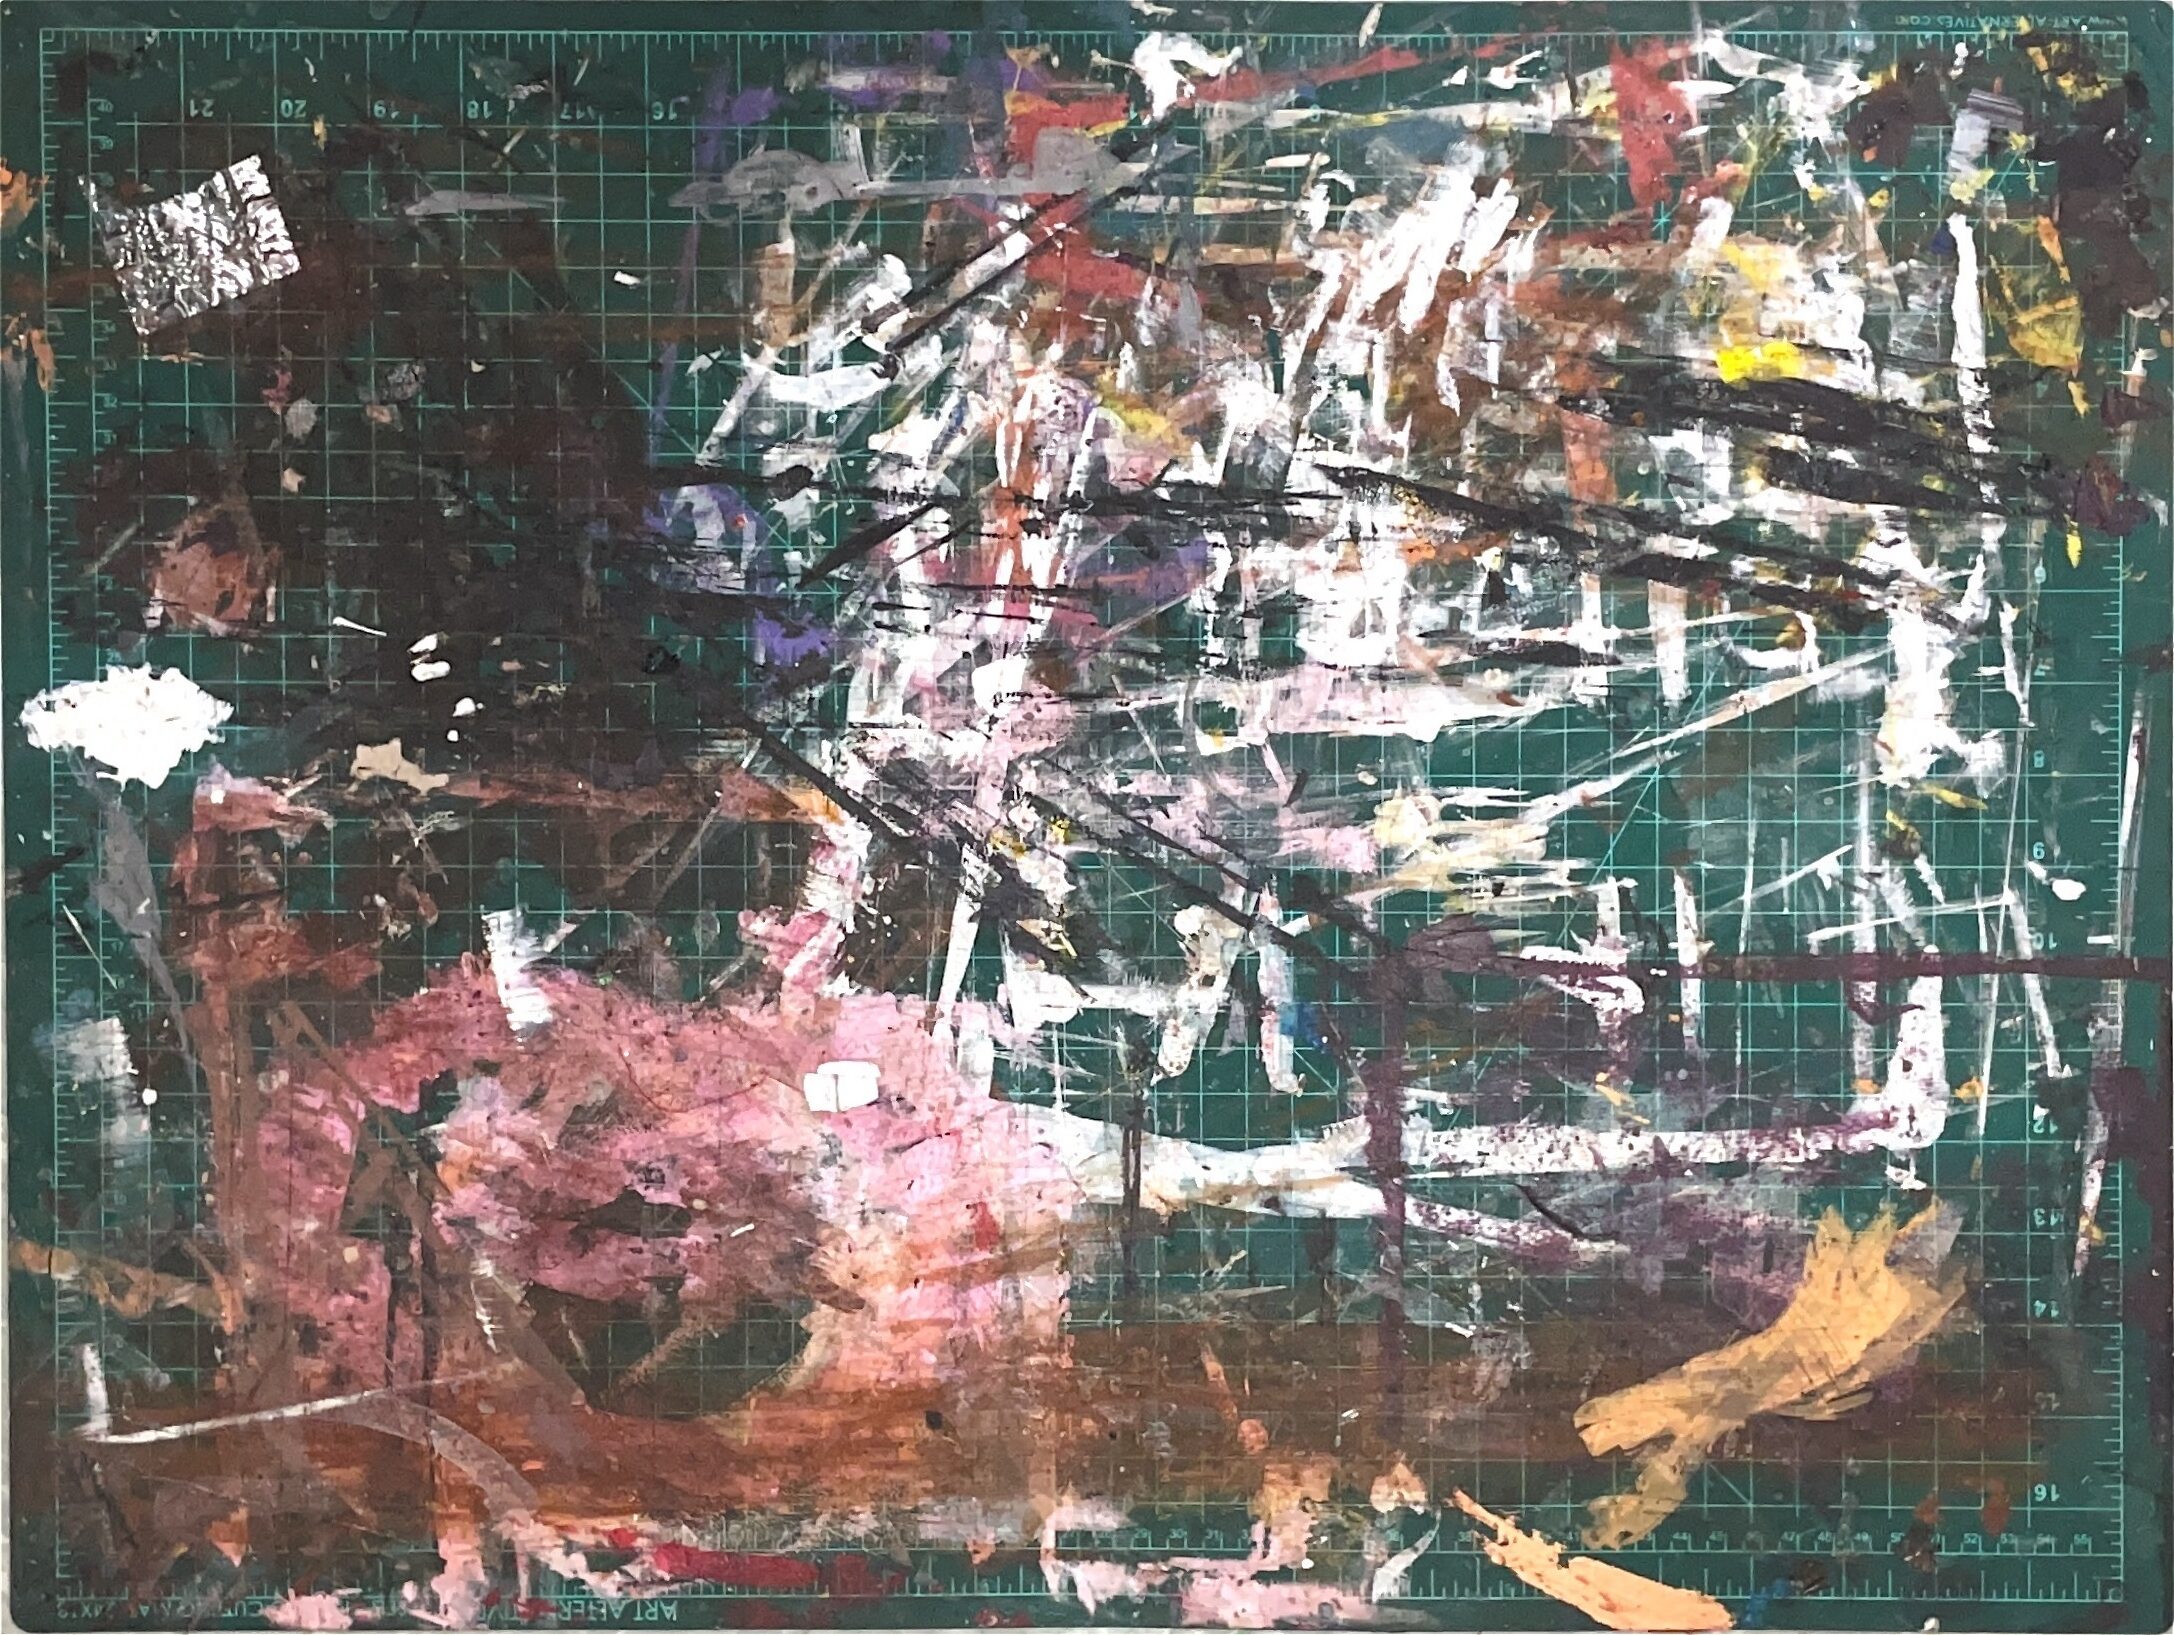
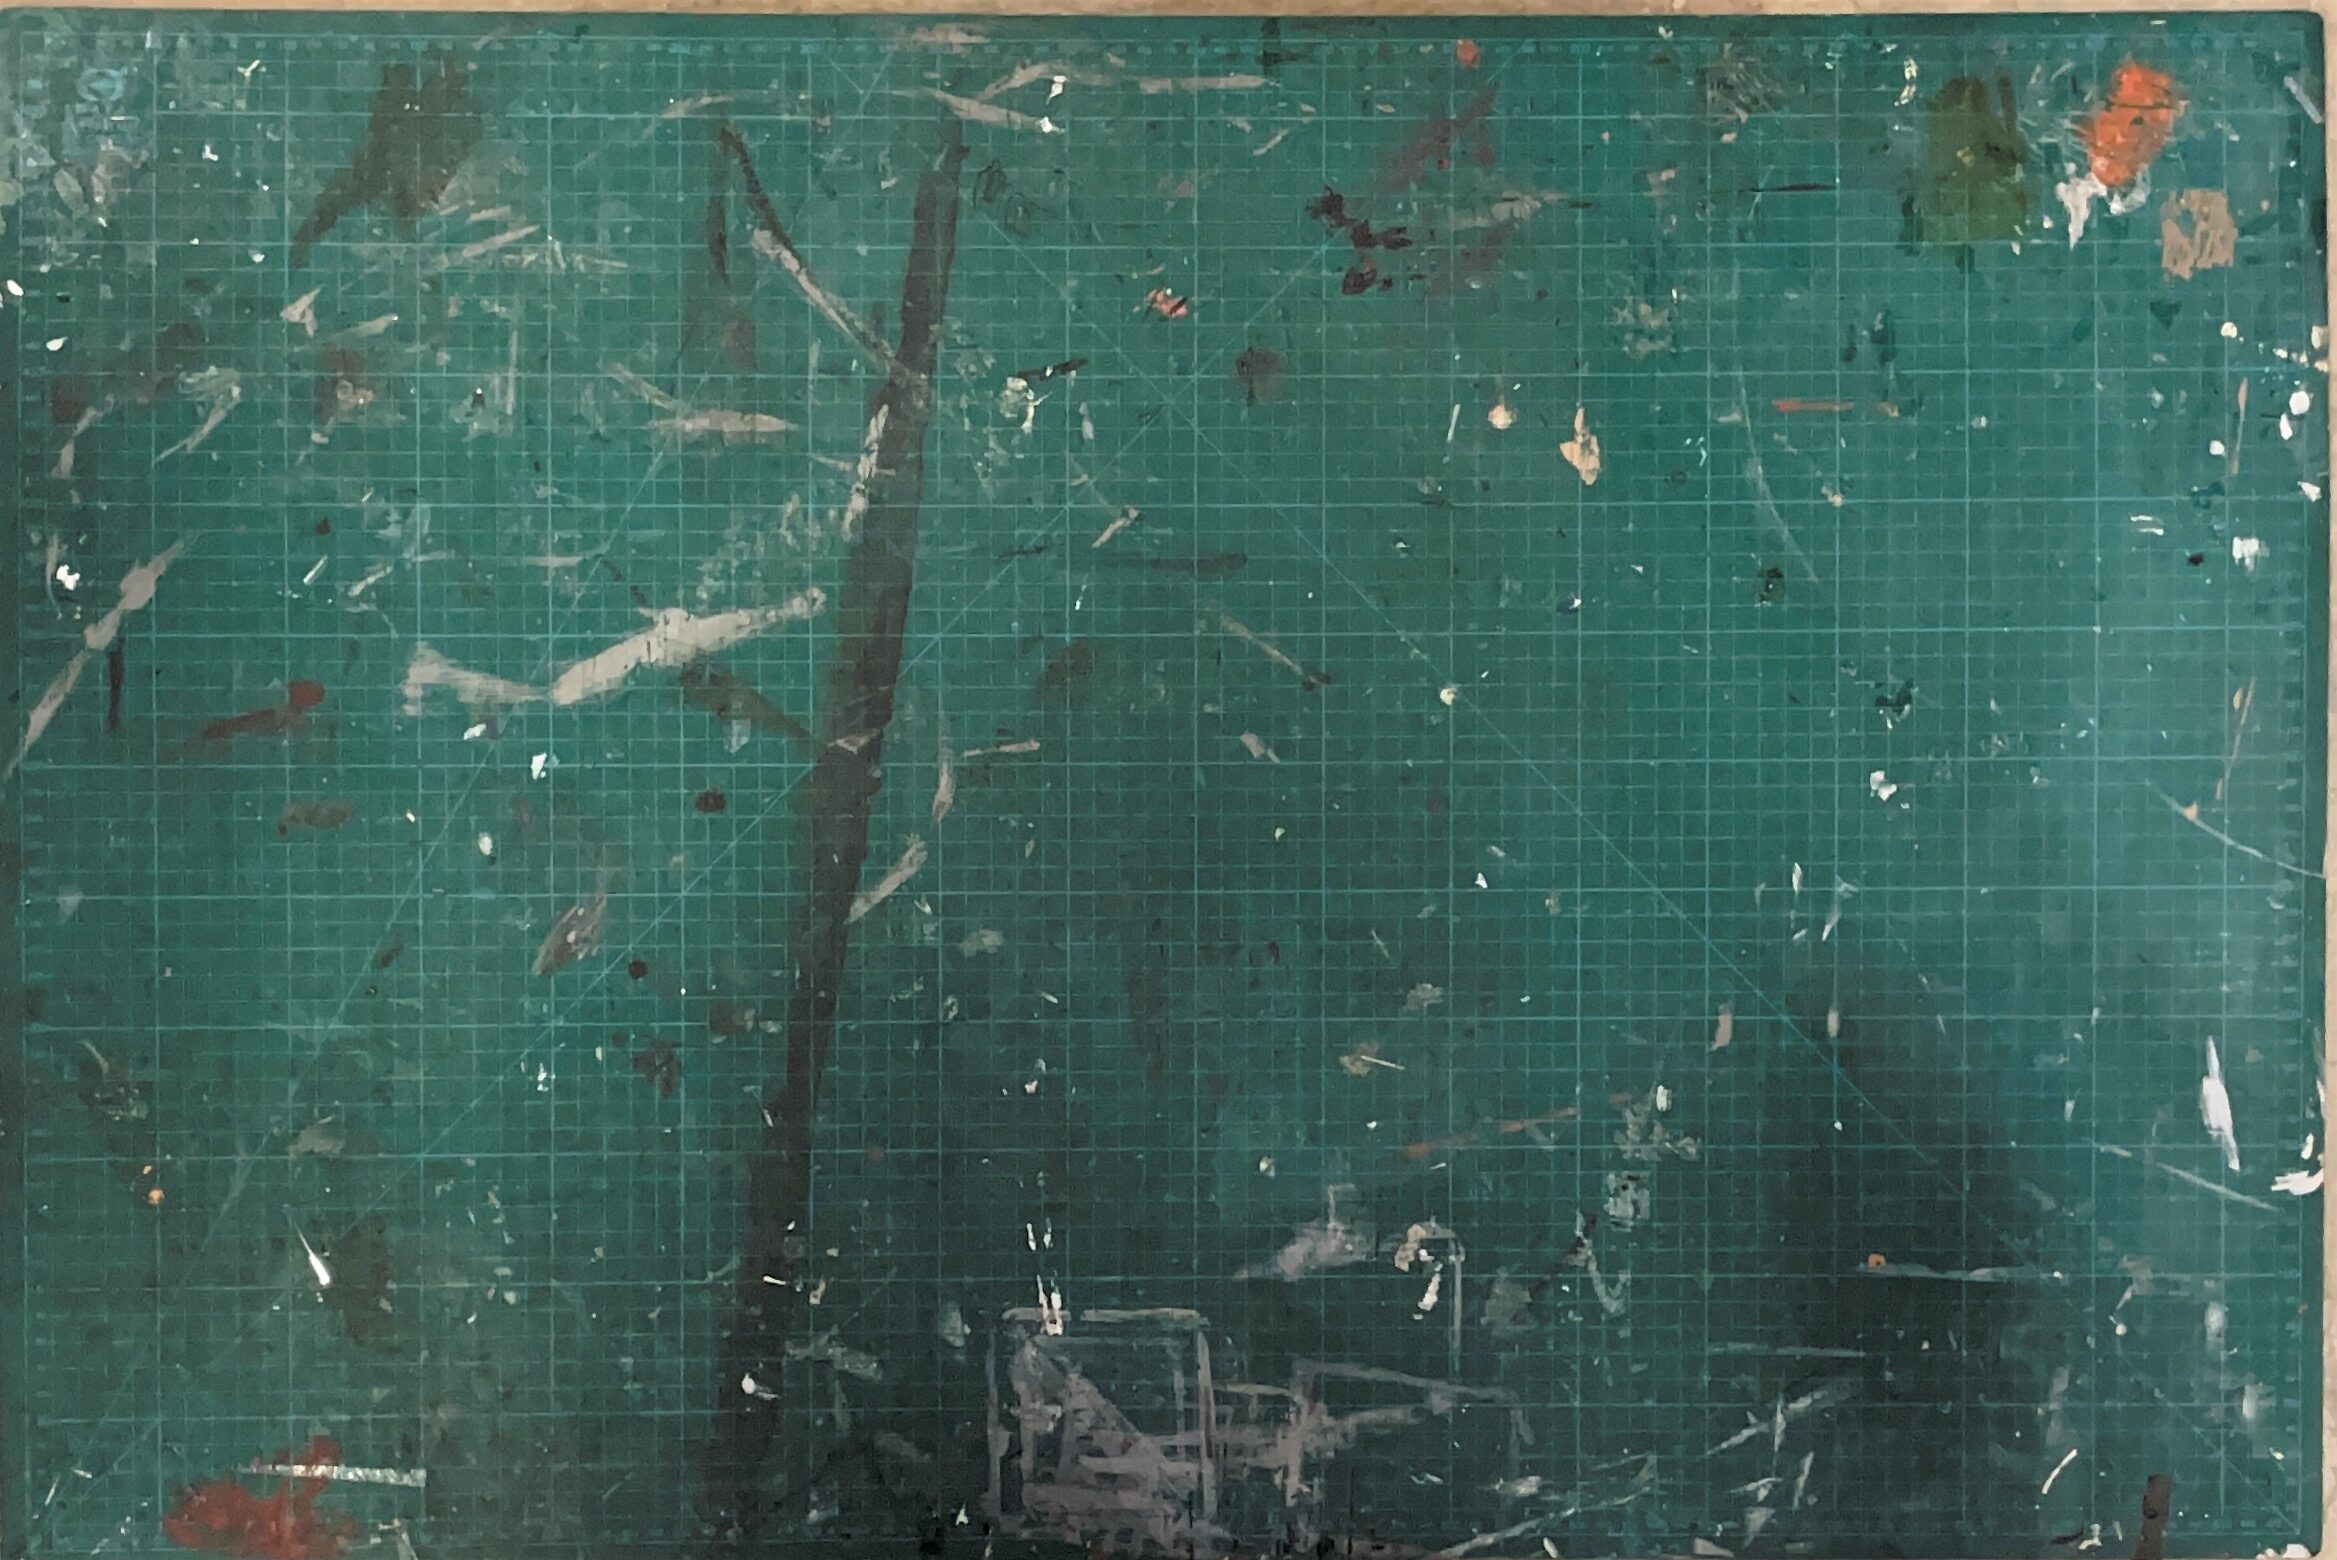
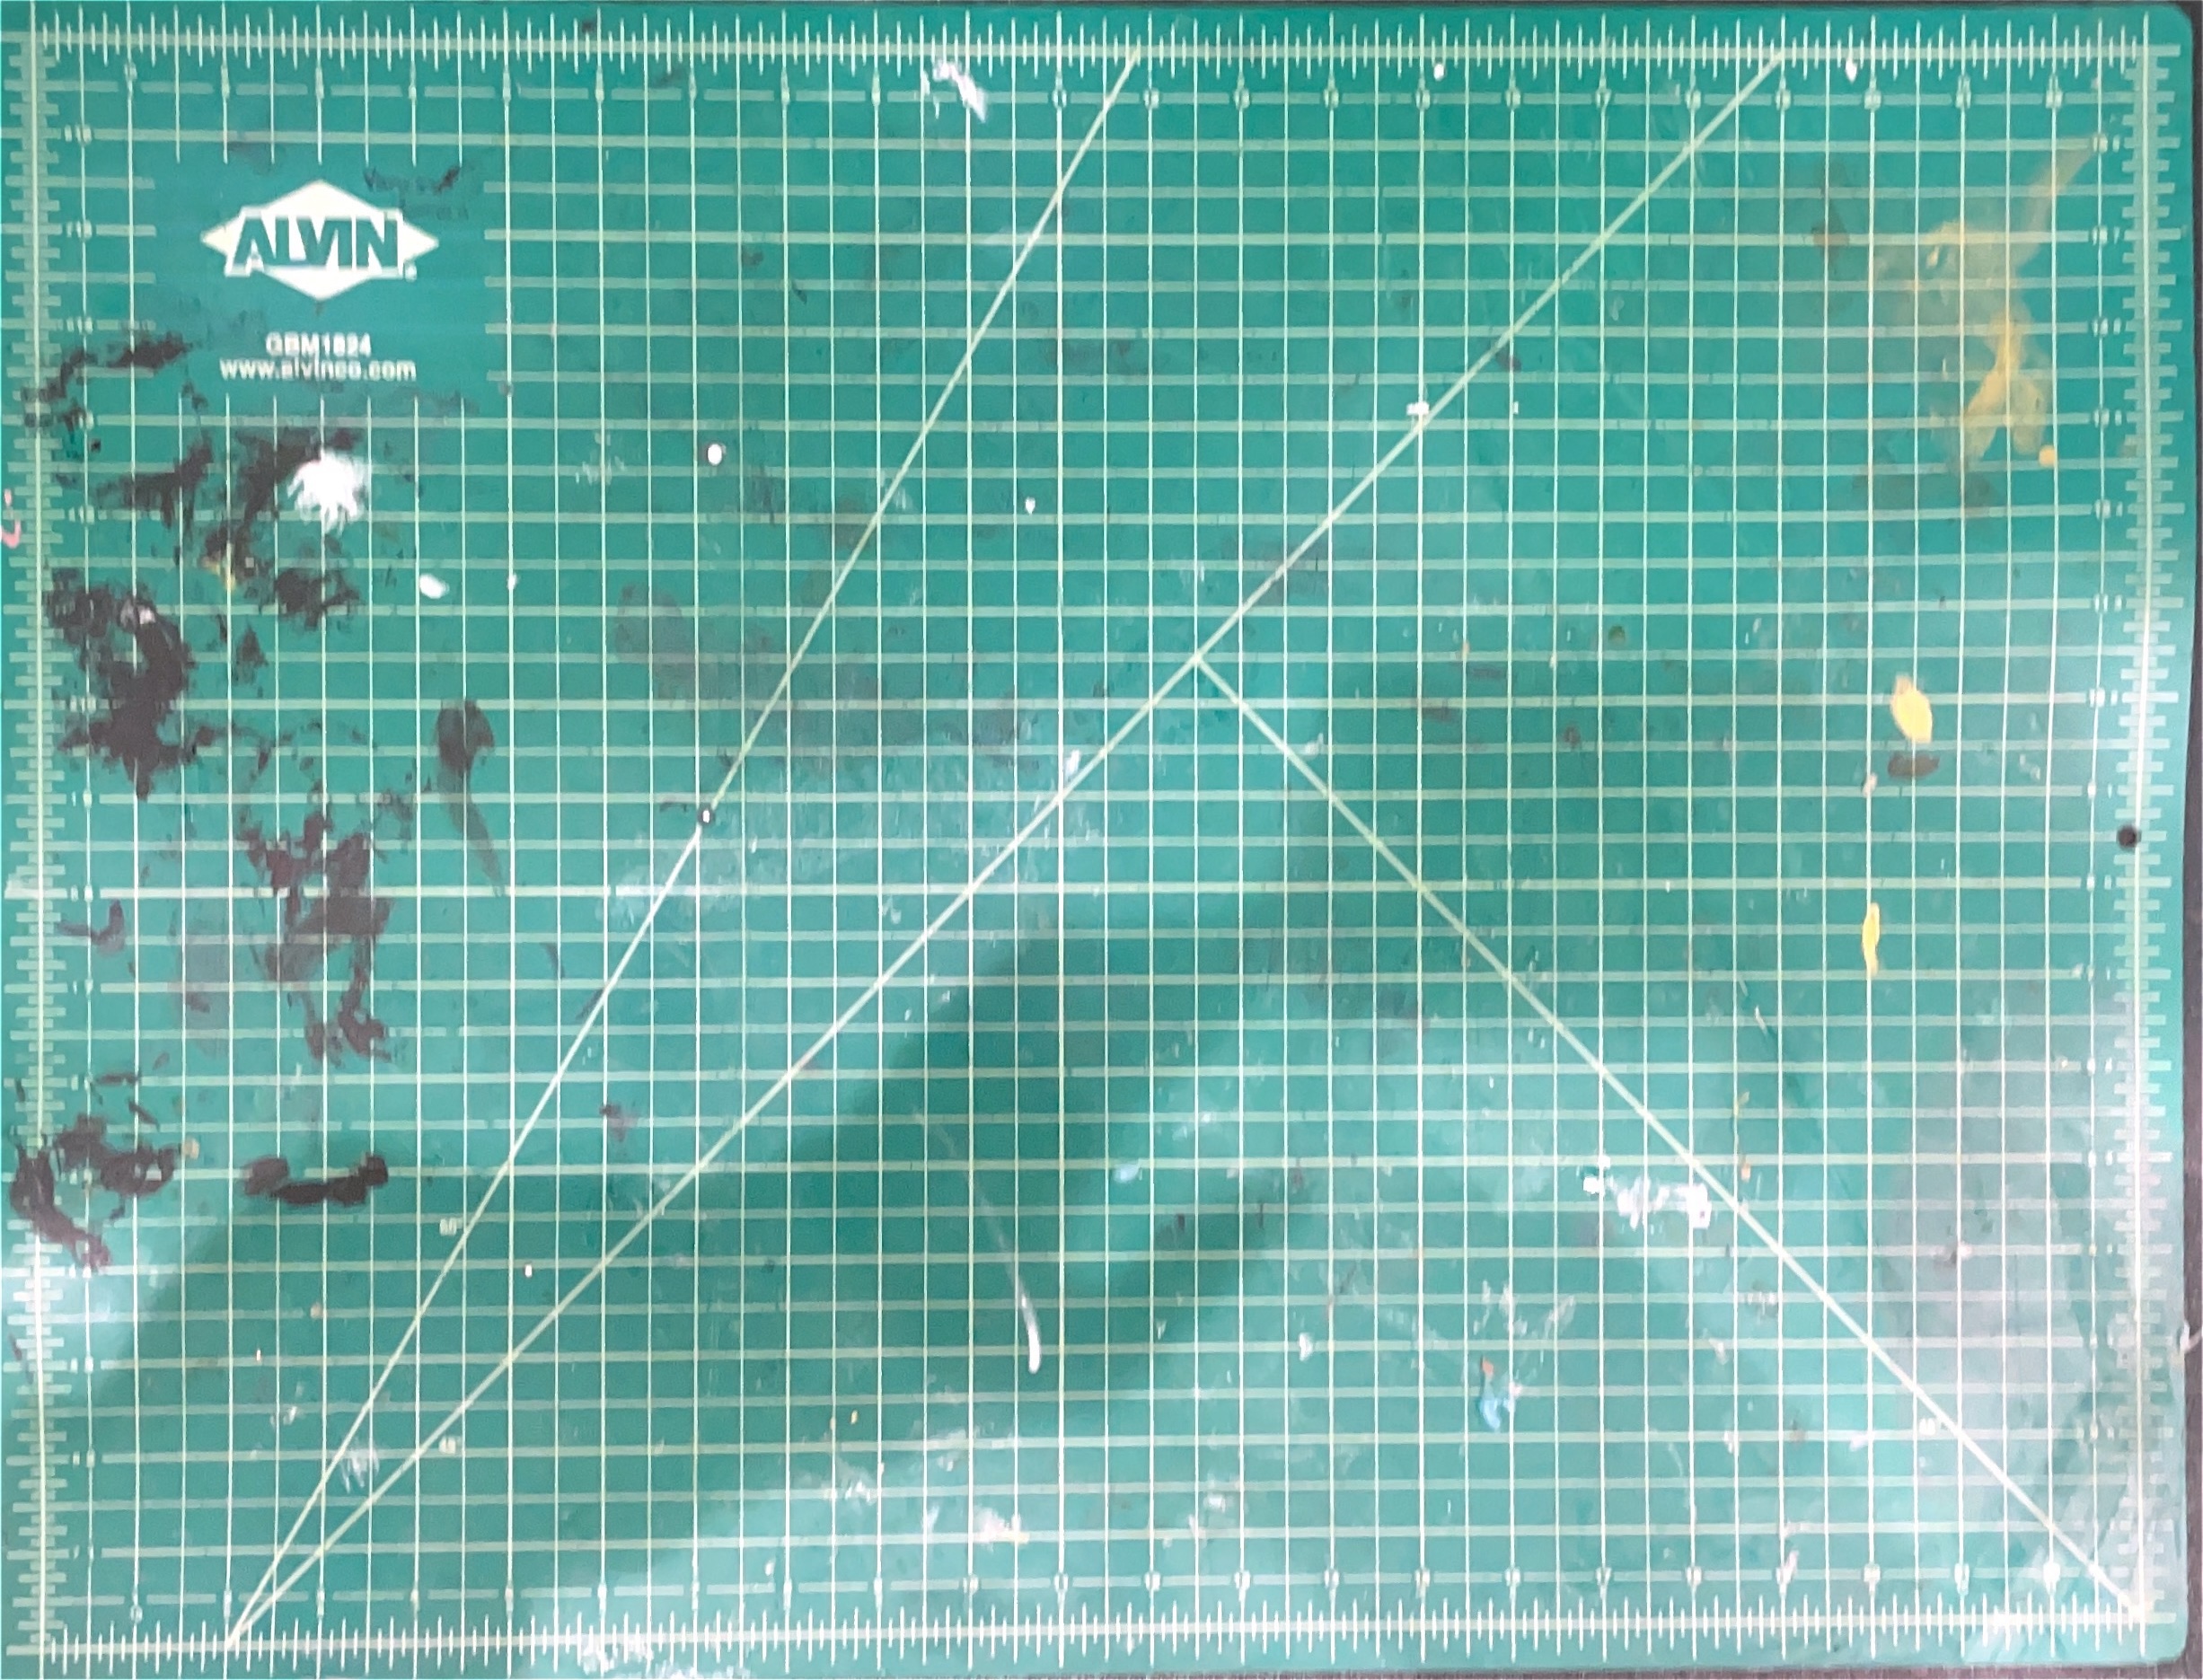
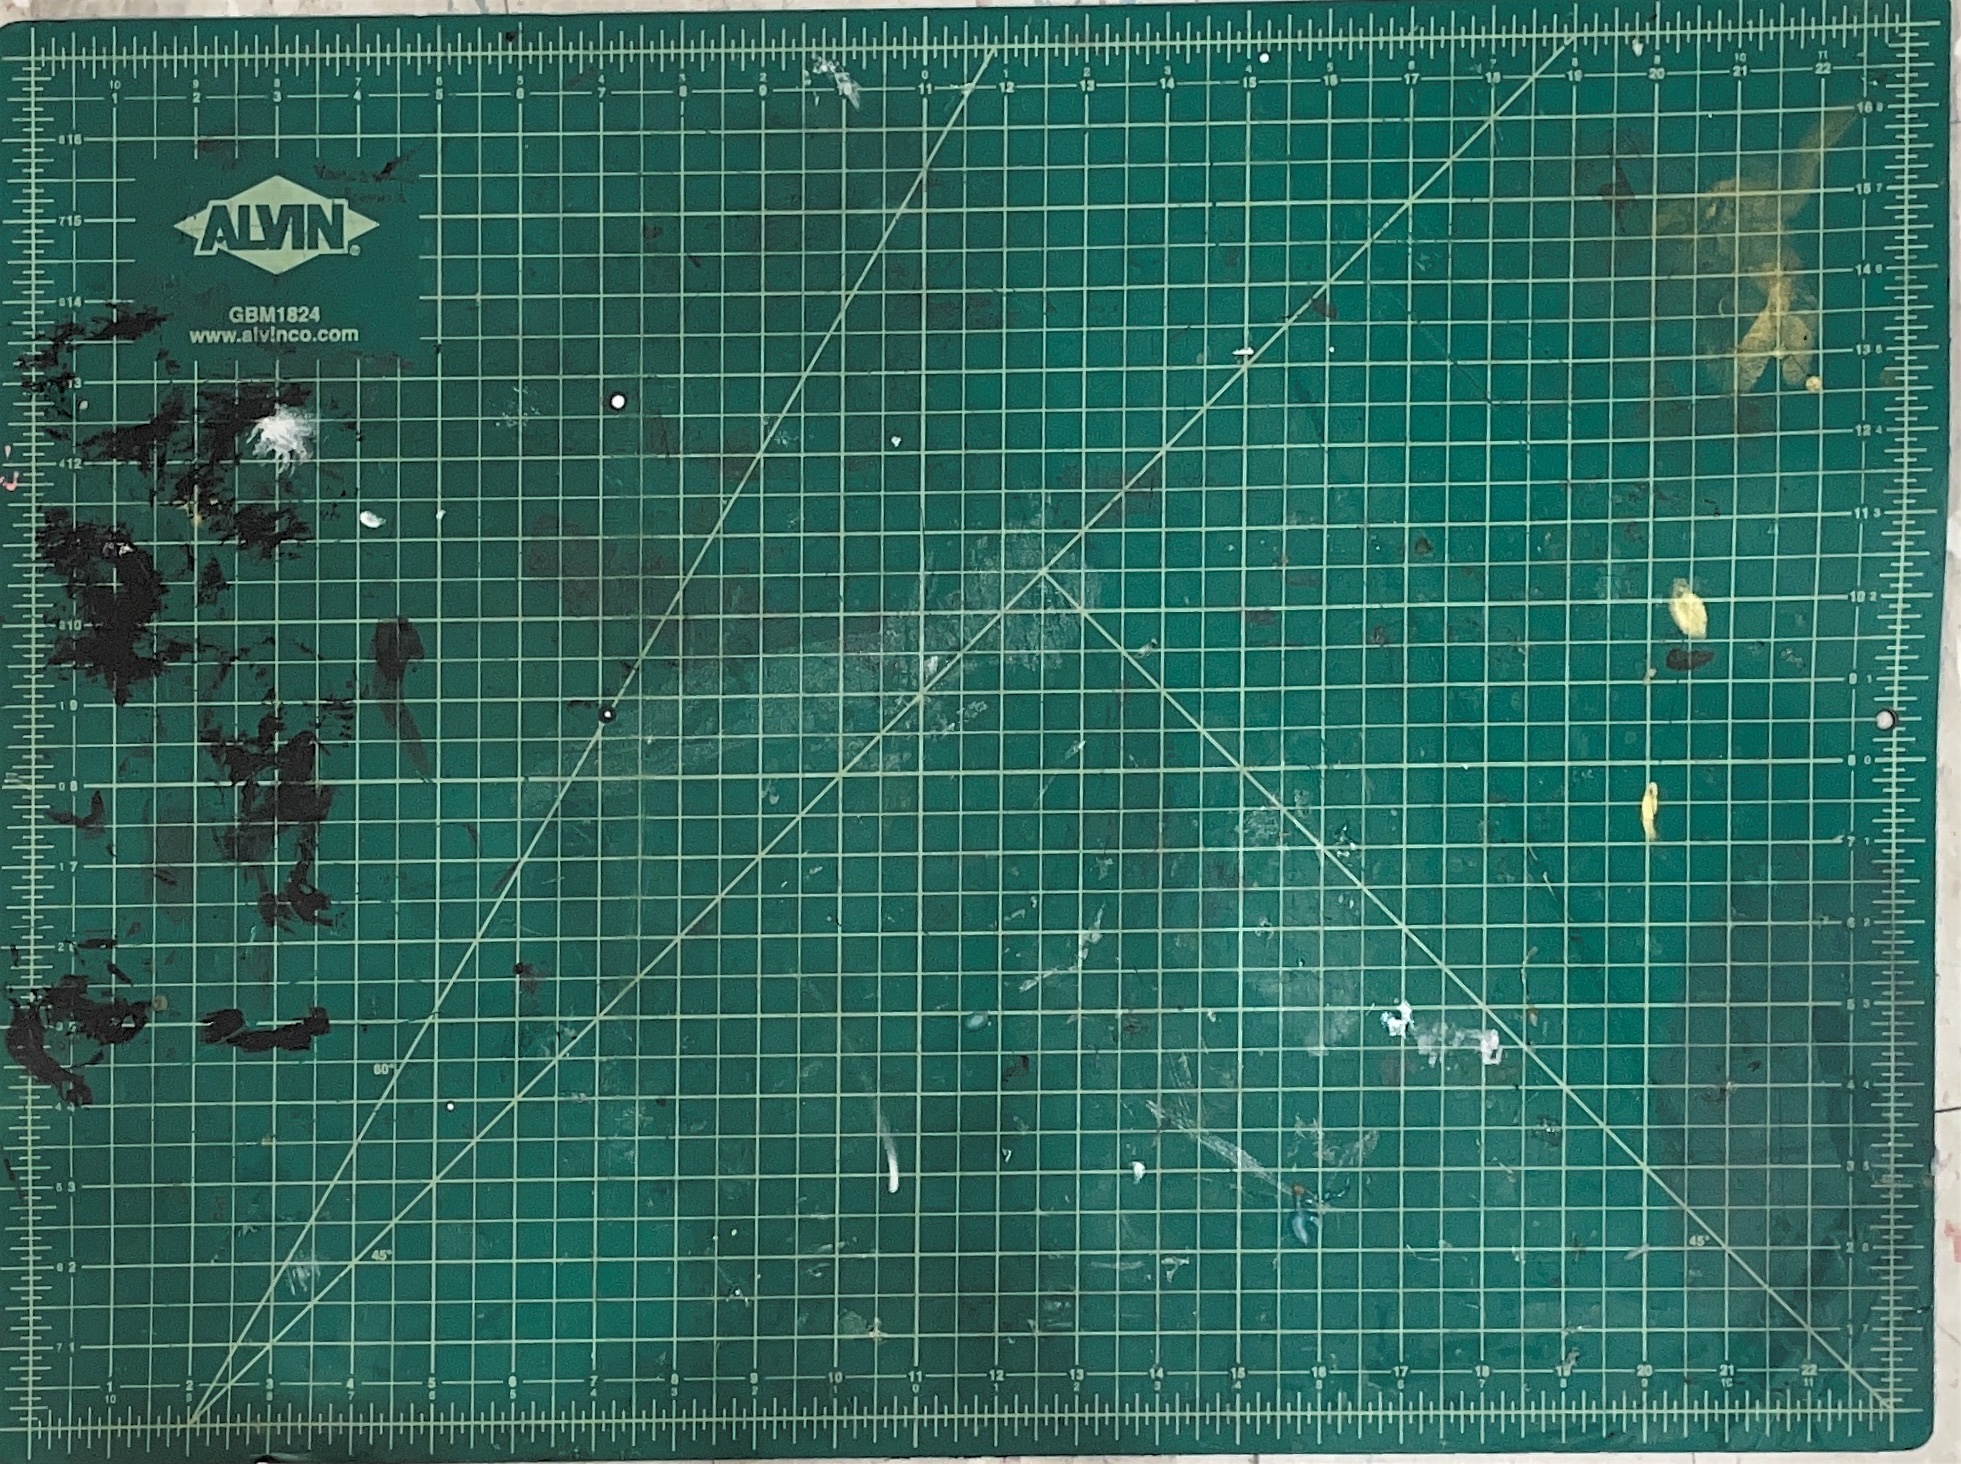
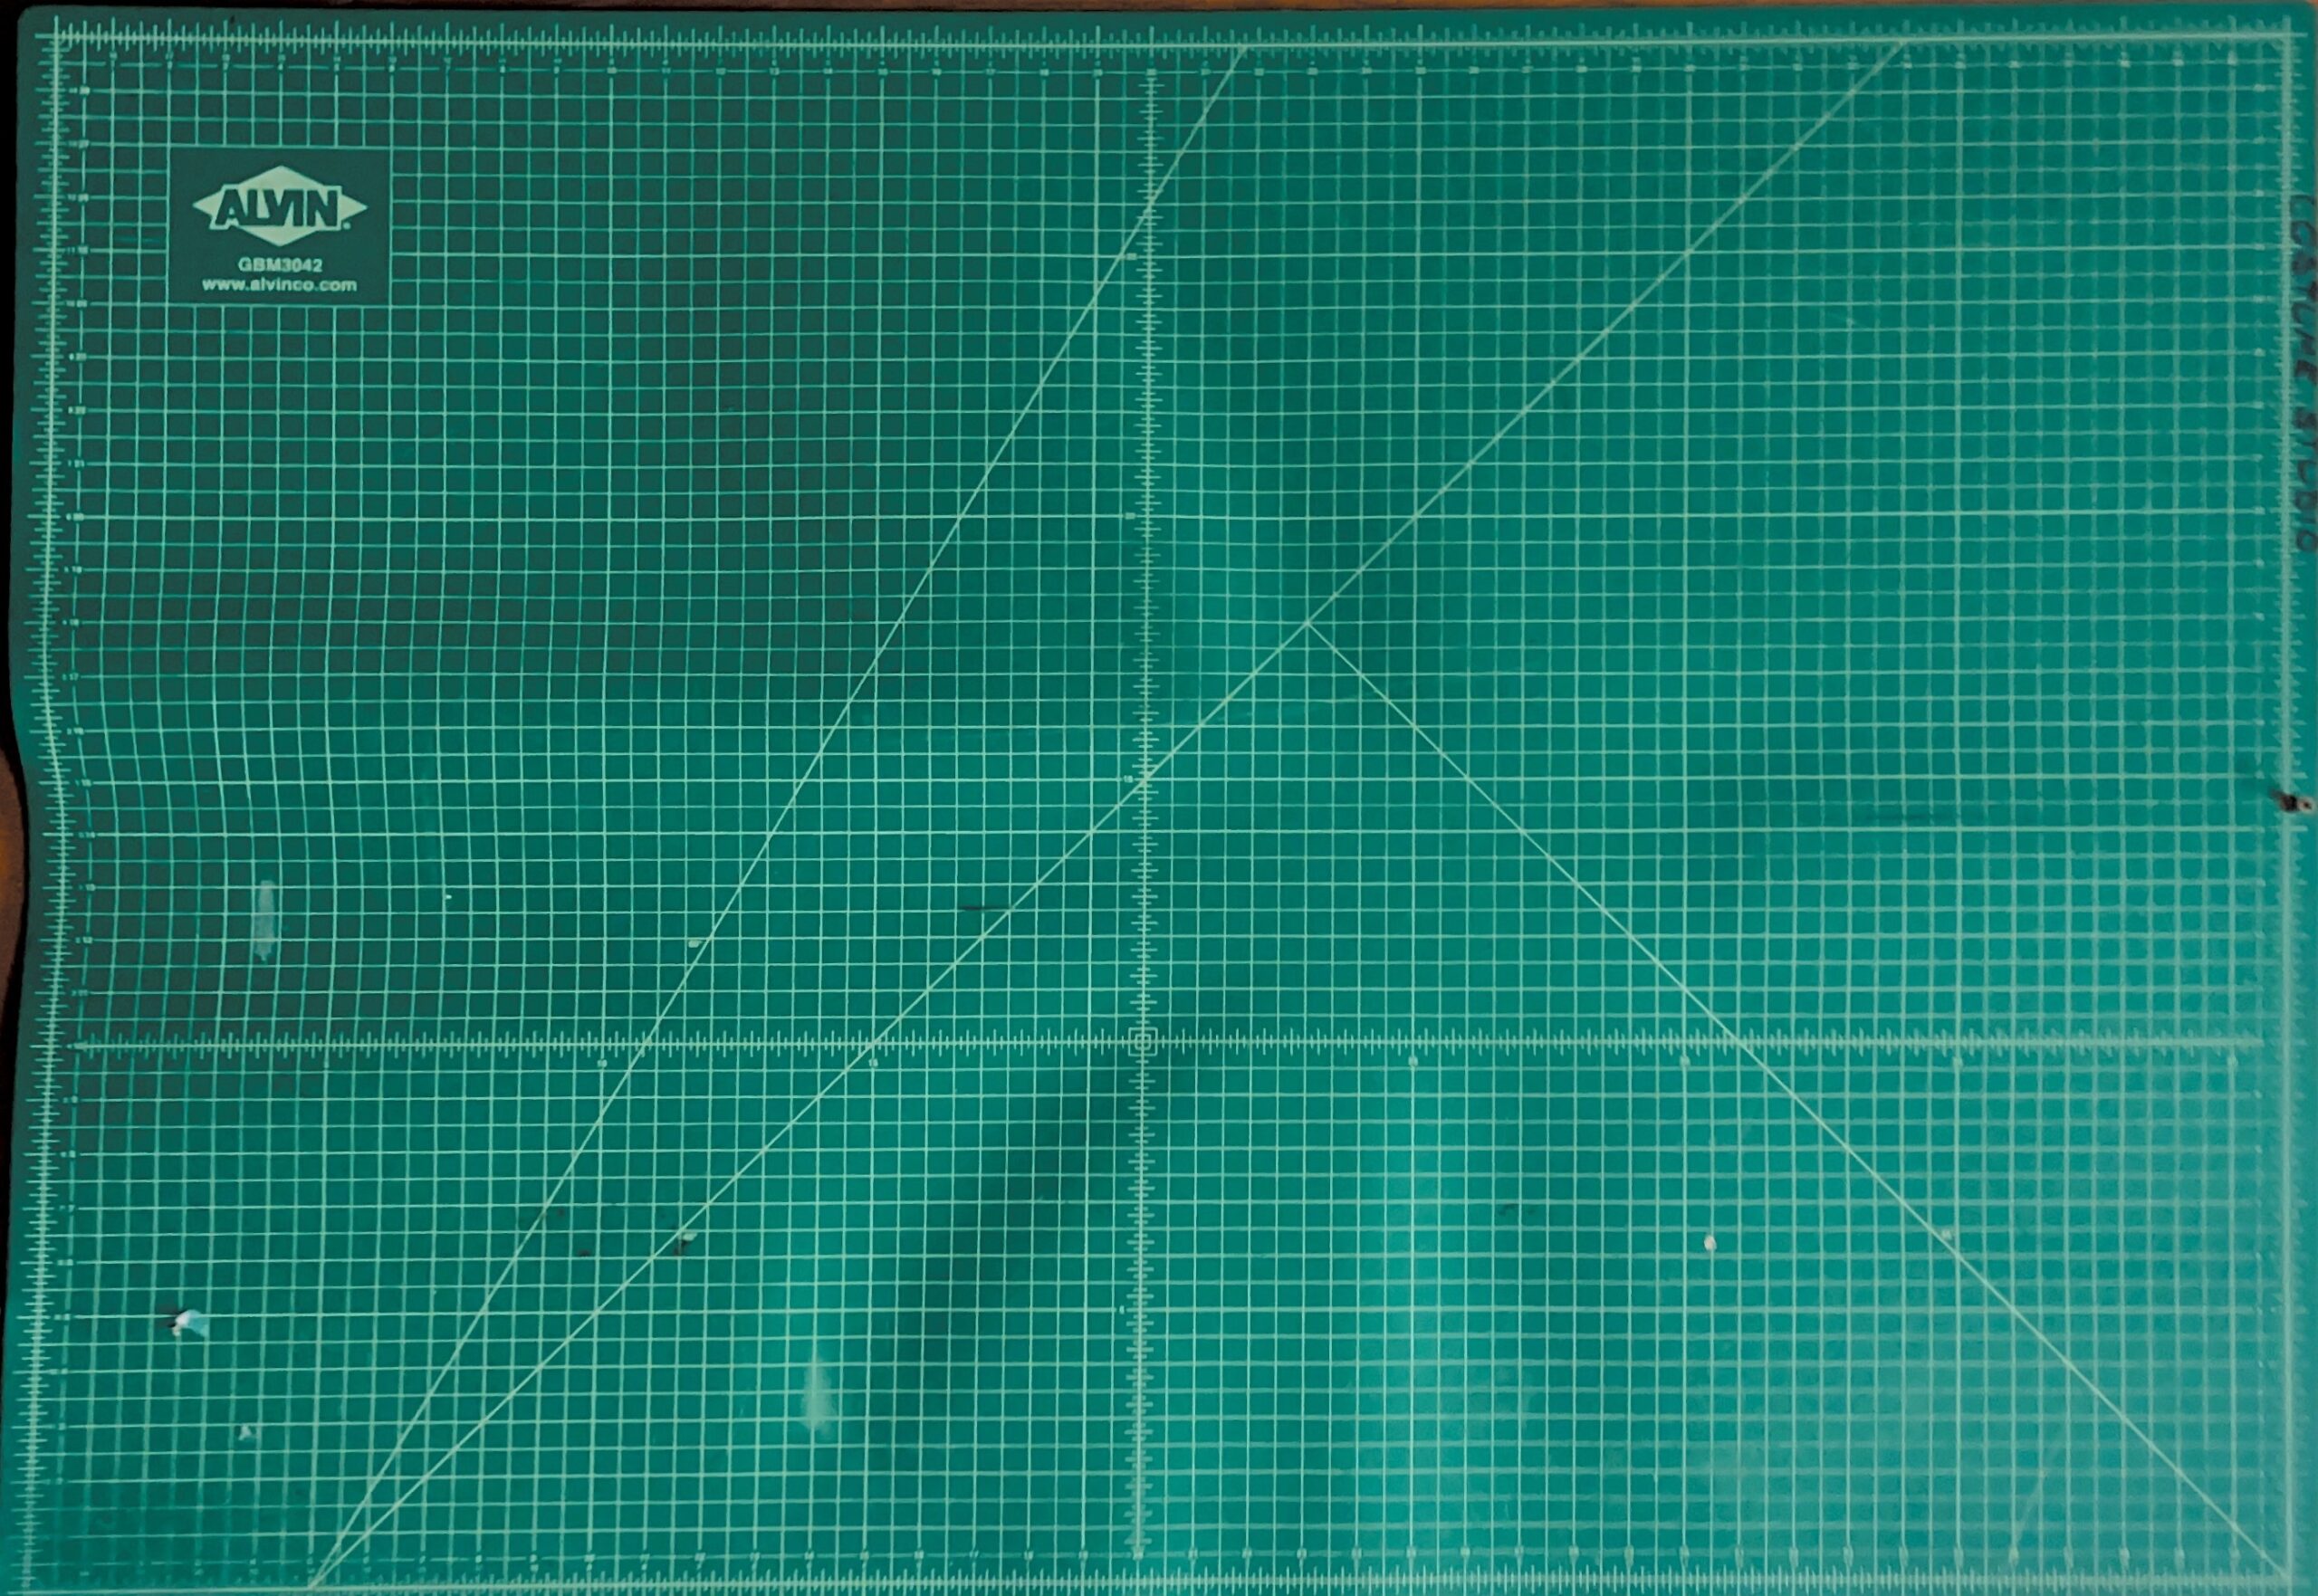
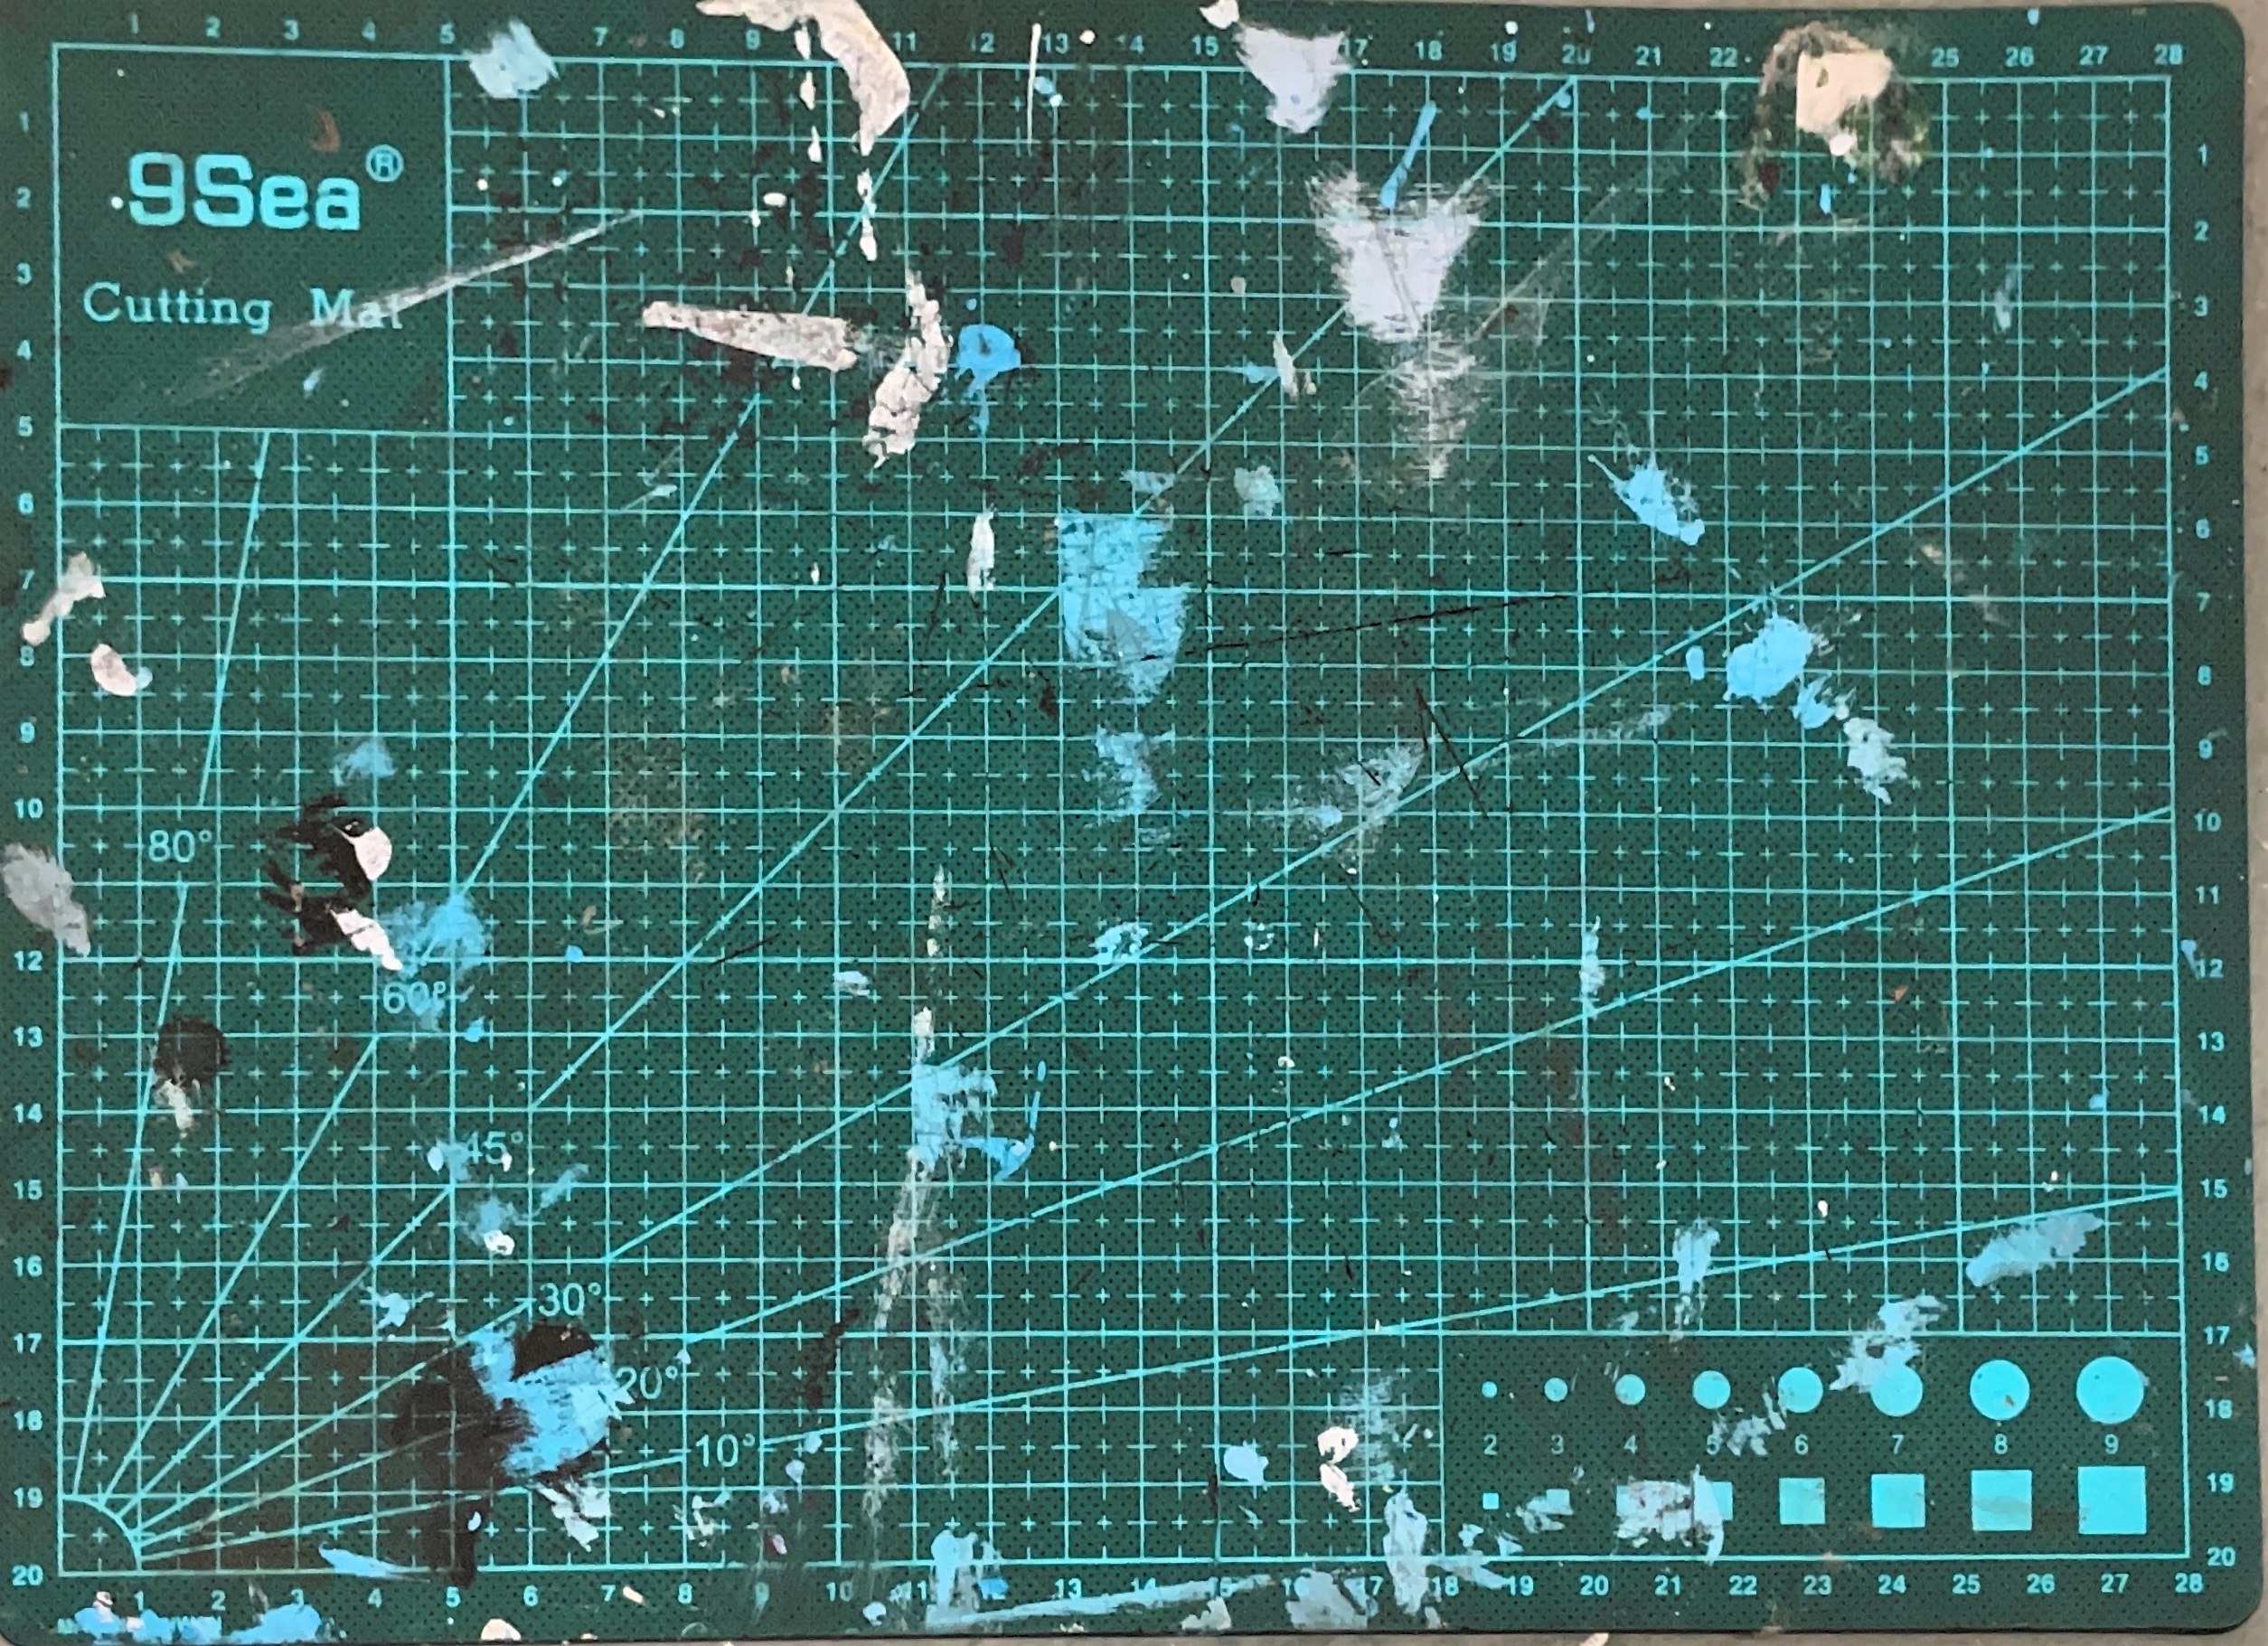
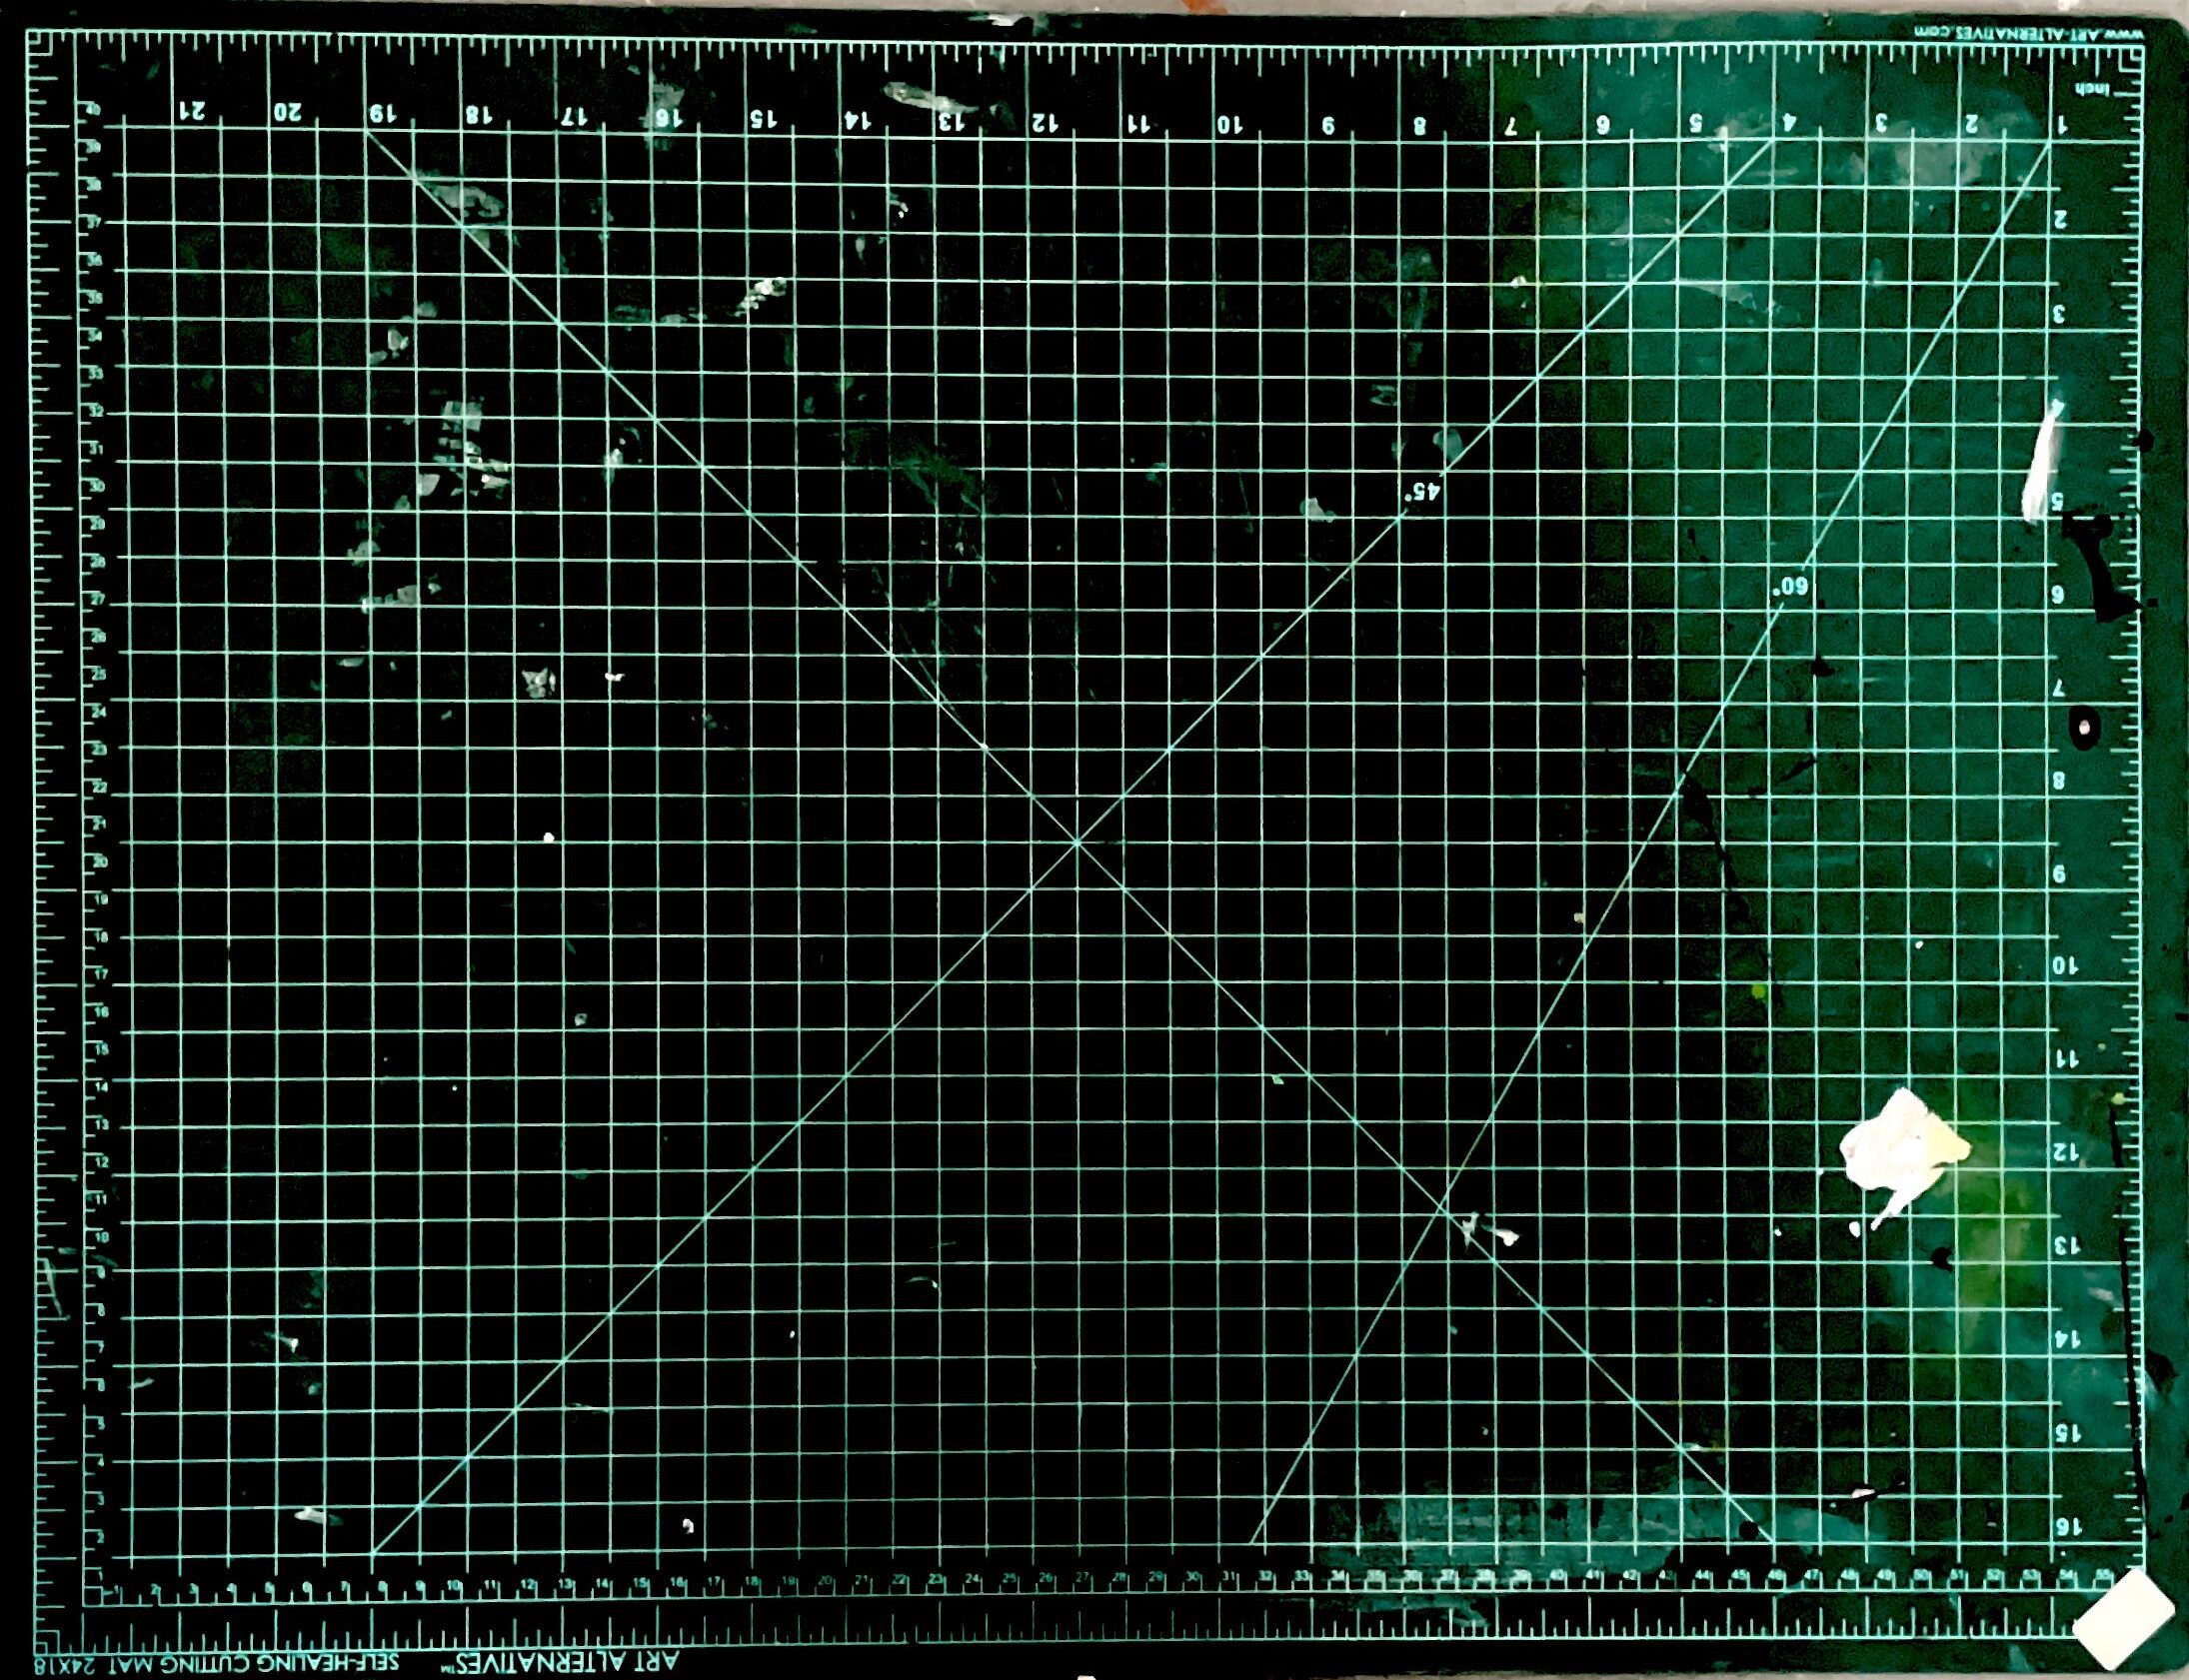
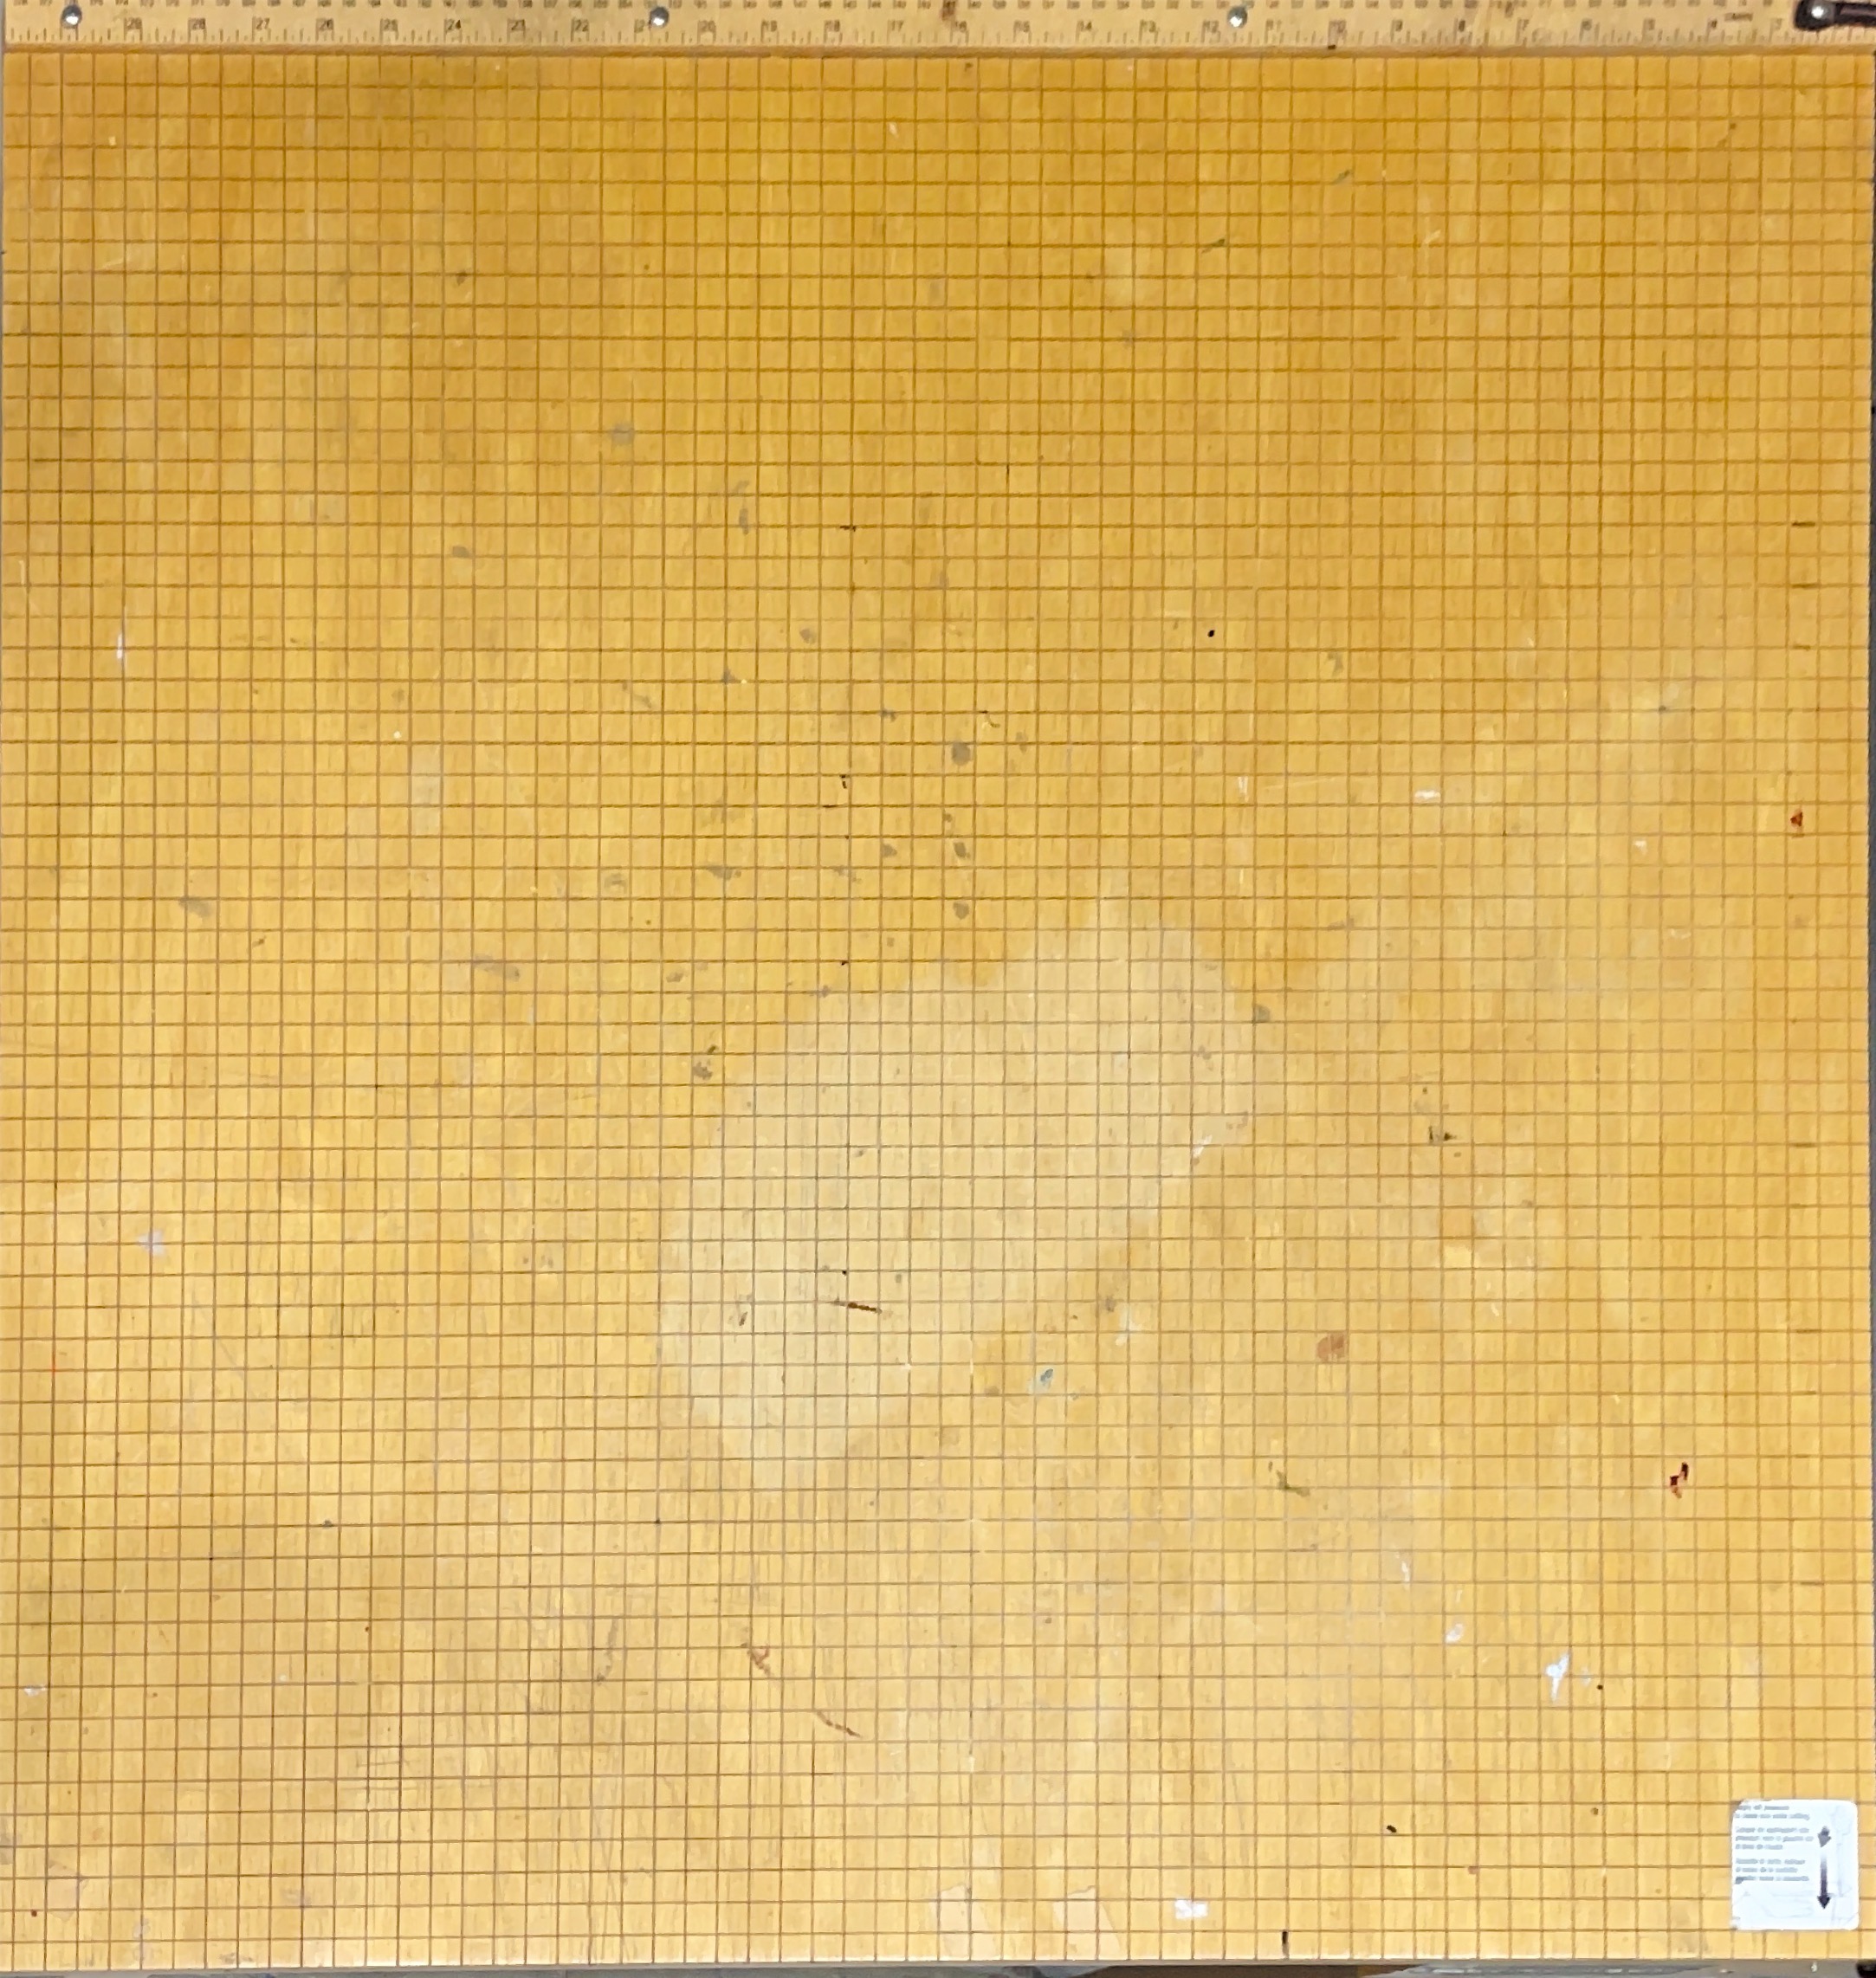
In this project, I used the “Scan Documents” feature on the iPhone Notes app to isolate evidence of “work” (paint marks, scratches, debris) from the surface of cutting mats.

The Discovery Process

The project just started with wondering if I could use the scanning feature for something other than documents. The in-class activity where we took portable scanners inspired me mainly because it was so fun to do! I also liked the level of focus it gave to the subject you were scanning. However, the portable scanners were limited because of their size and uniformity. This is why I turned to my Notes app scanner, which I knew had the same purpose.
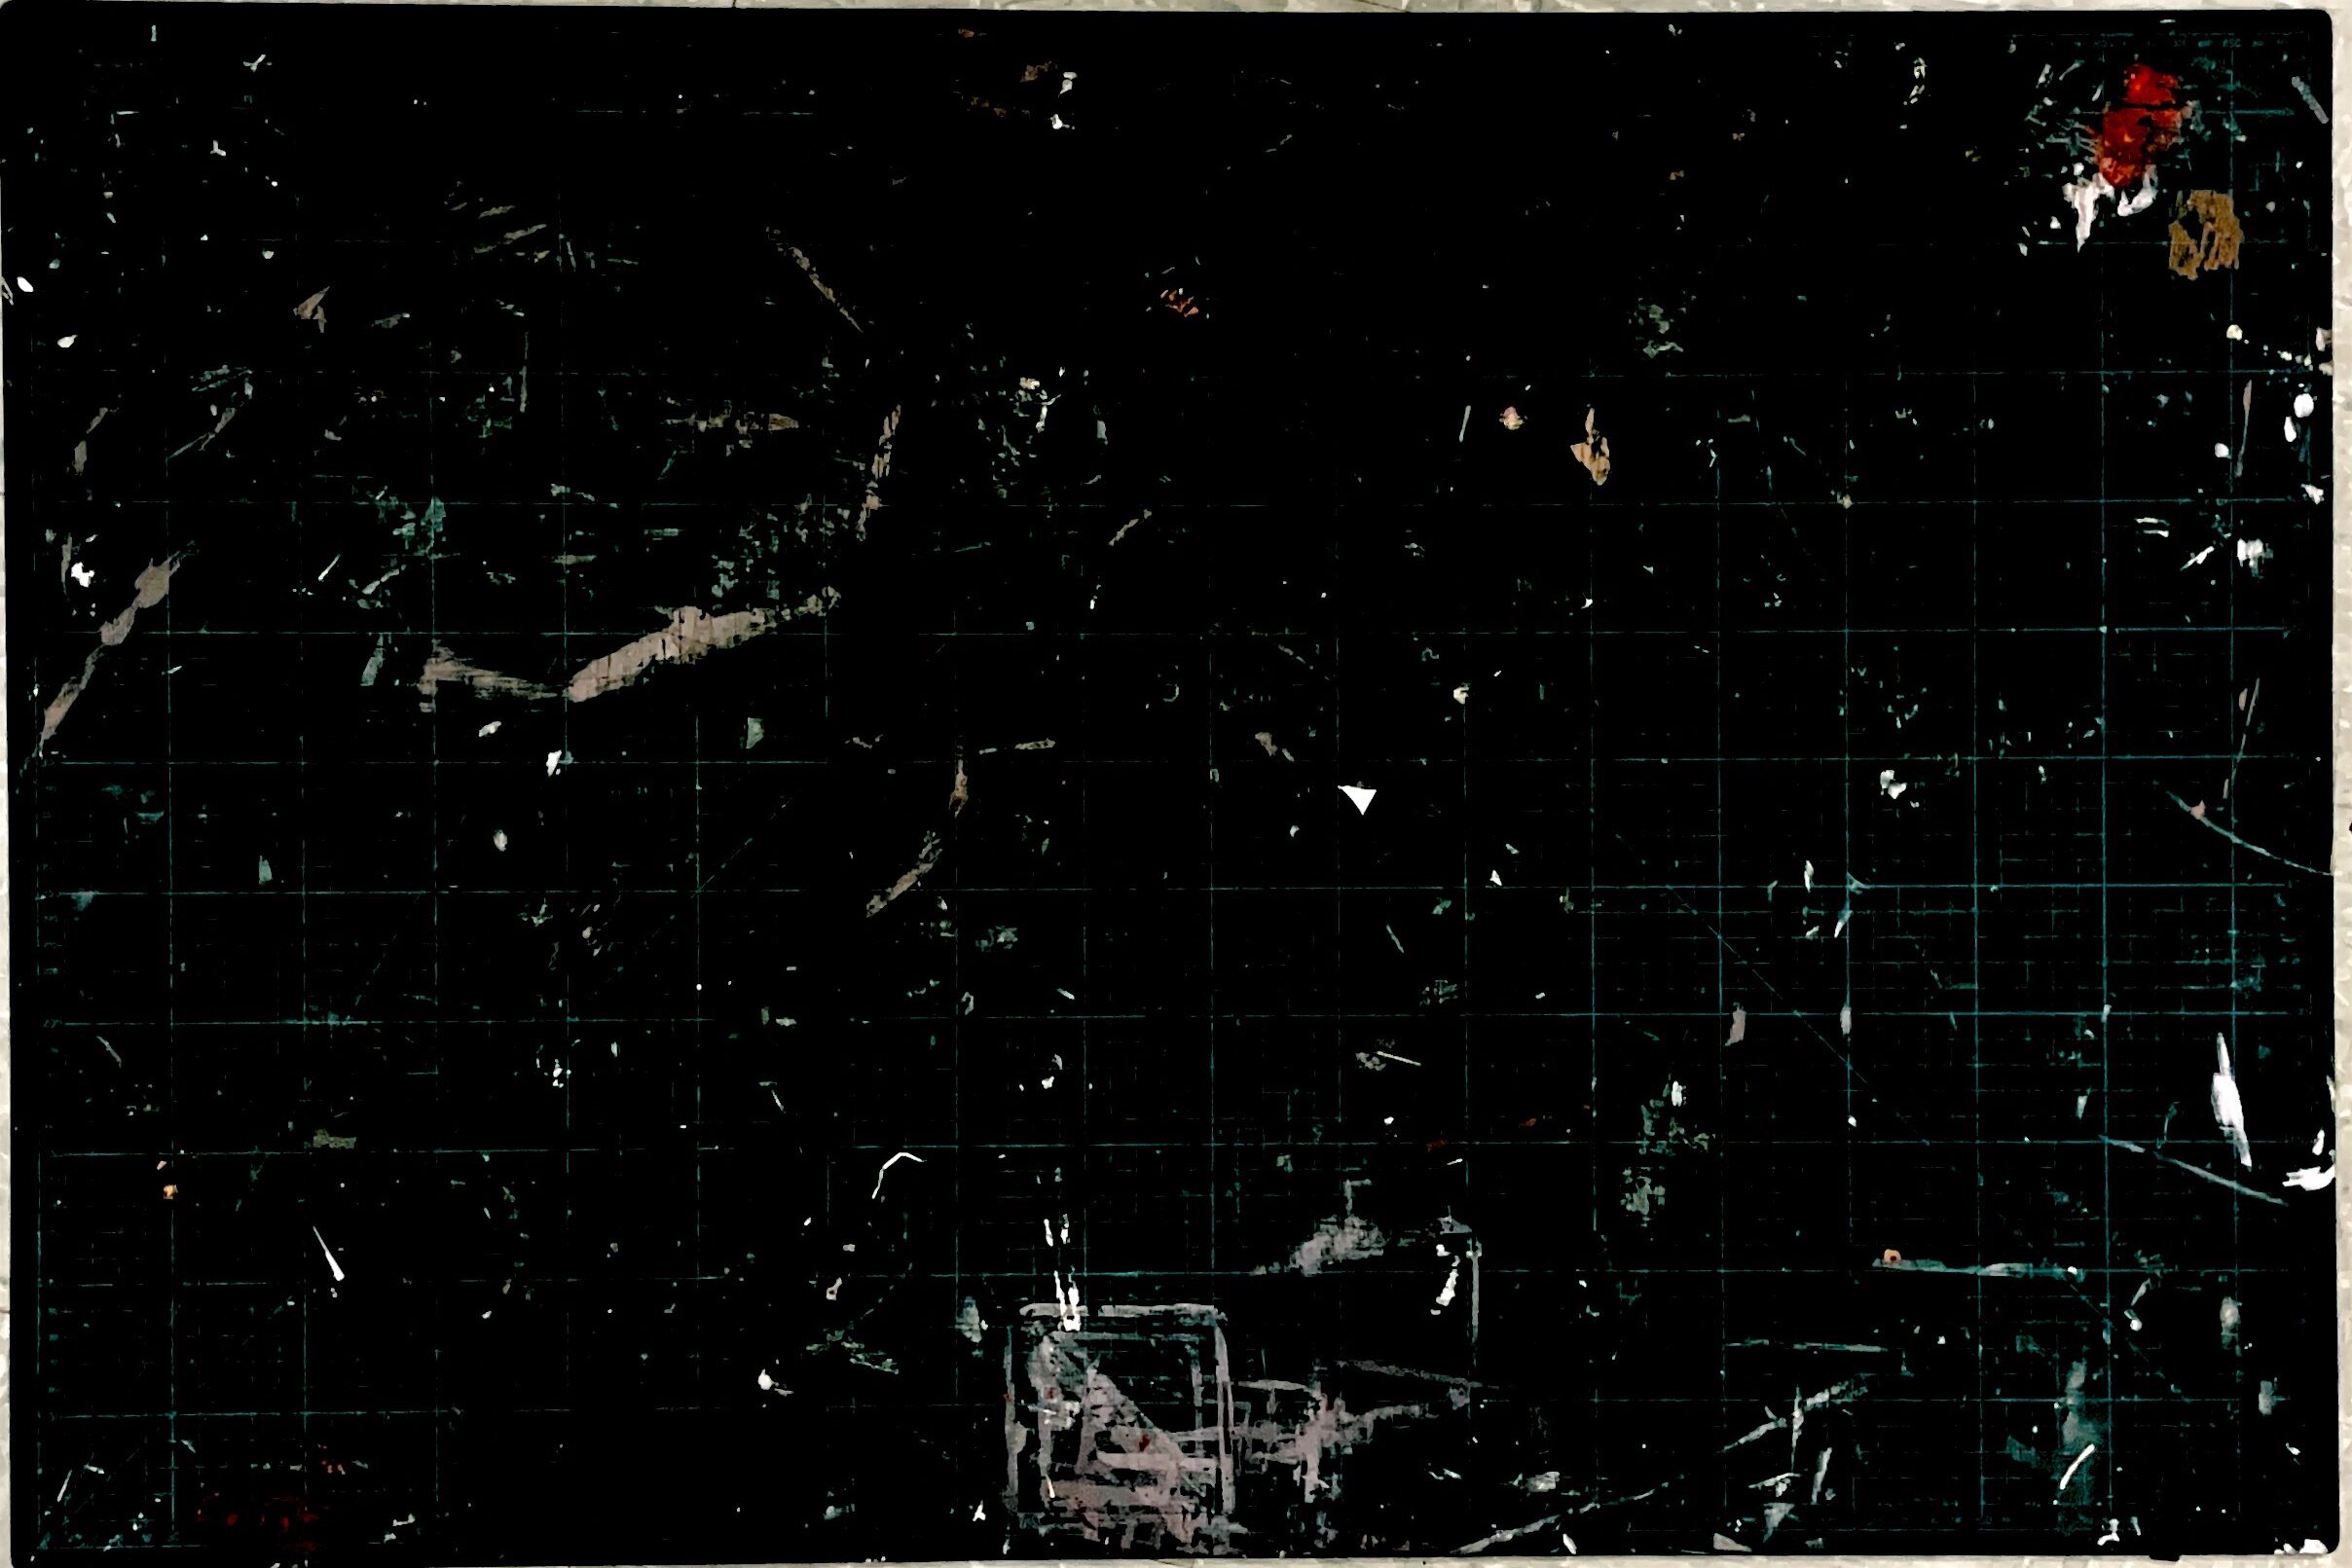
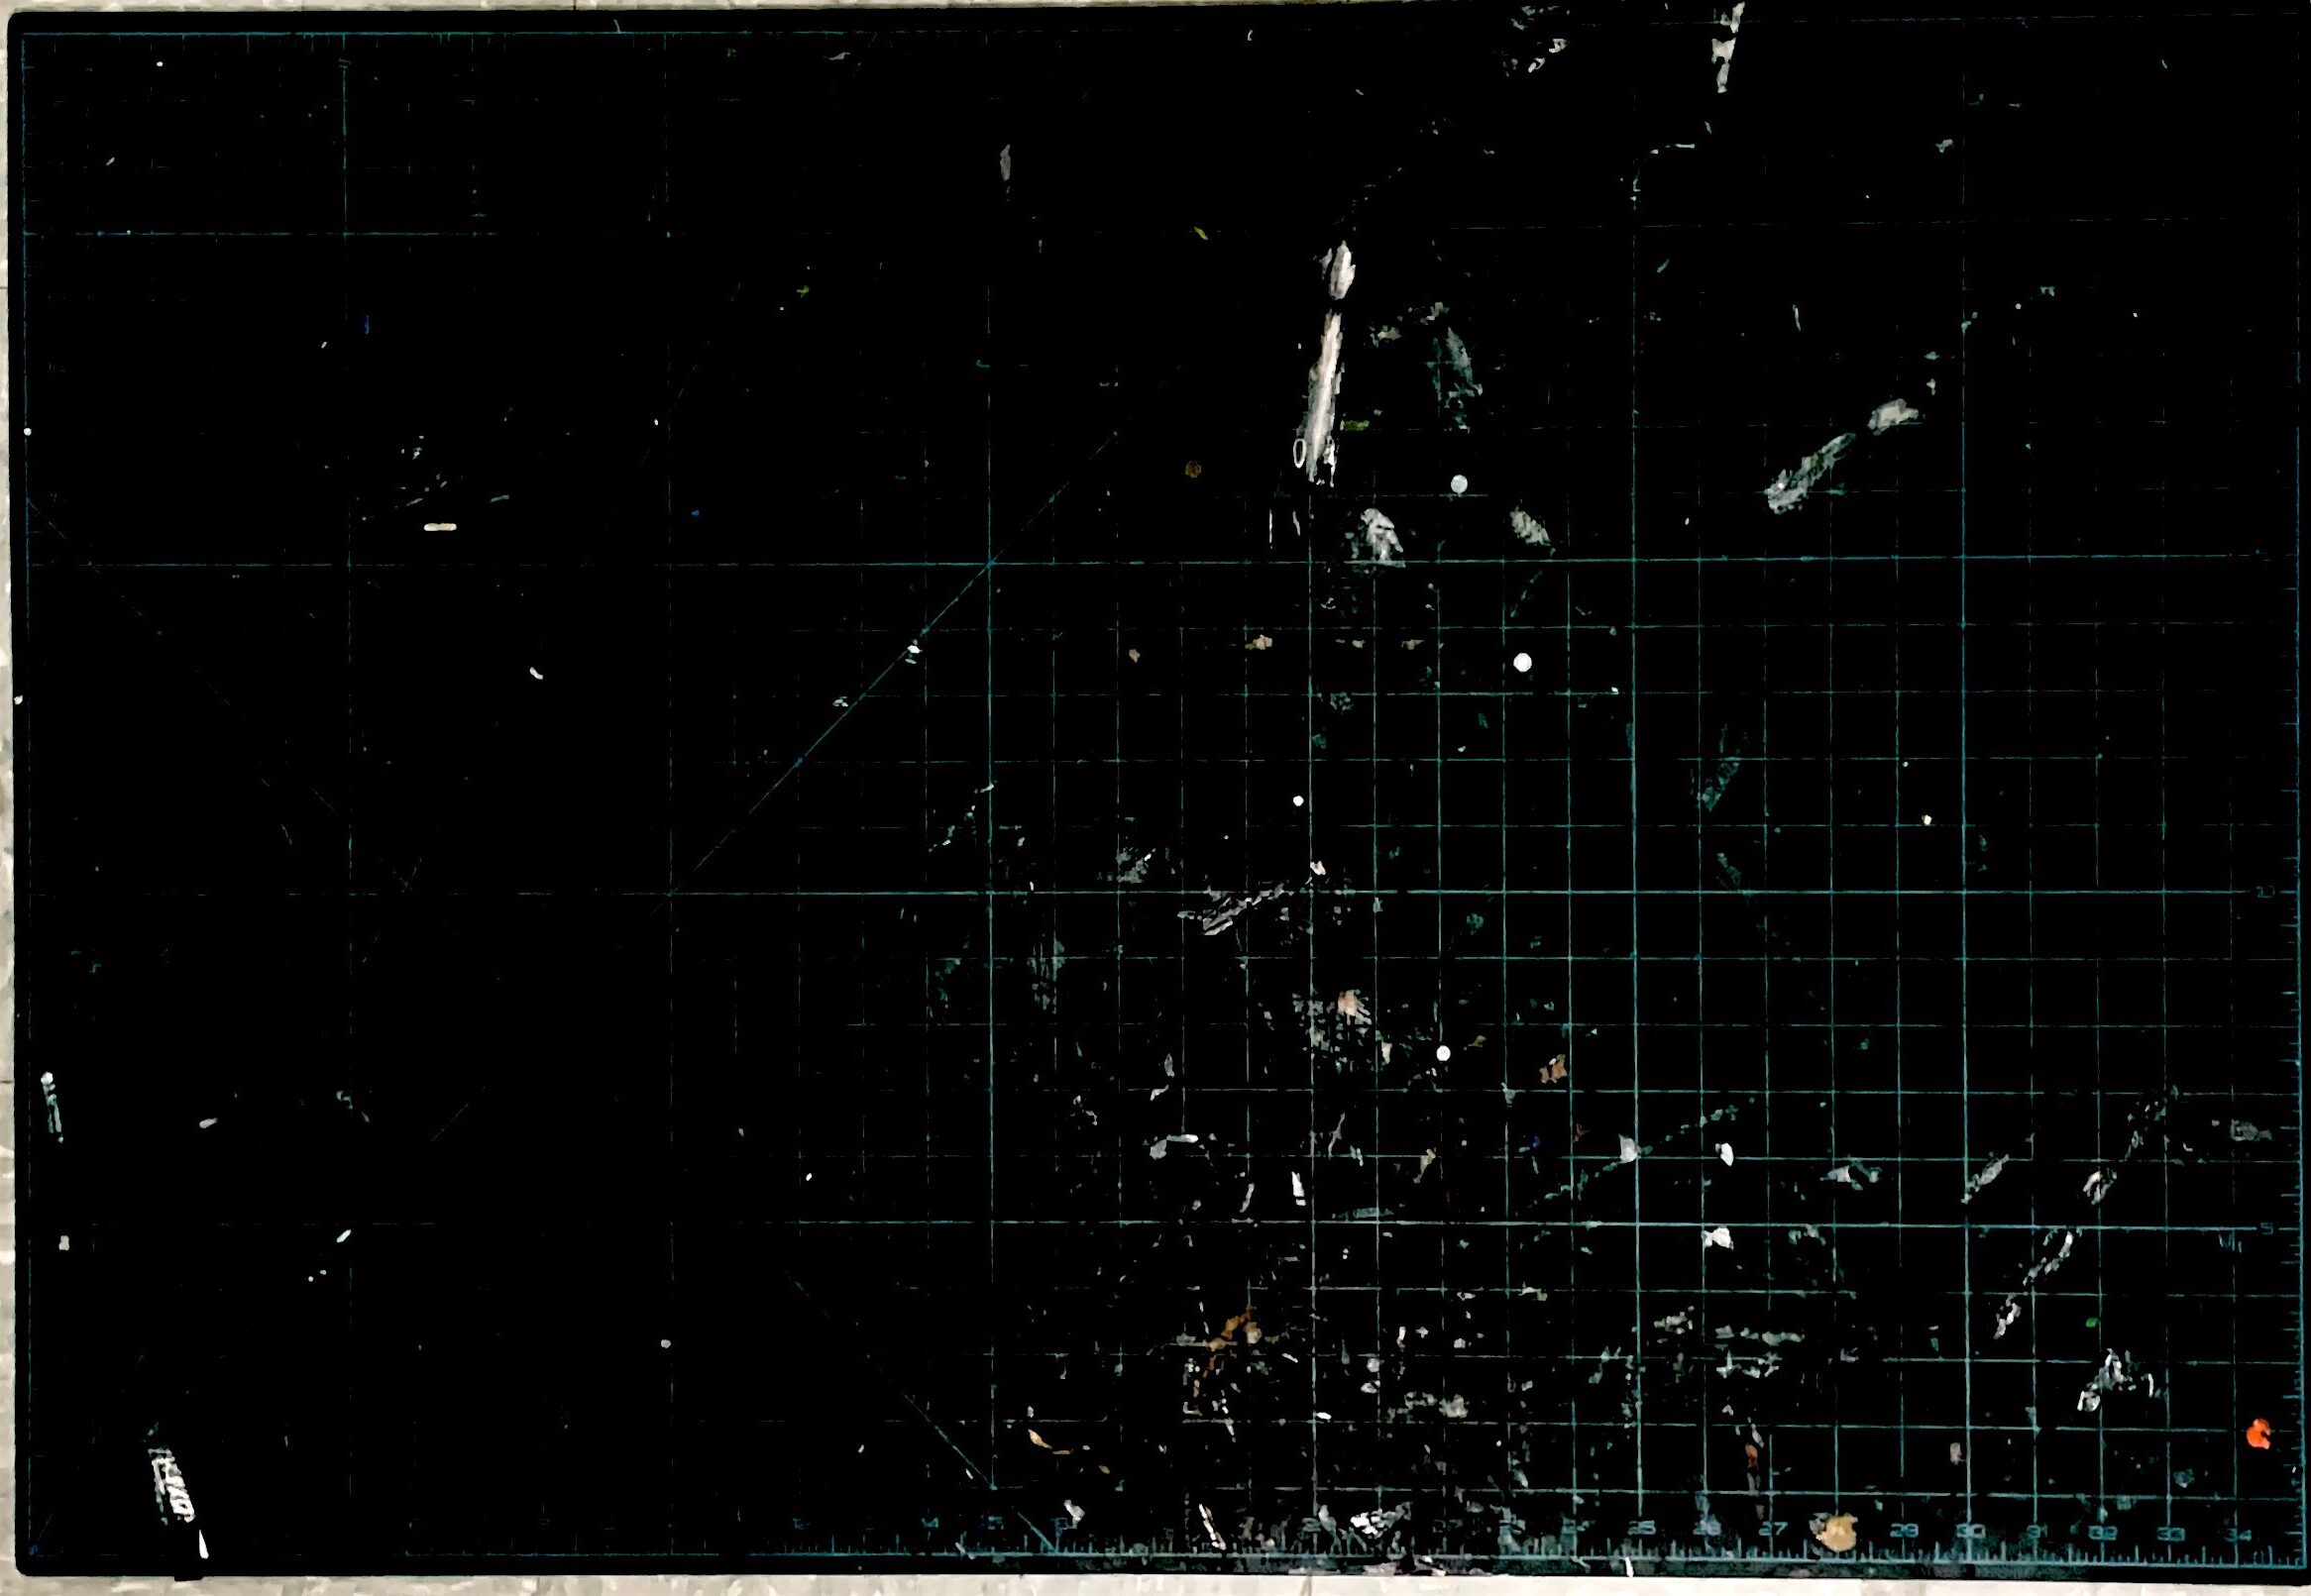
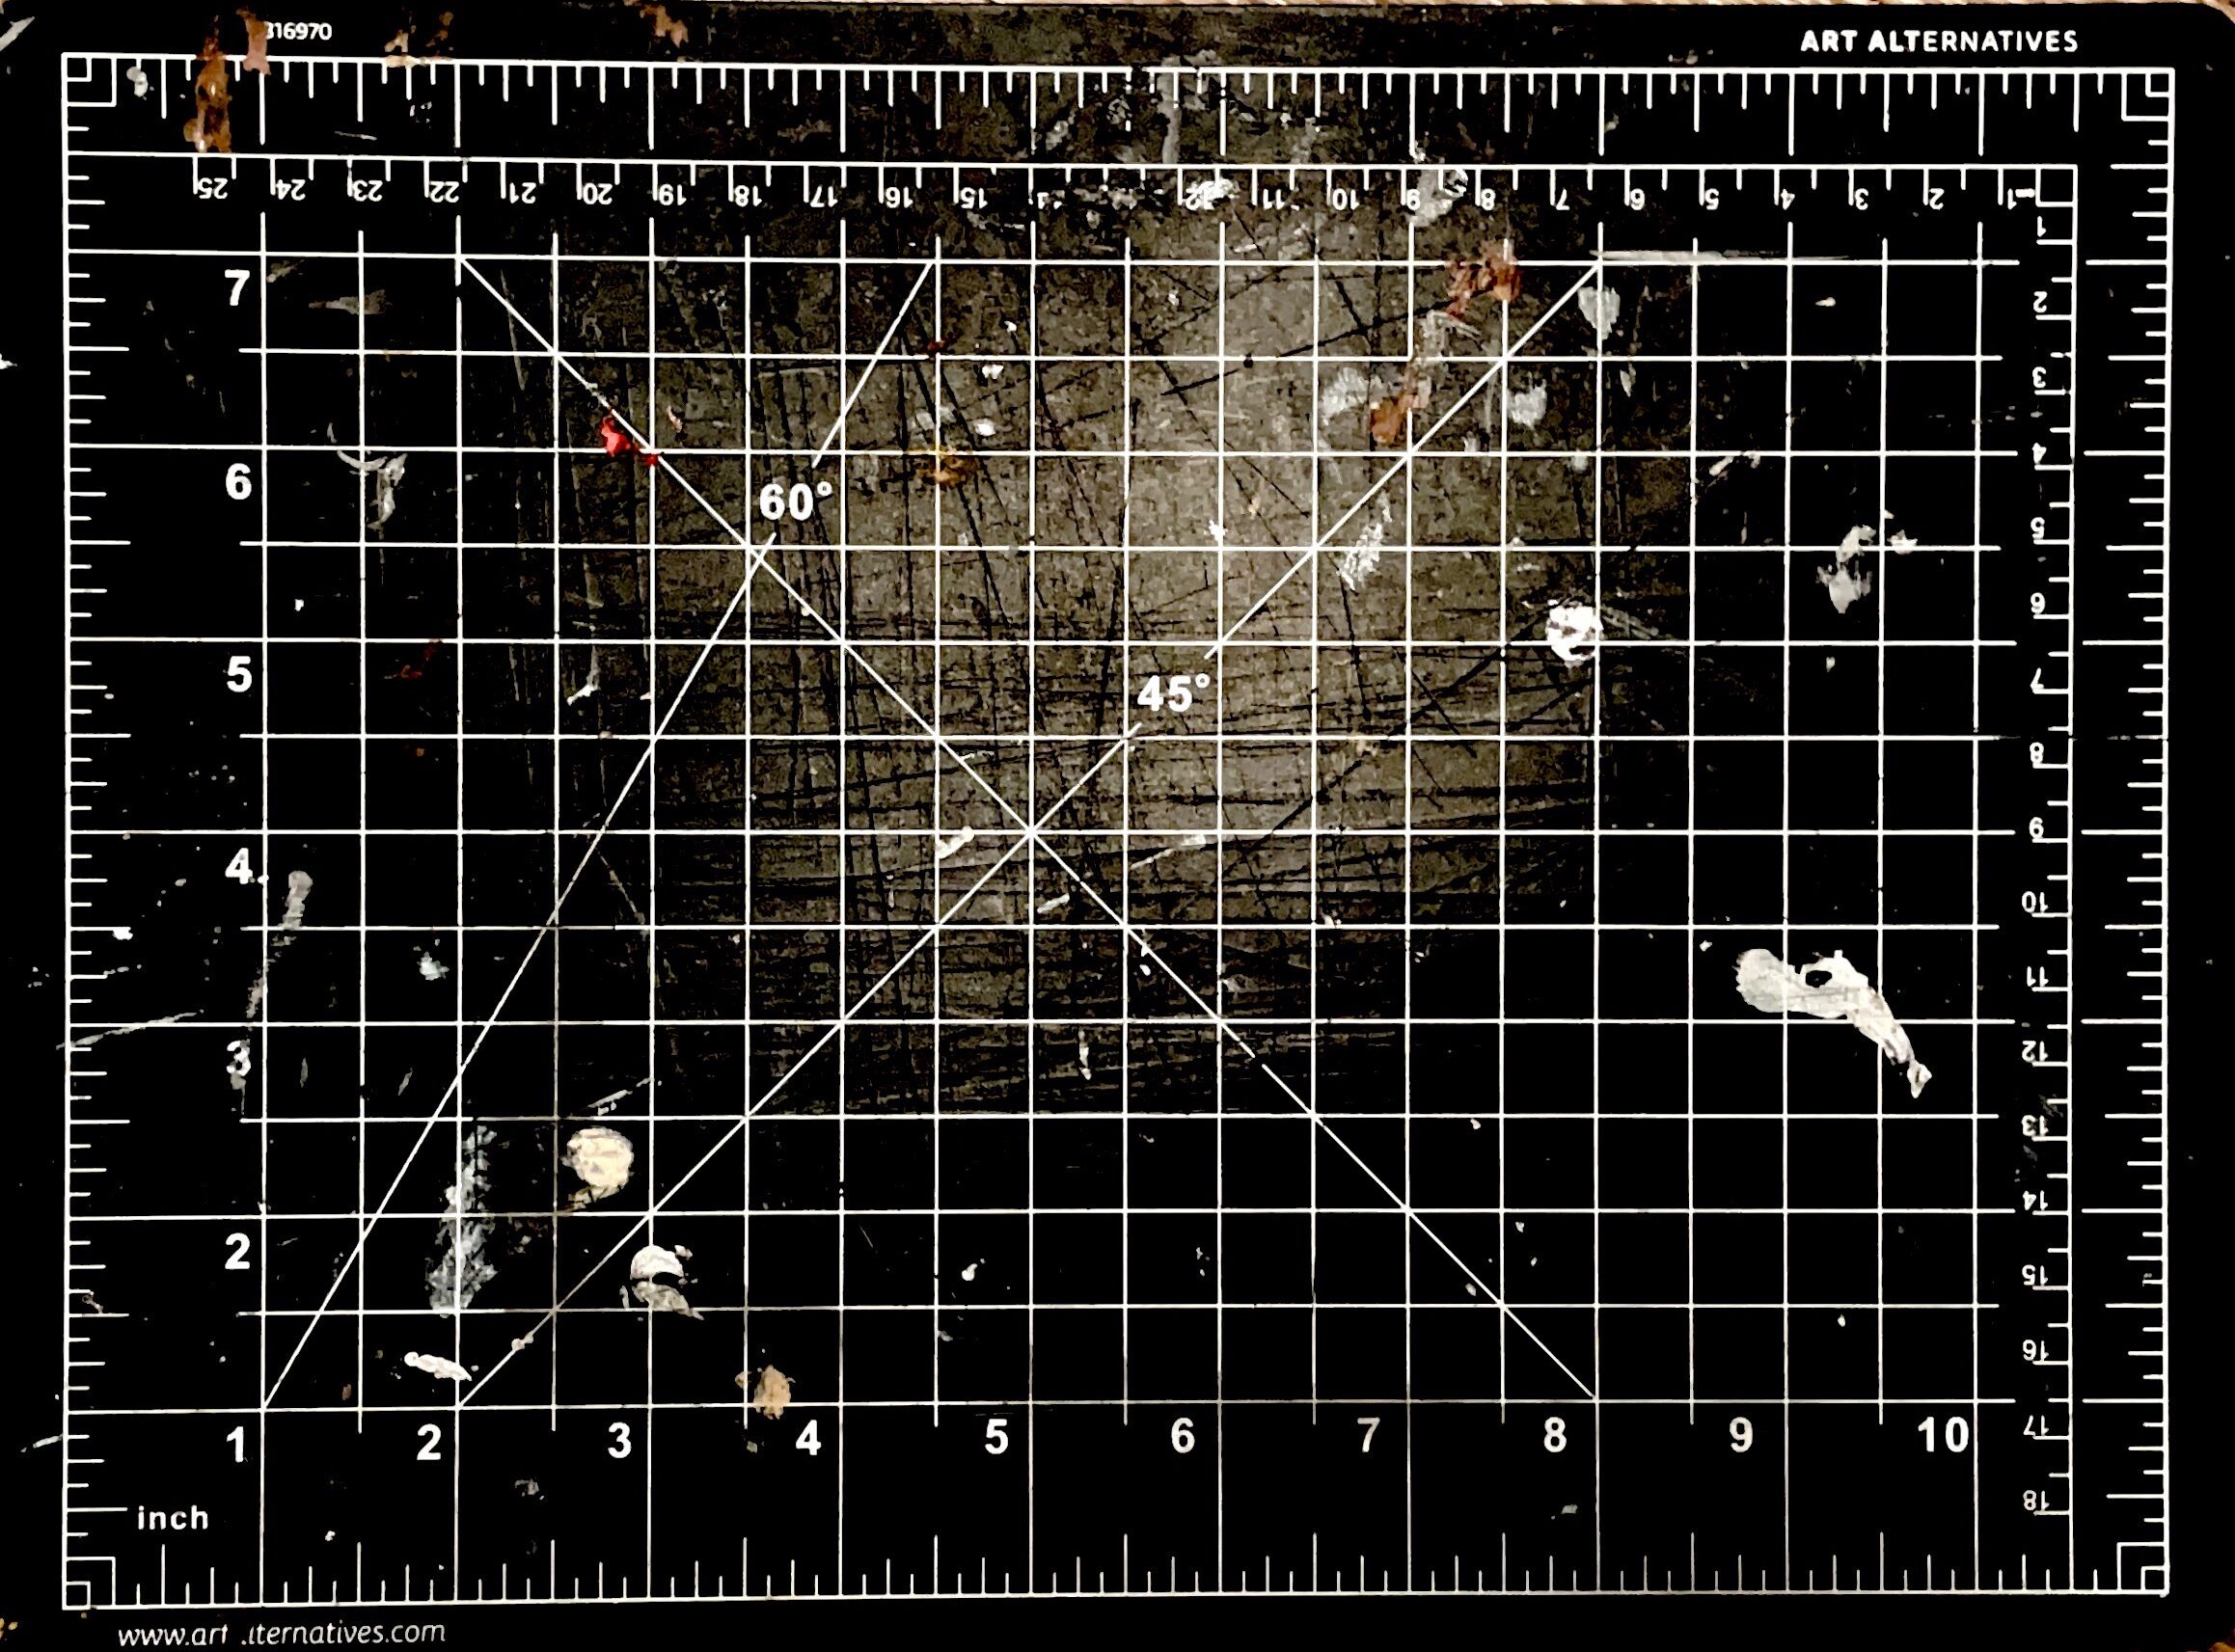
I began testing with what happened to be in front of me- a cutting mat- and was surprised by the result:

The paint marks and scruffs are not as prominent in person as in the scans. To me, the damage seemed like an overlay on top of the cutting board, which made me test more:

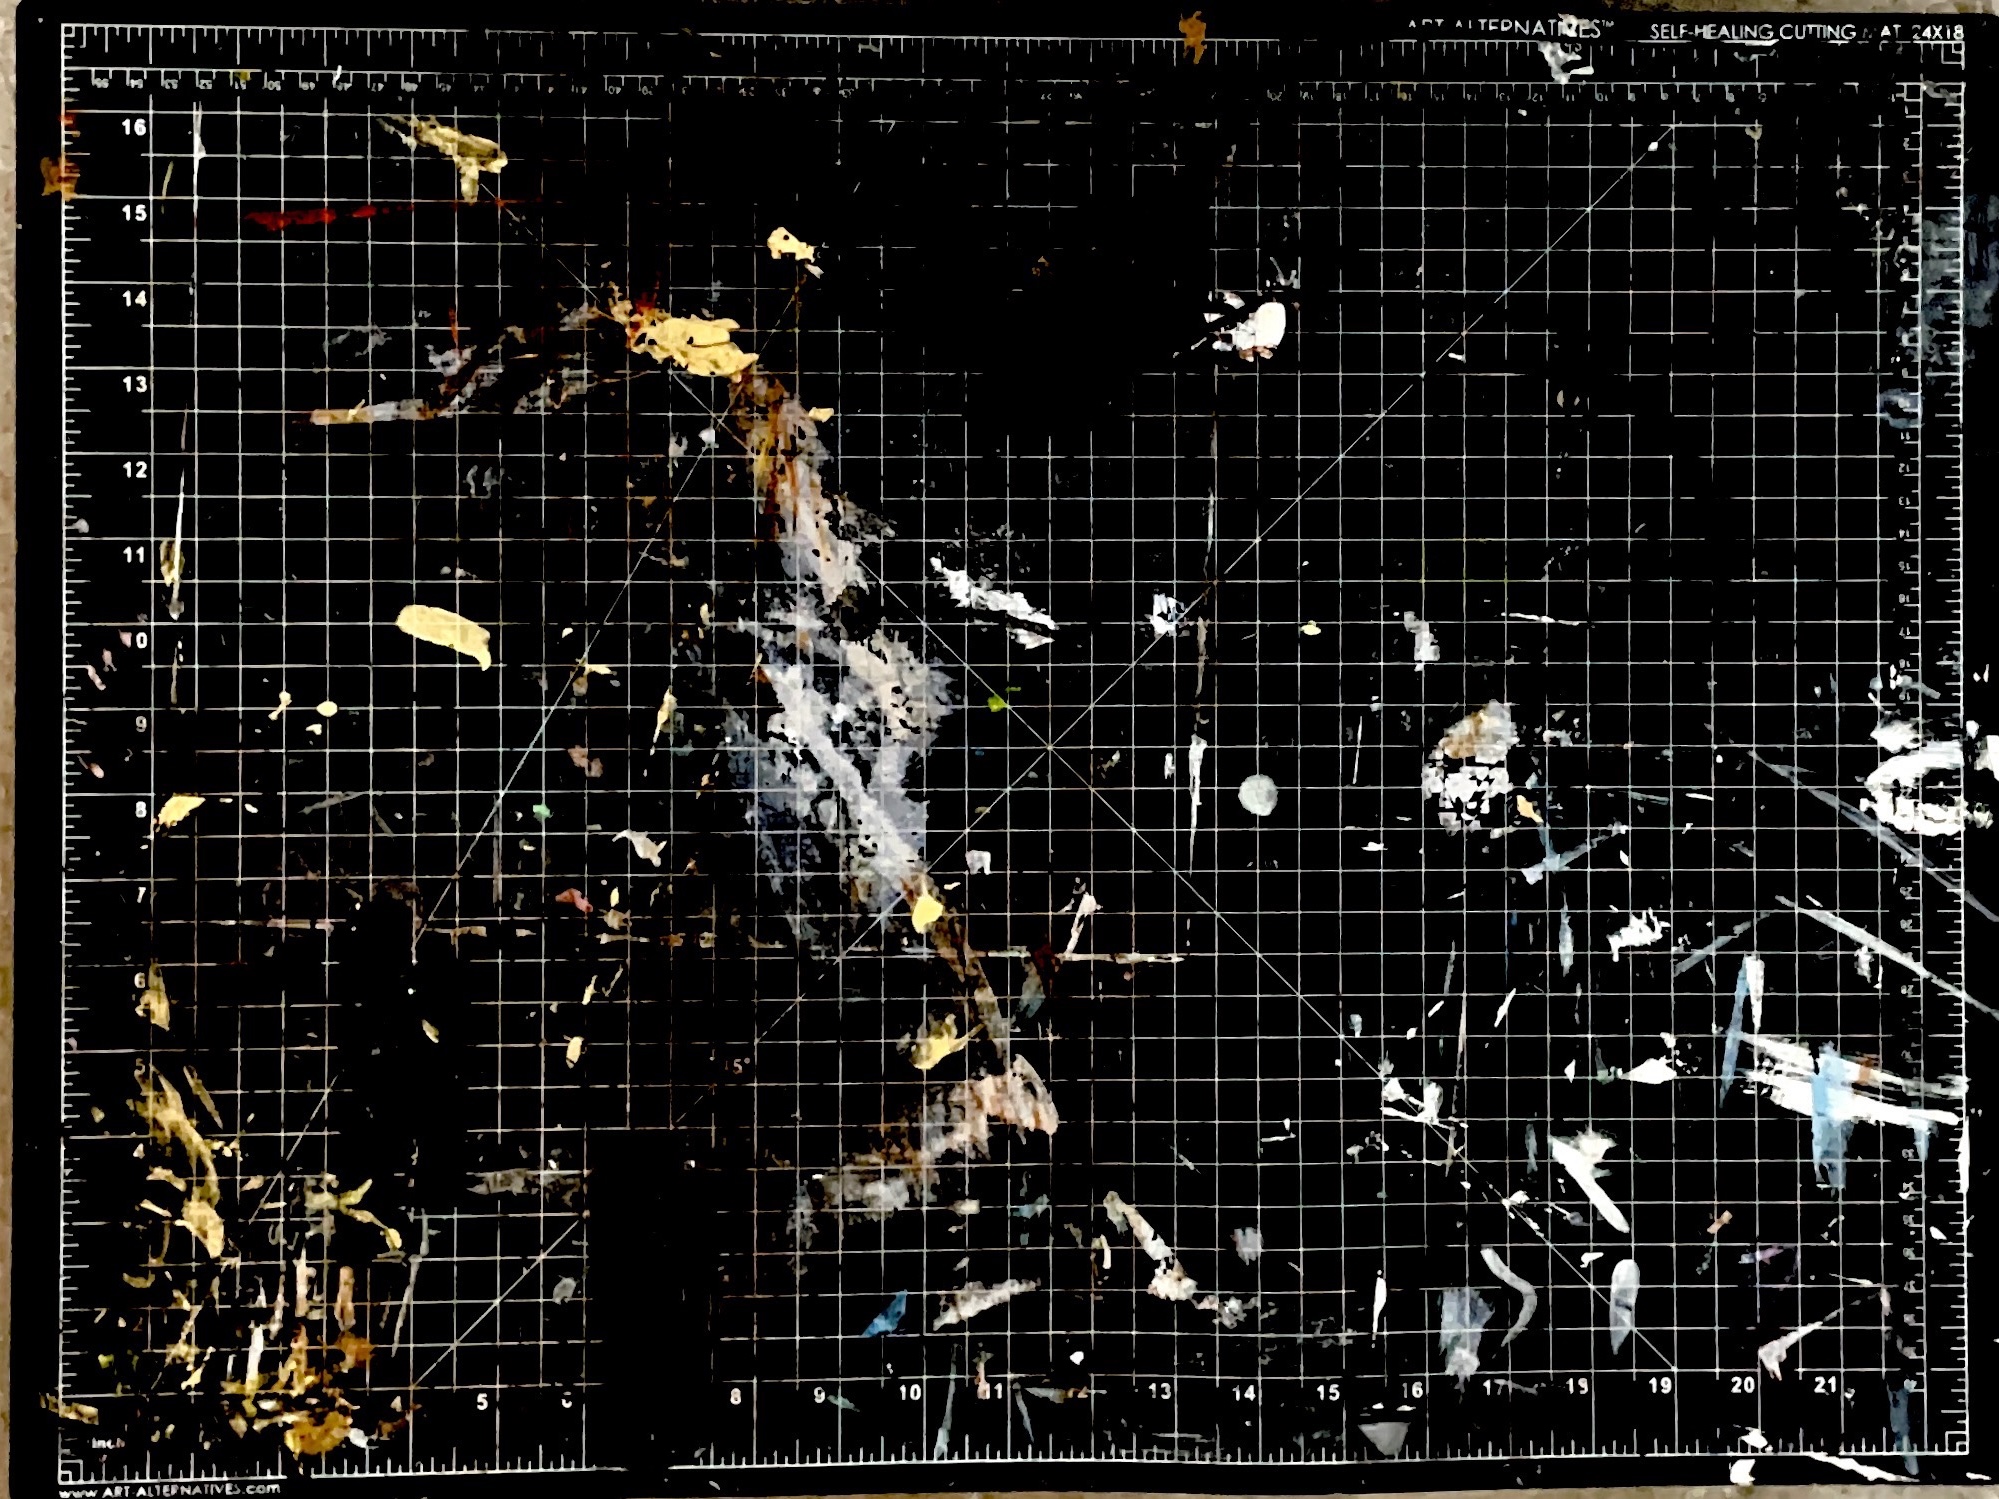
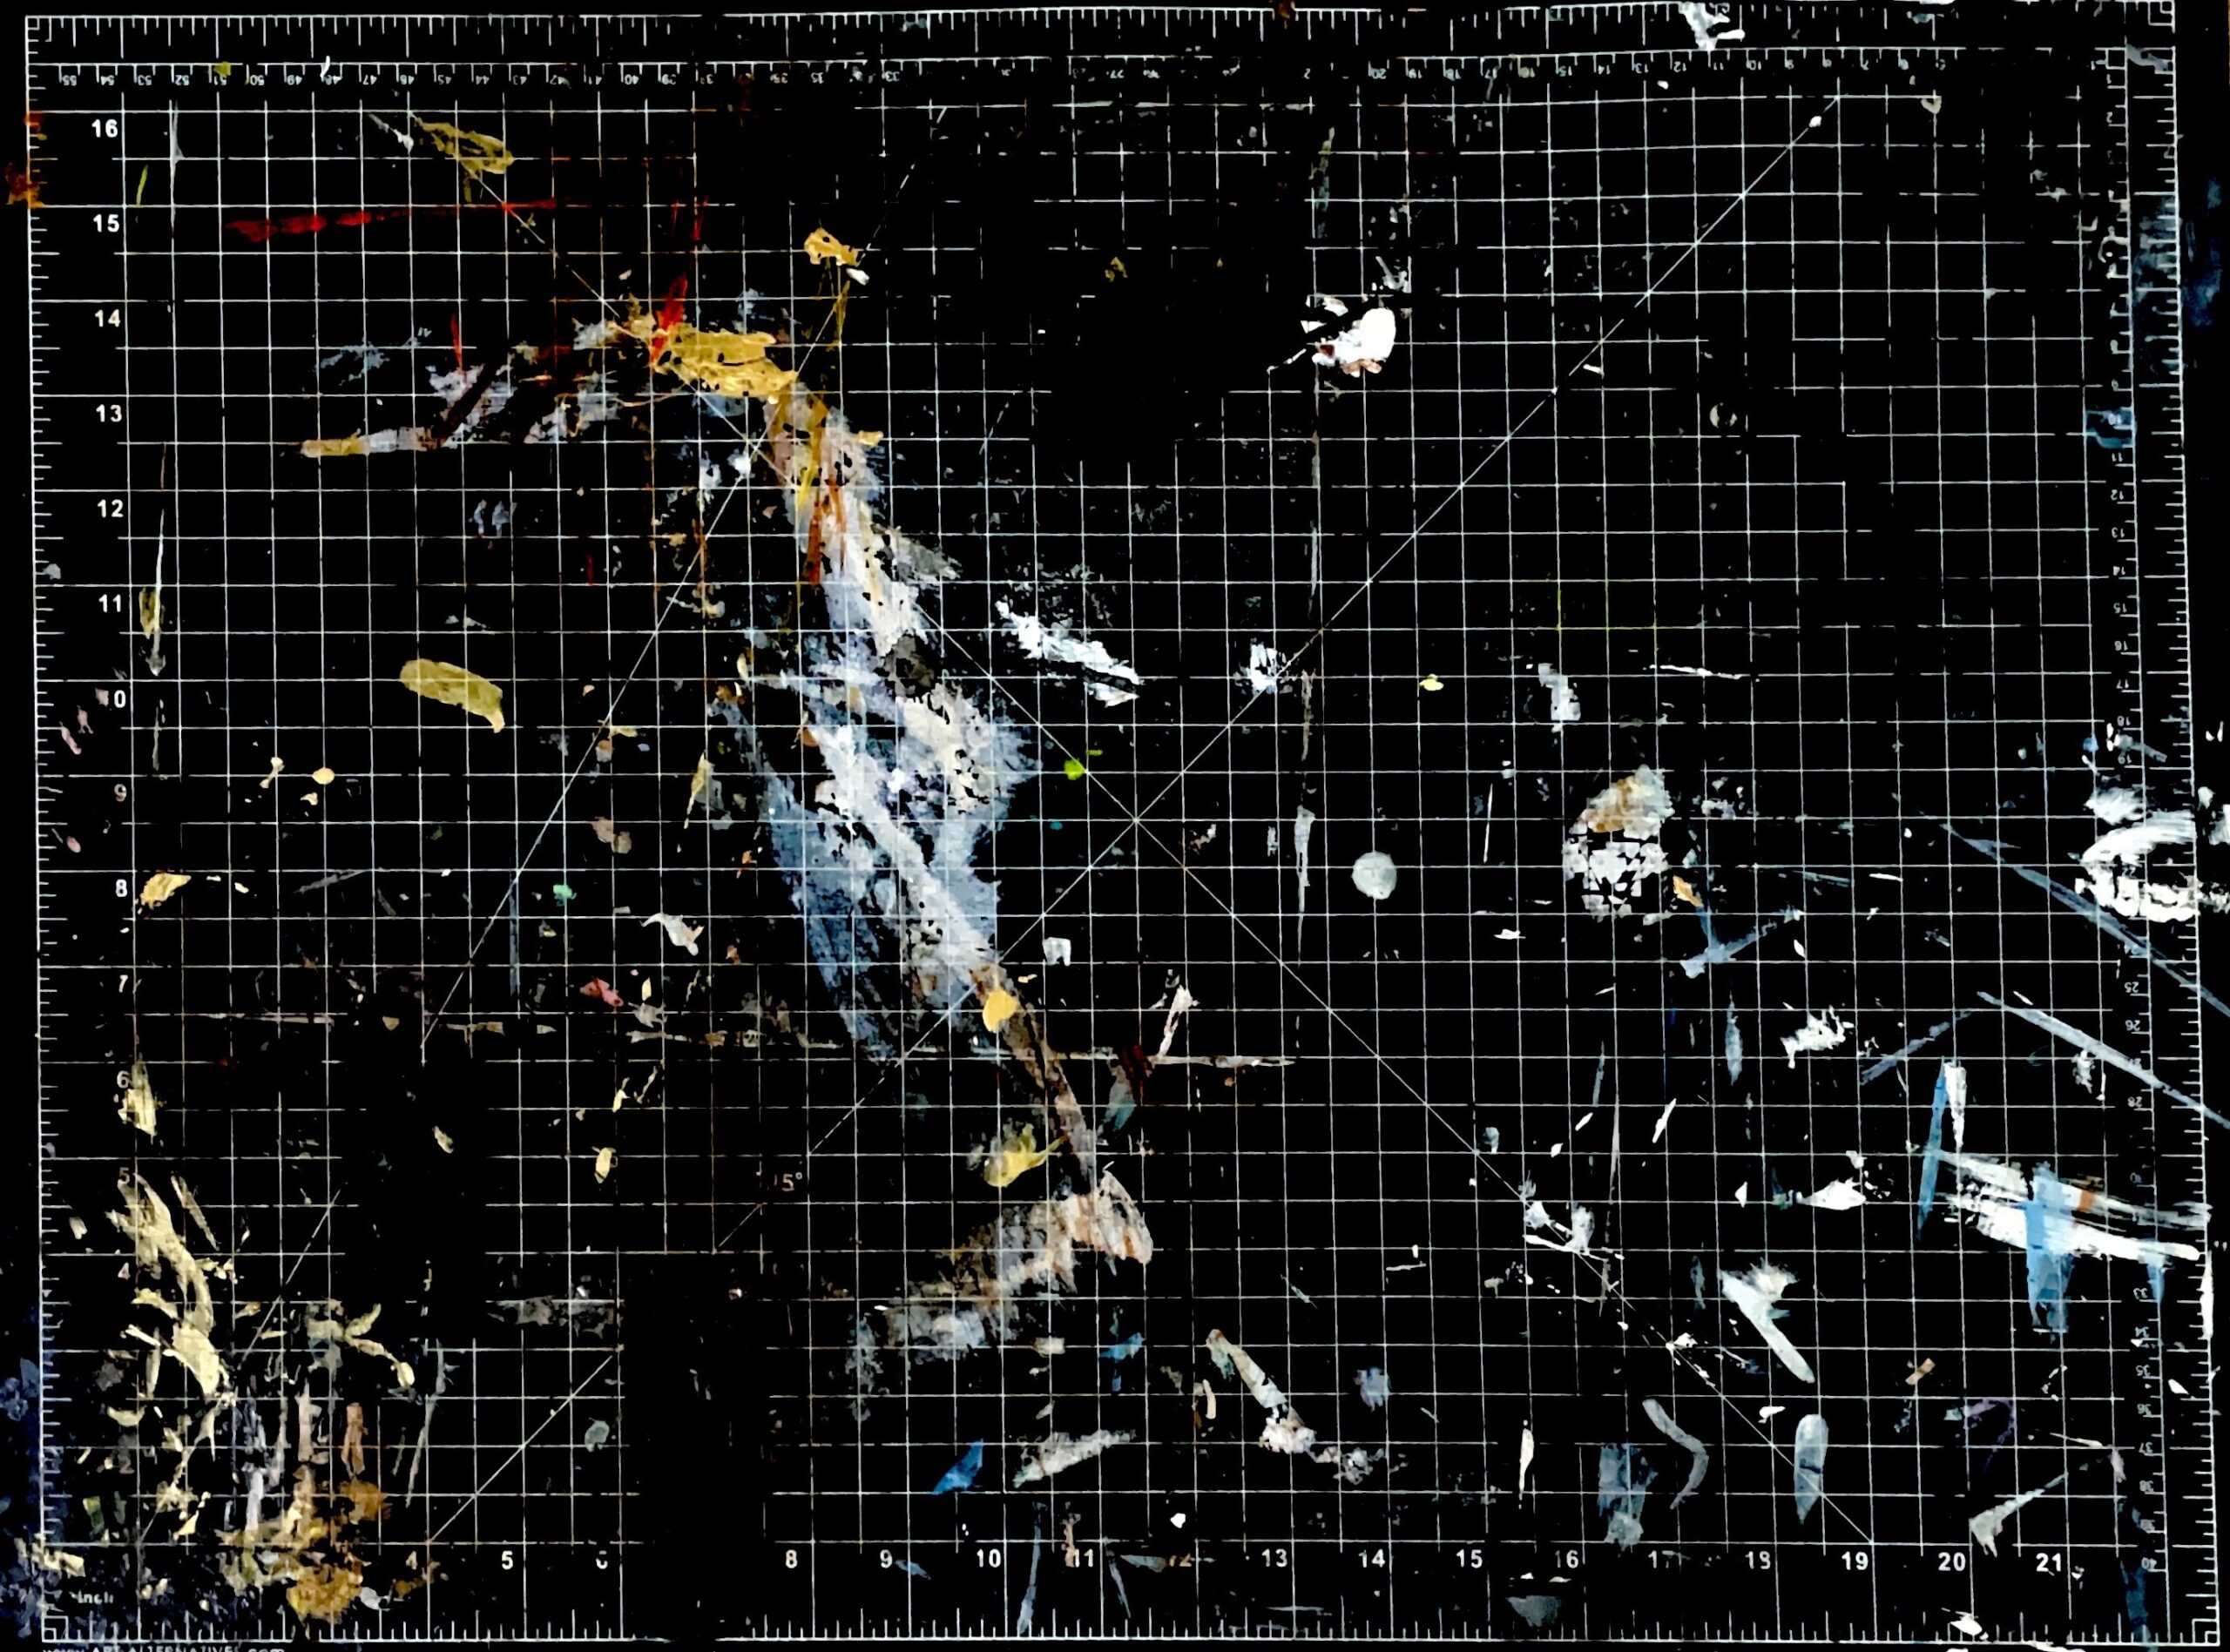
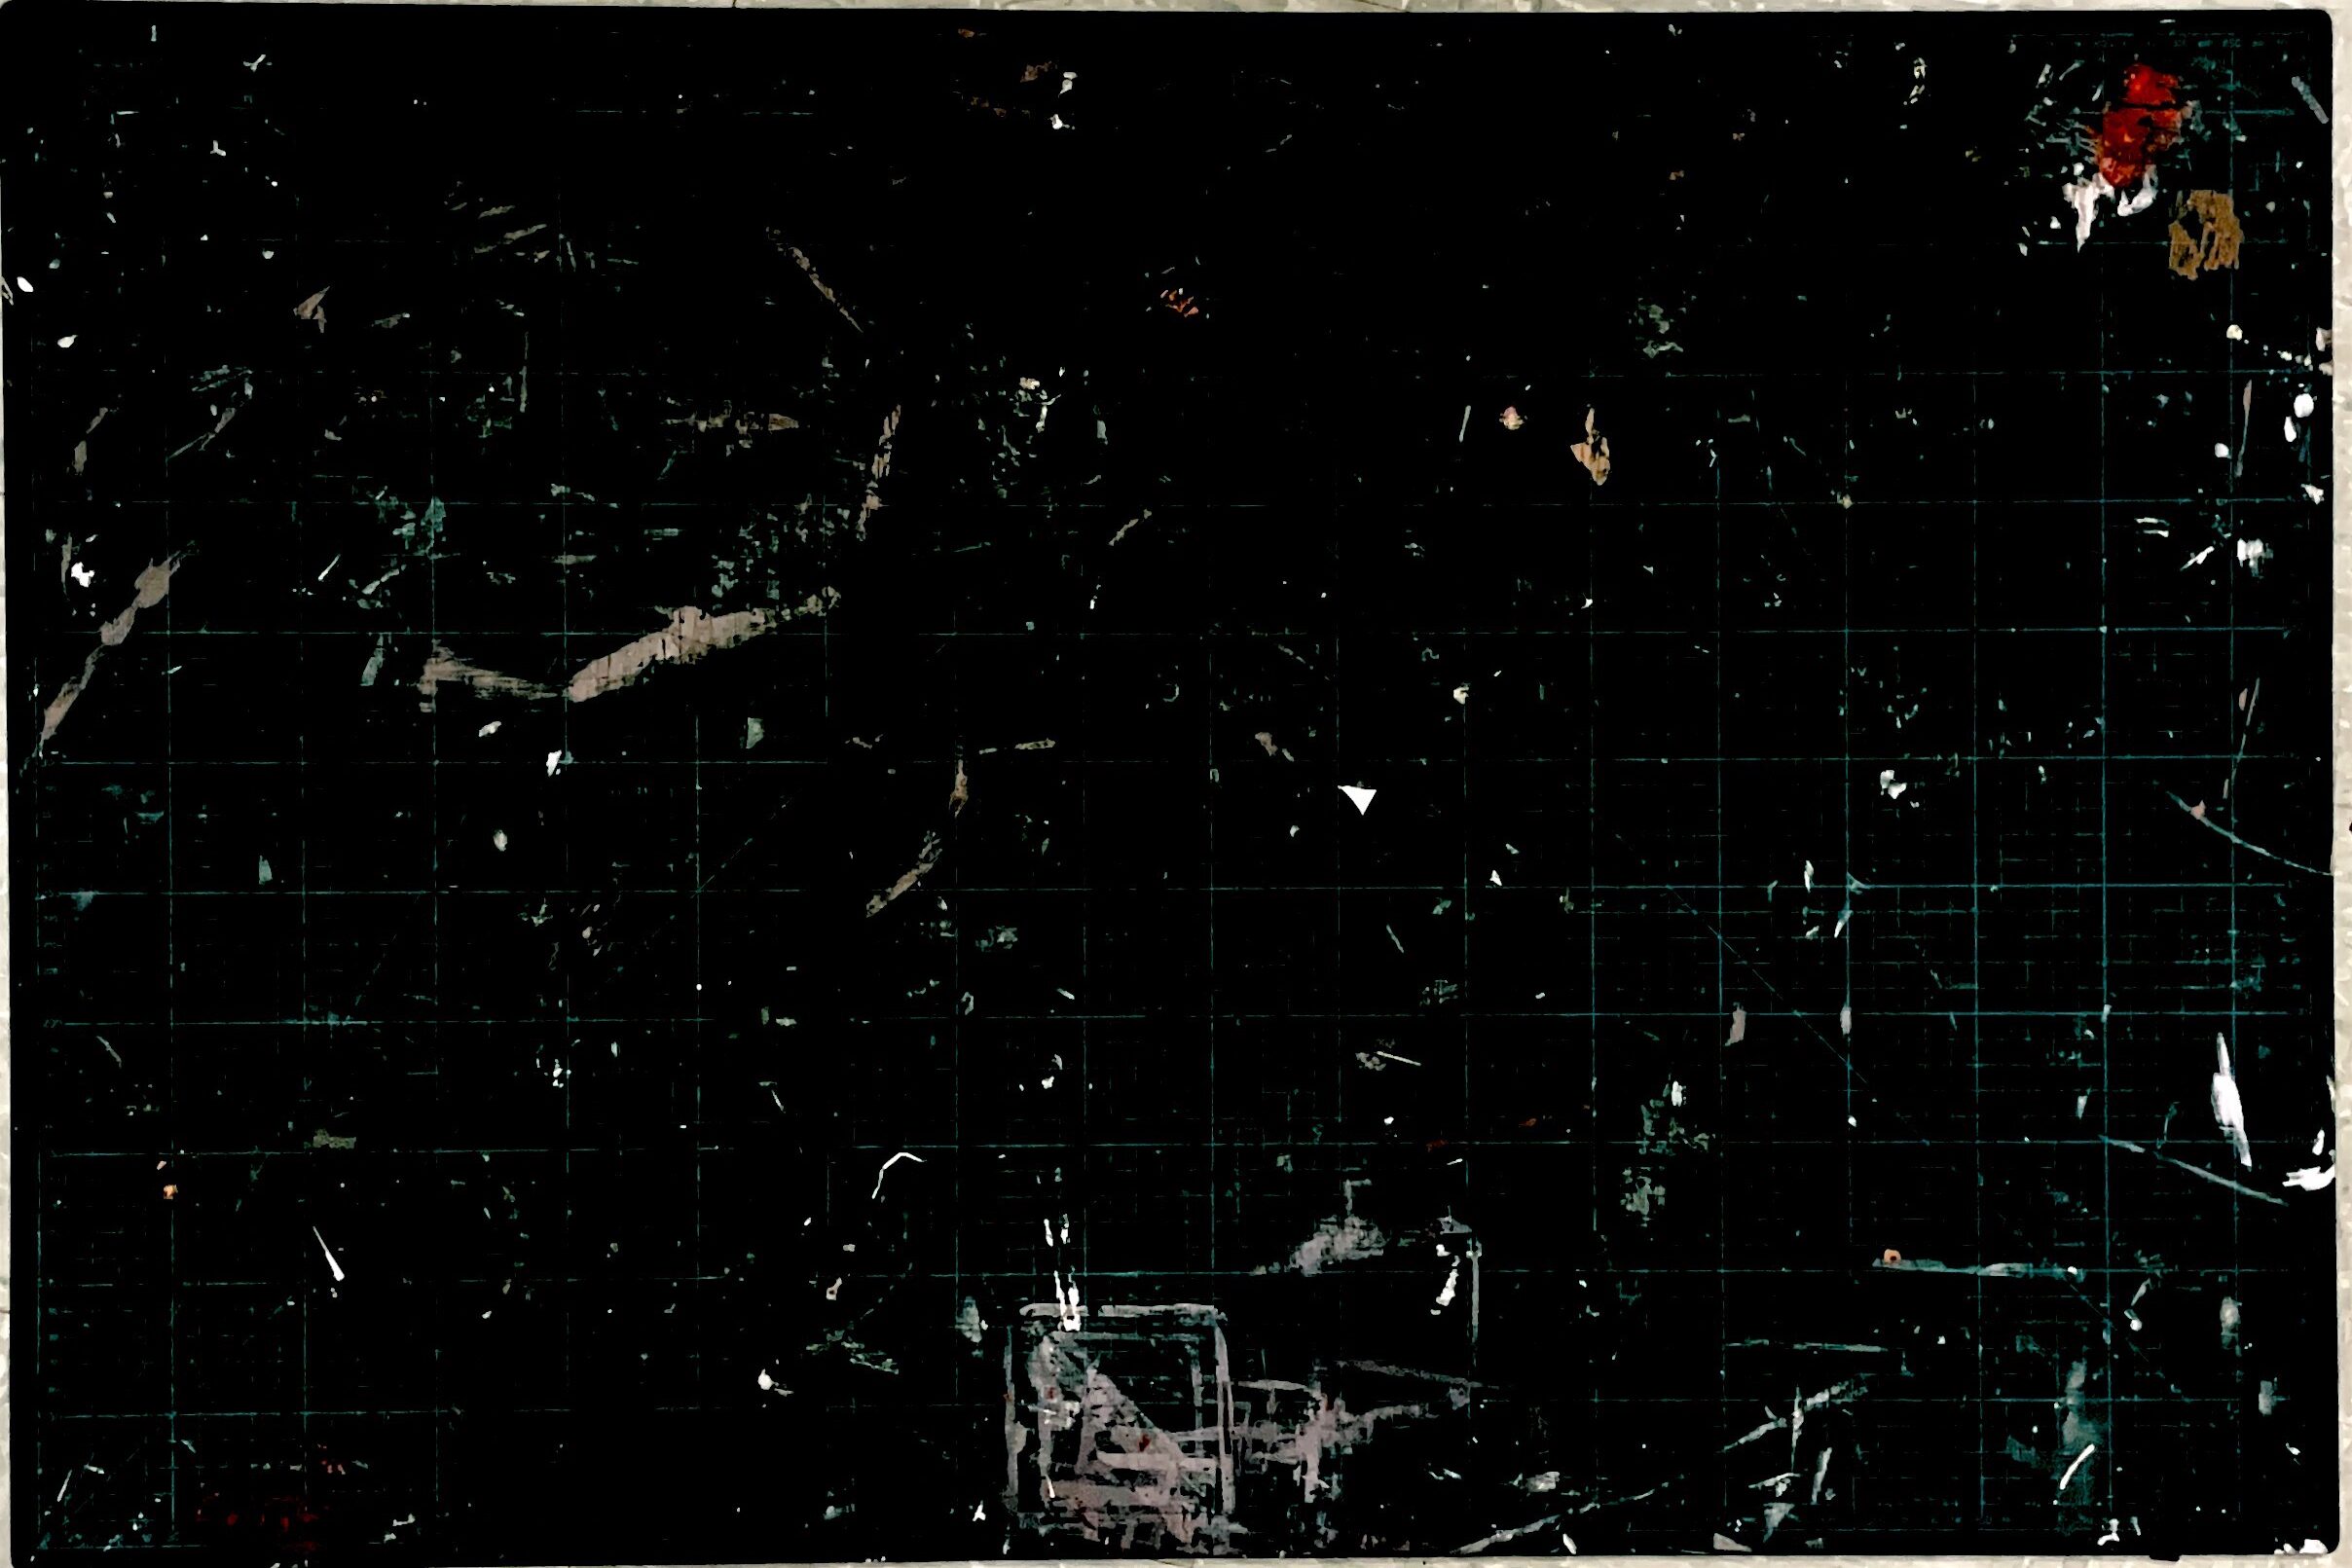
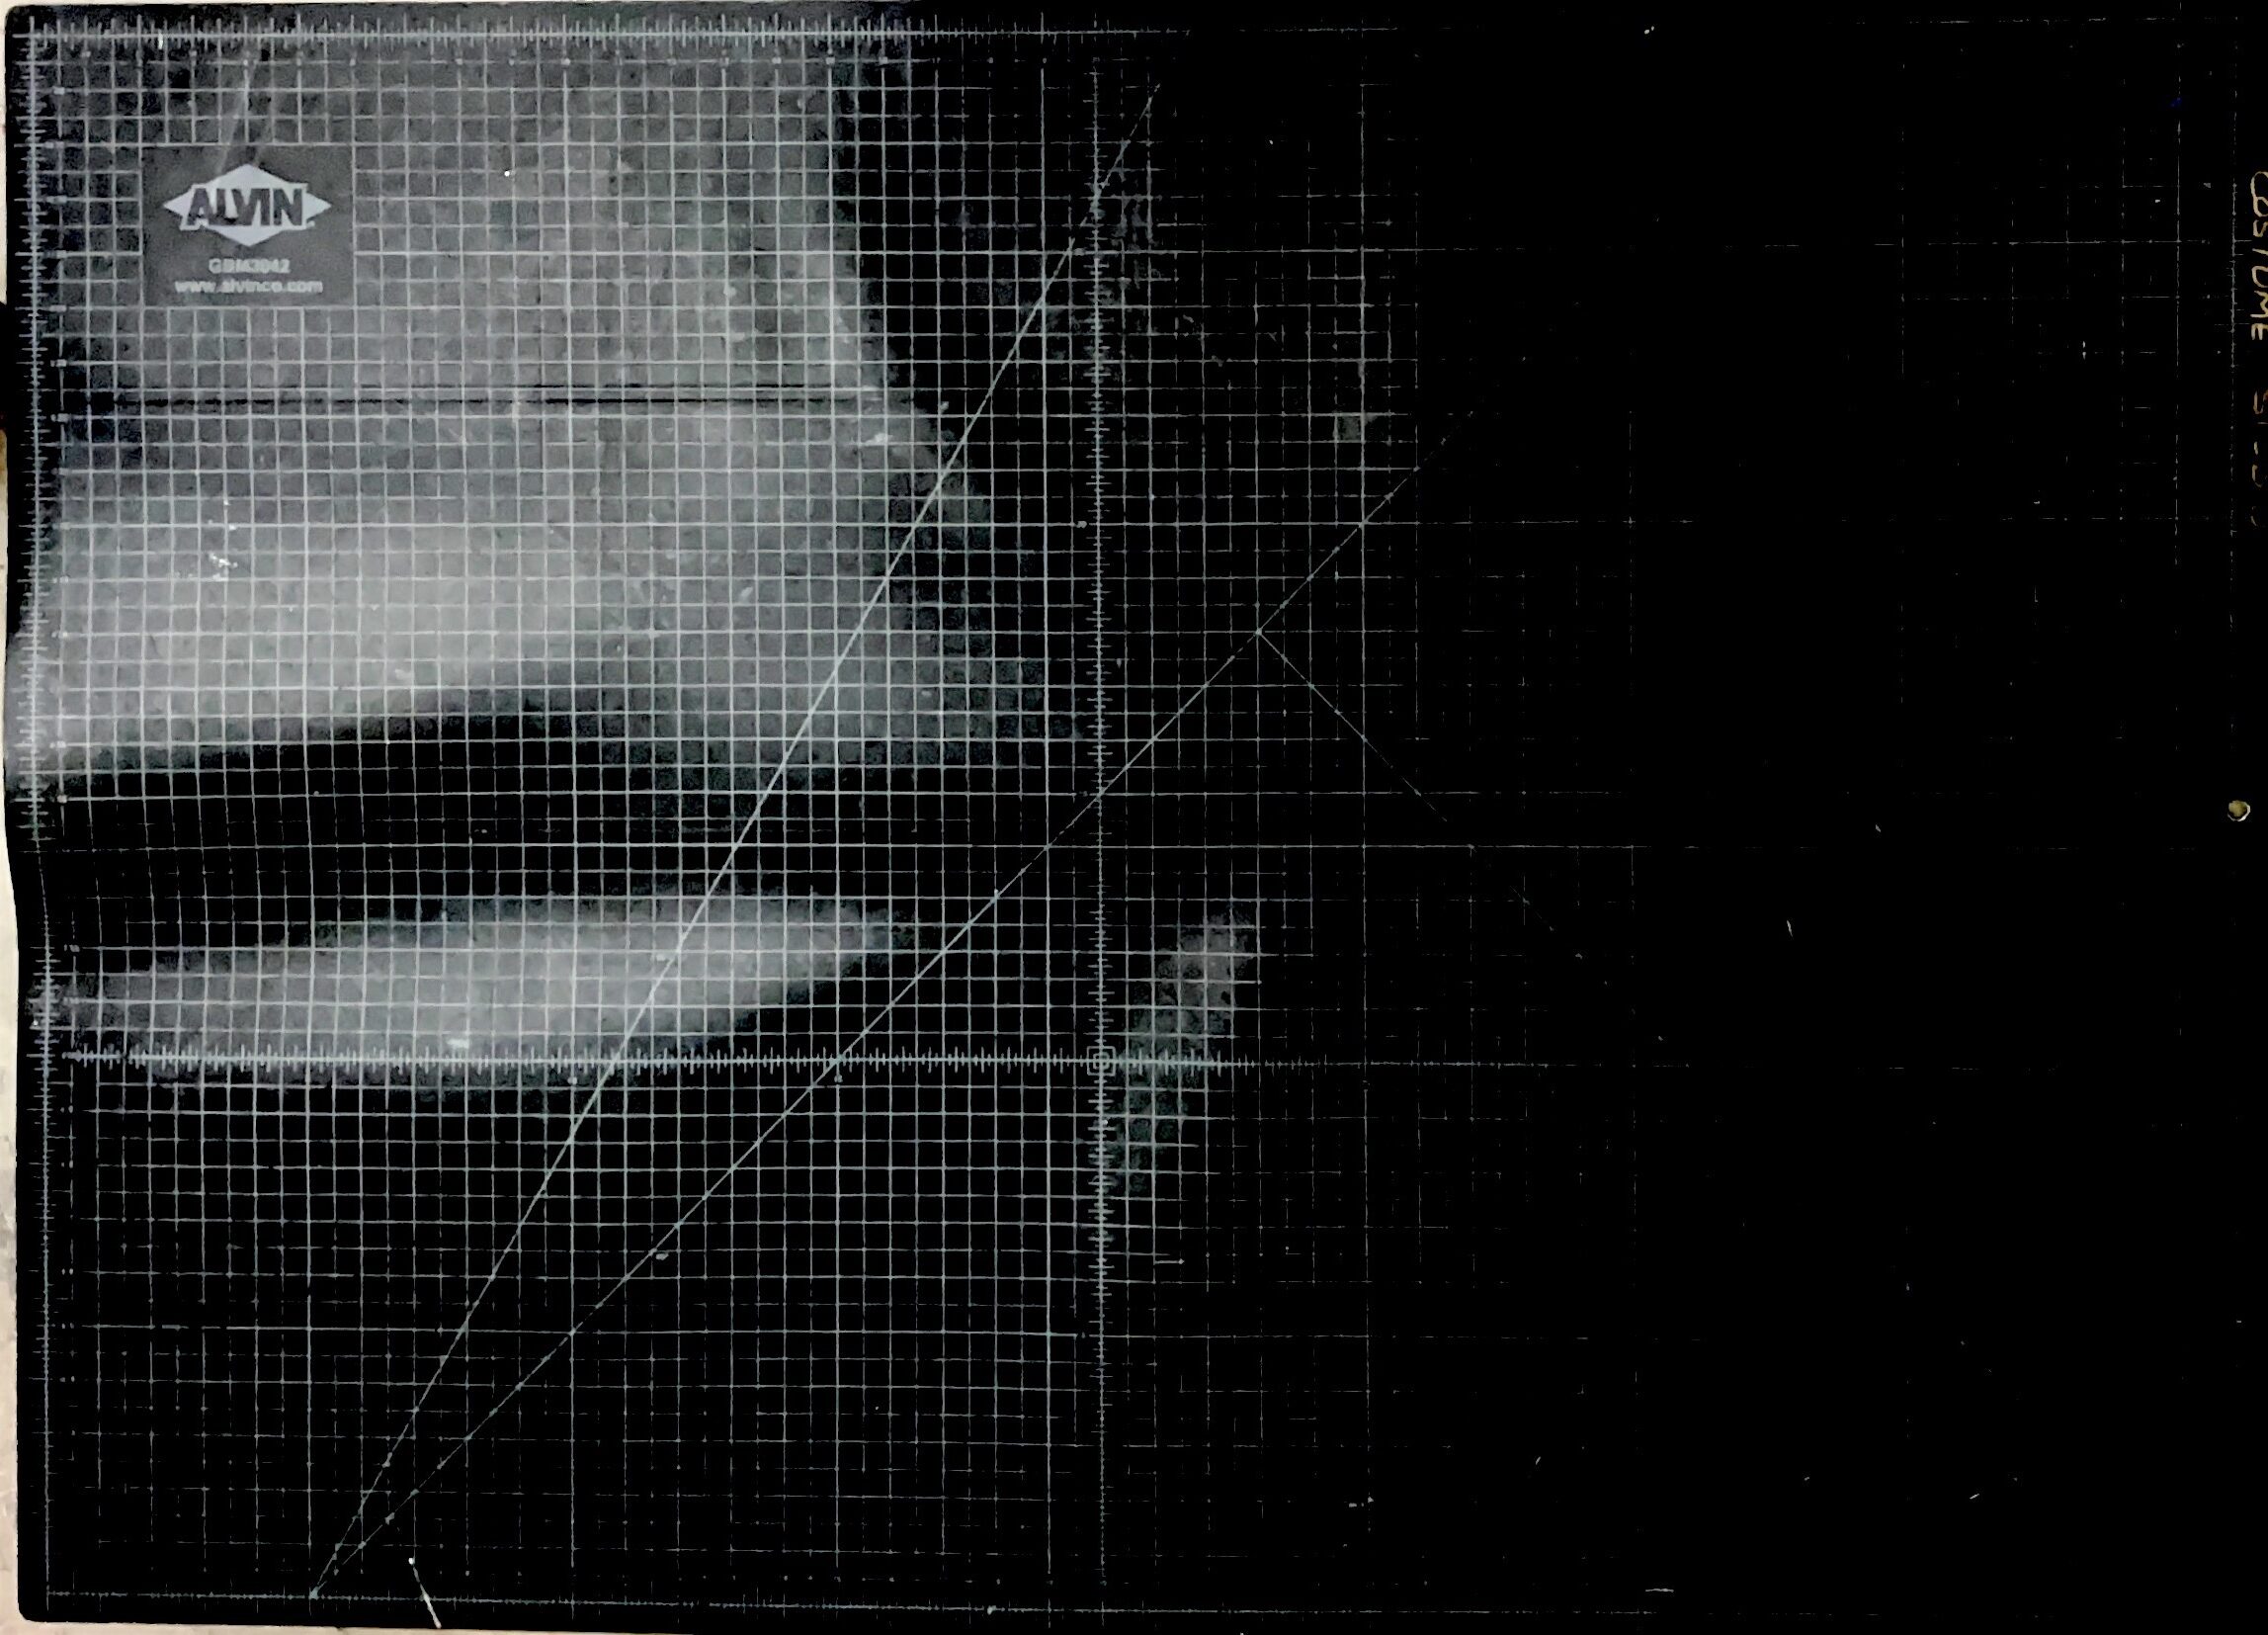
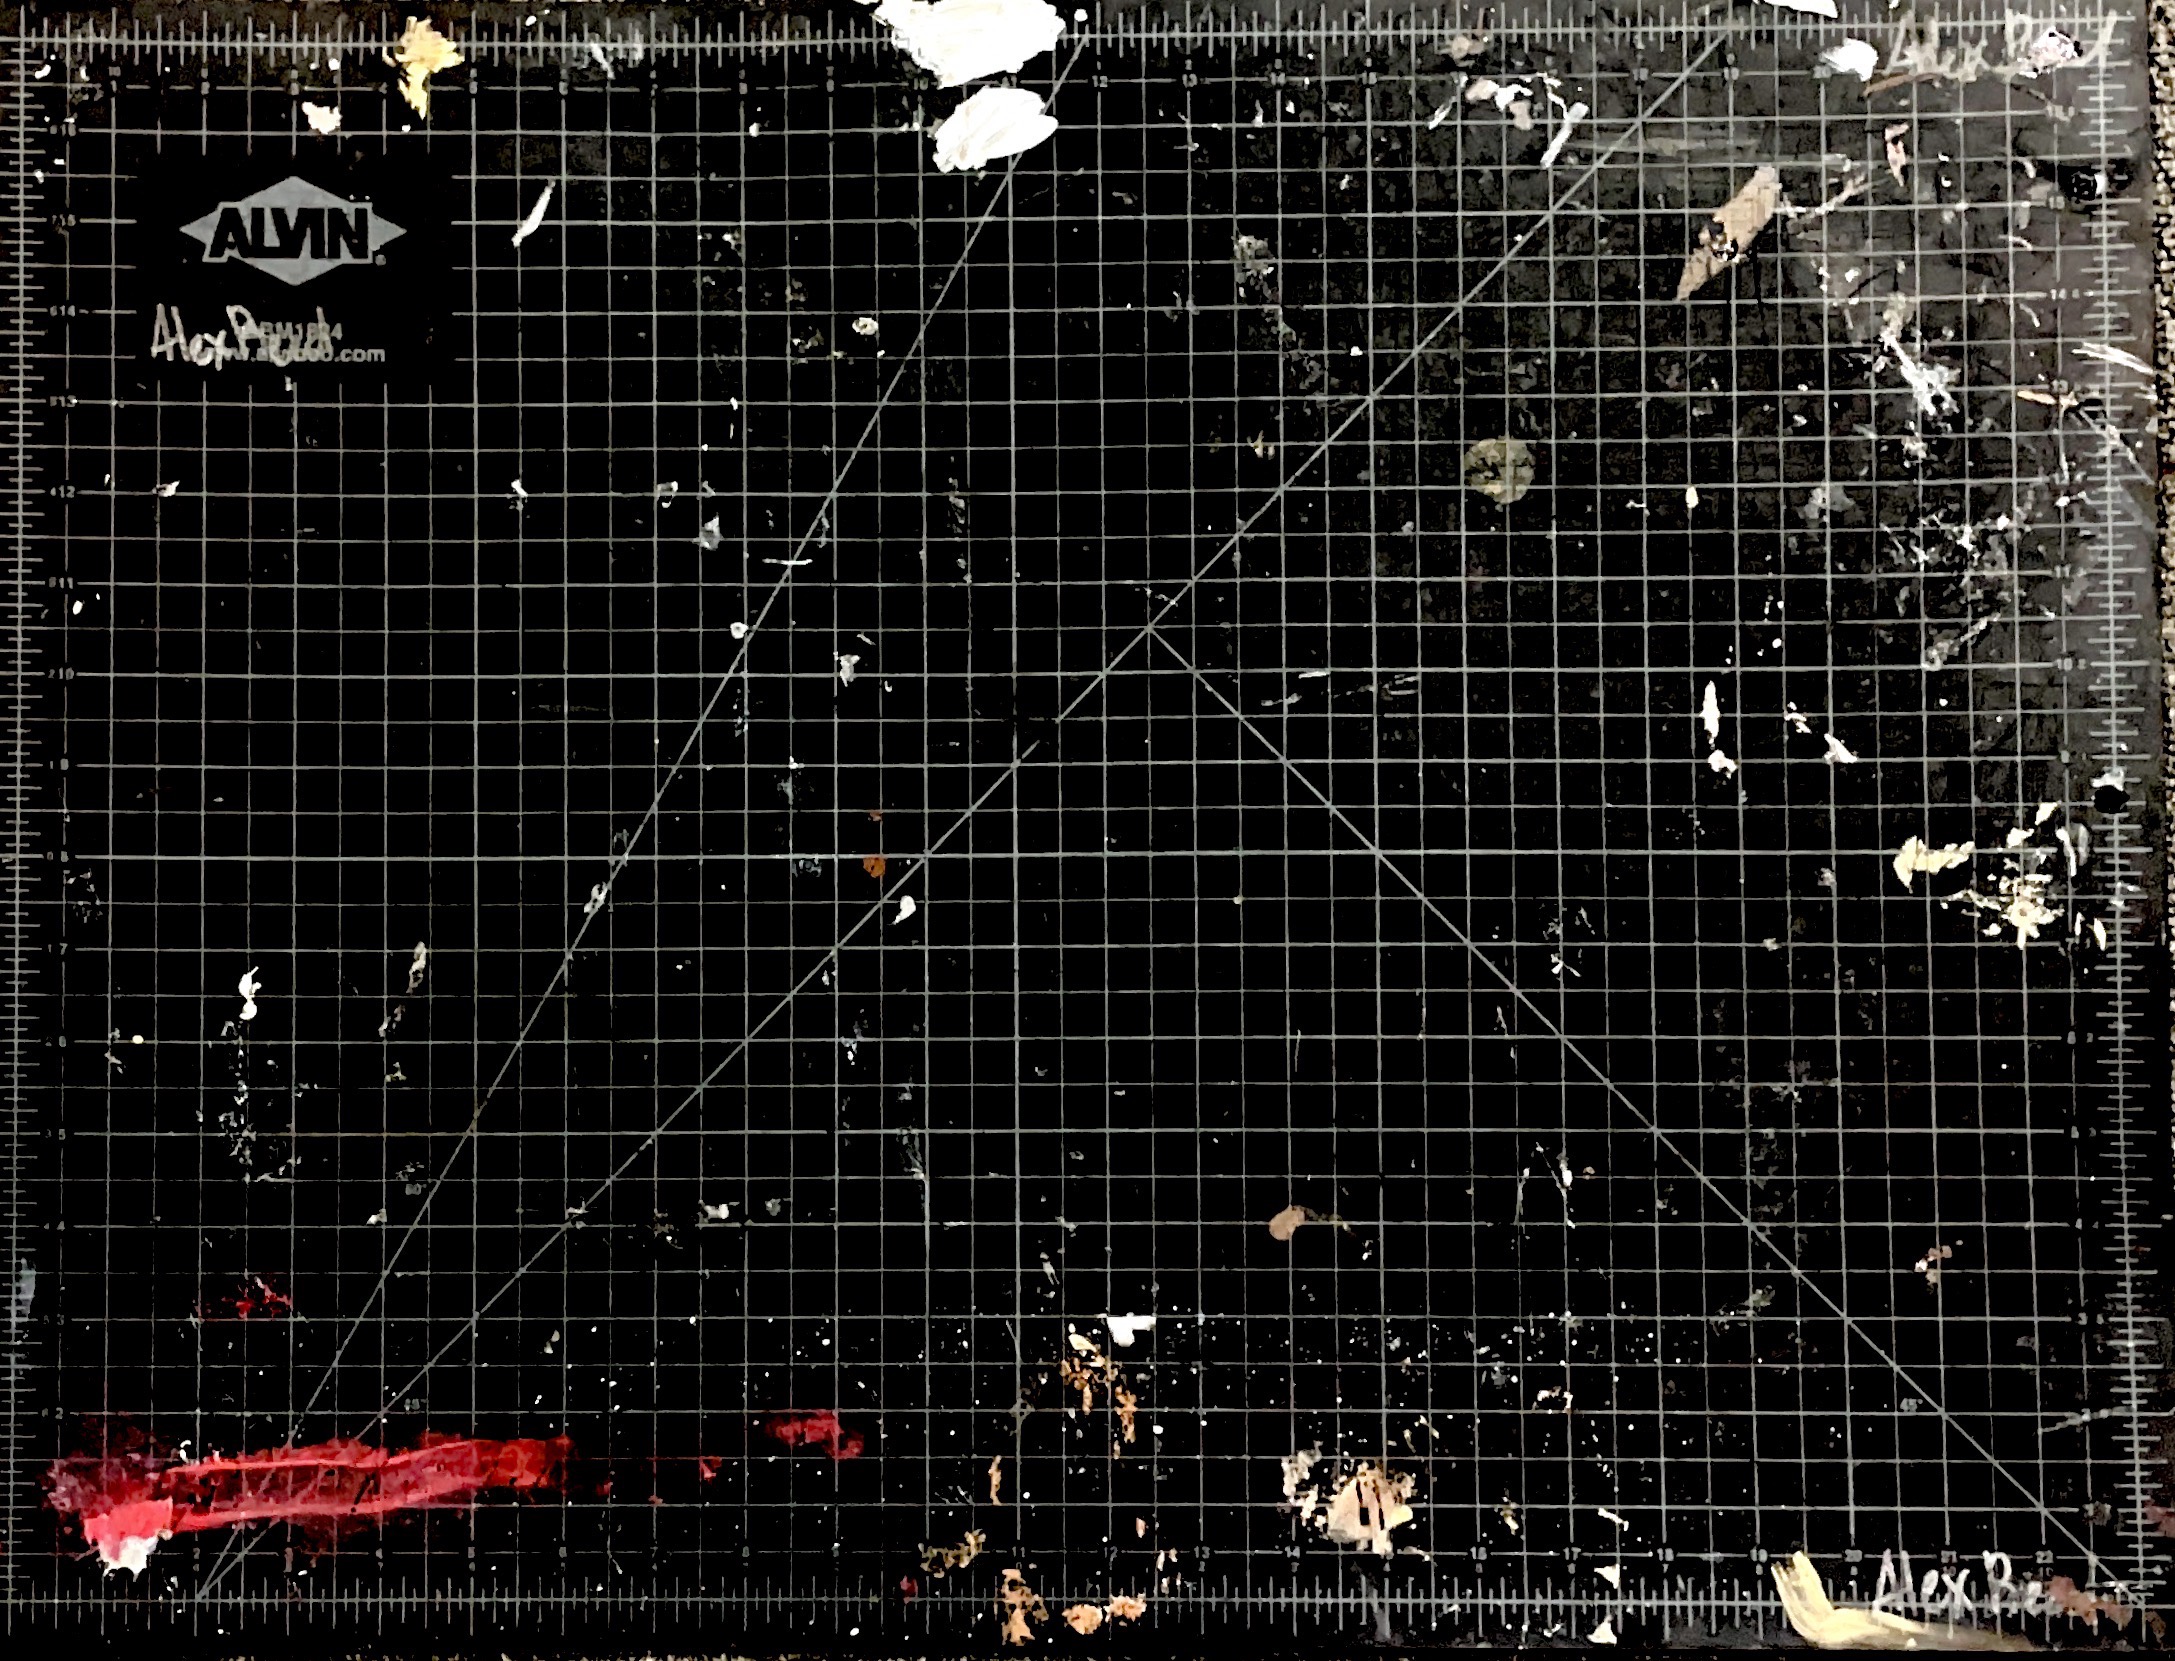
This is the same app, and the same cutting board, but instead, this one was slightly in shadow. And when I say slightly, I mean the only shadow in this image was my own shadow. I was intrigued by how it was able to clearly isolate the scruff marks and paint on top of the board.

I decided to pursue cutting mats as my subject of choice because they are often neglected in the creative process. There is nothing that shows your progress more than the surface you work on, and I wanted to see if I could isolate the evidence of work from the mat itself using the simple Apple Notes app document scanner feature.

The Workflow

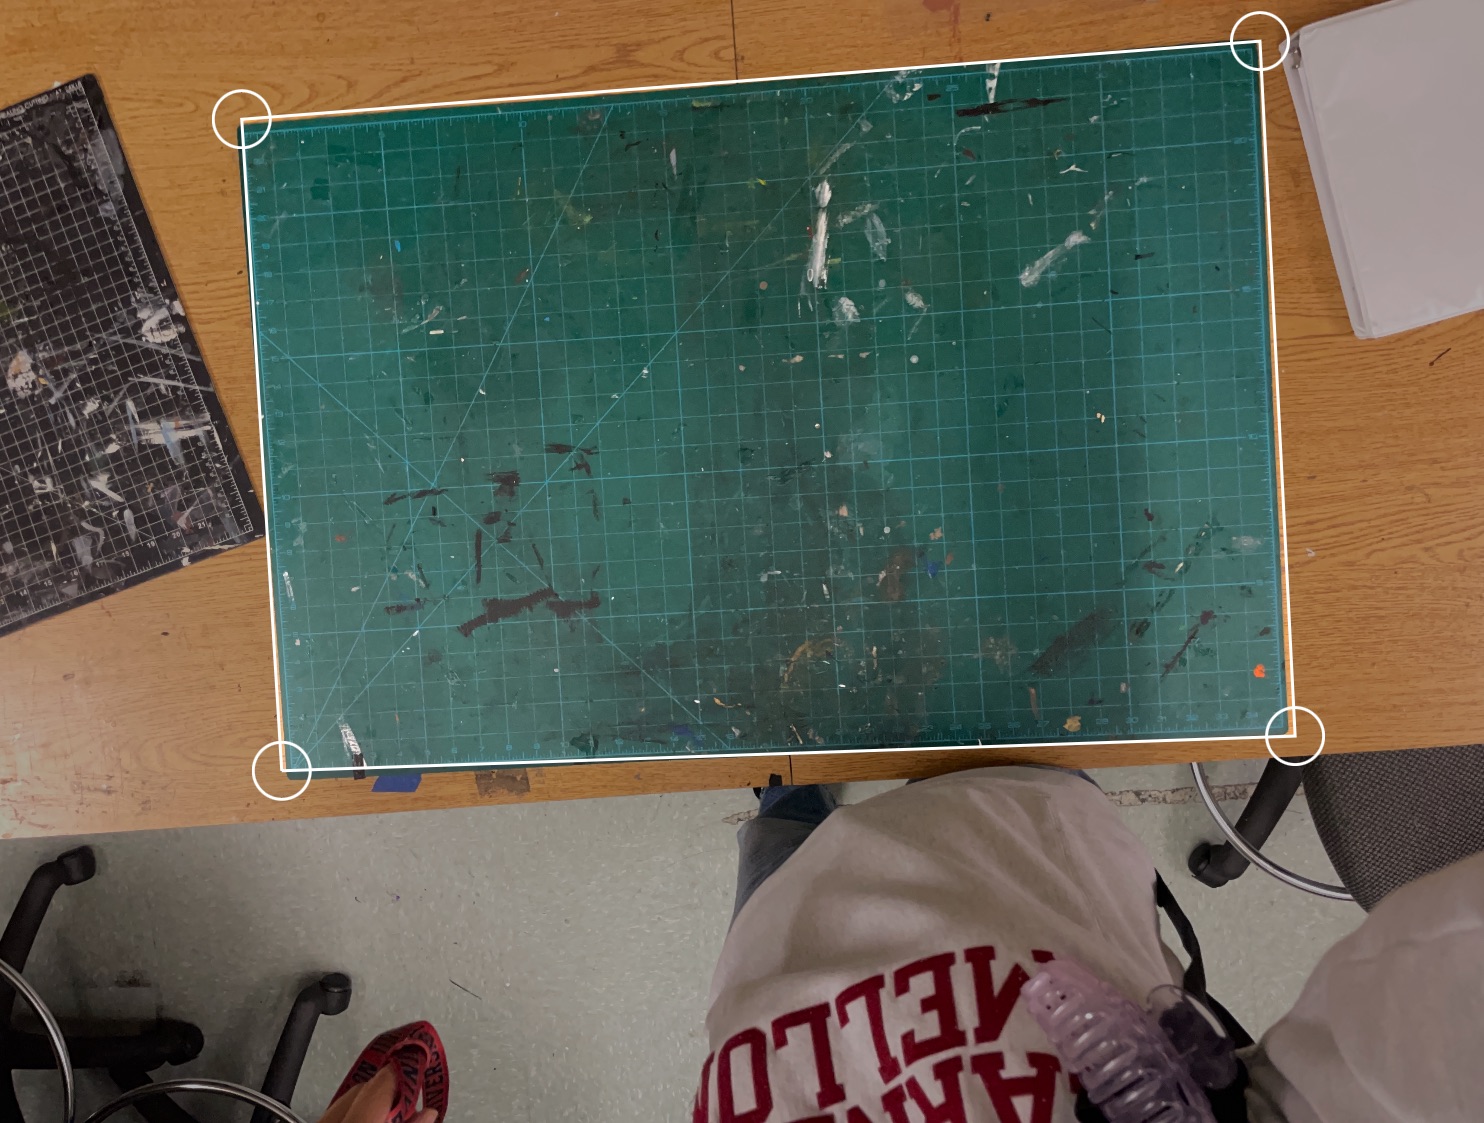
The workflow I developed was to place the cutting mat either on the floor or table and use the auto-capture feature to select my mat and take a picture. Sometimes the auto-capture will fail to work and I would have to take a general picture and use the four circles to crop where I want the app to scan:

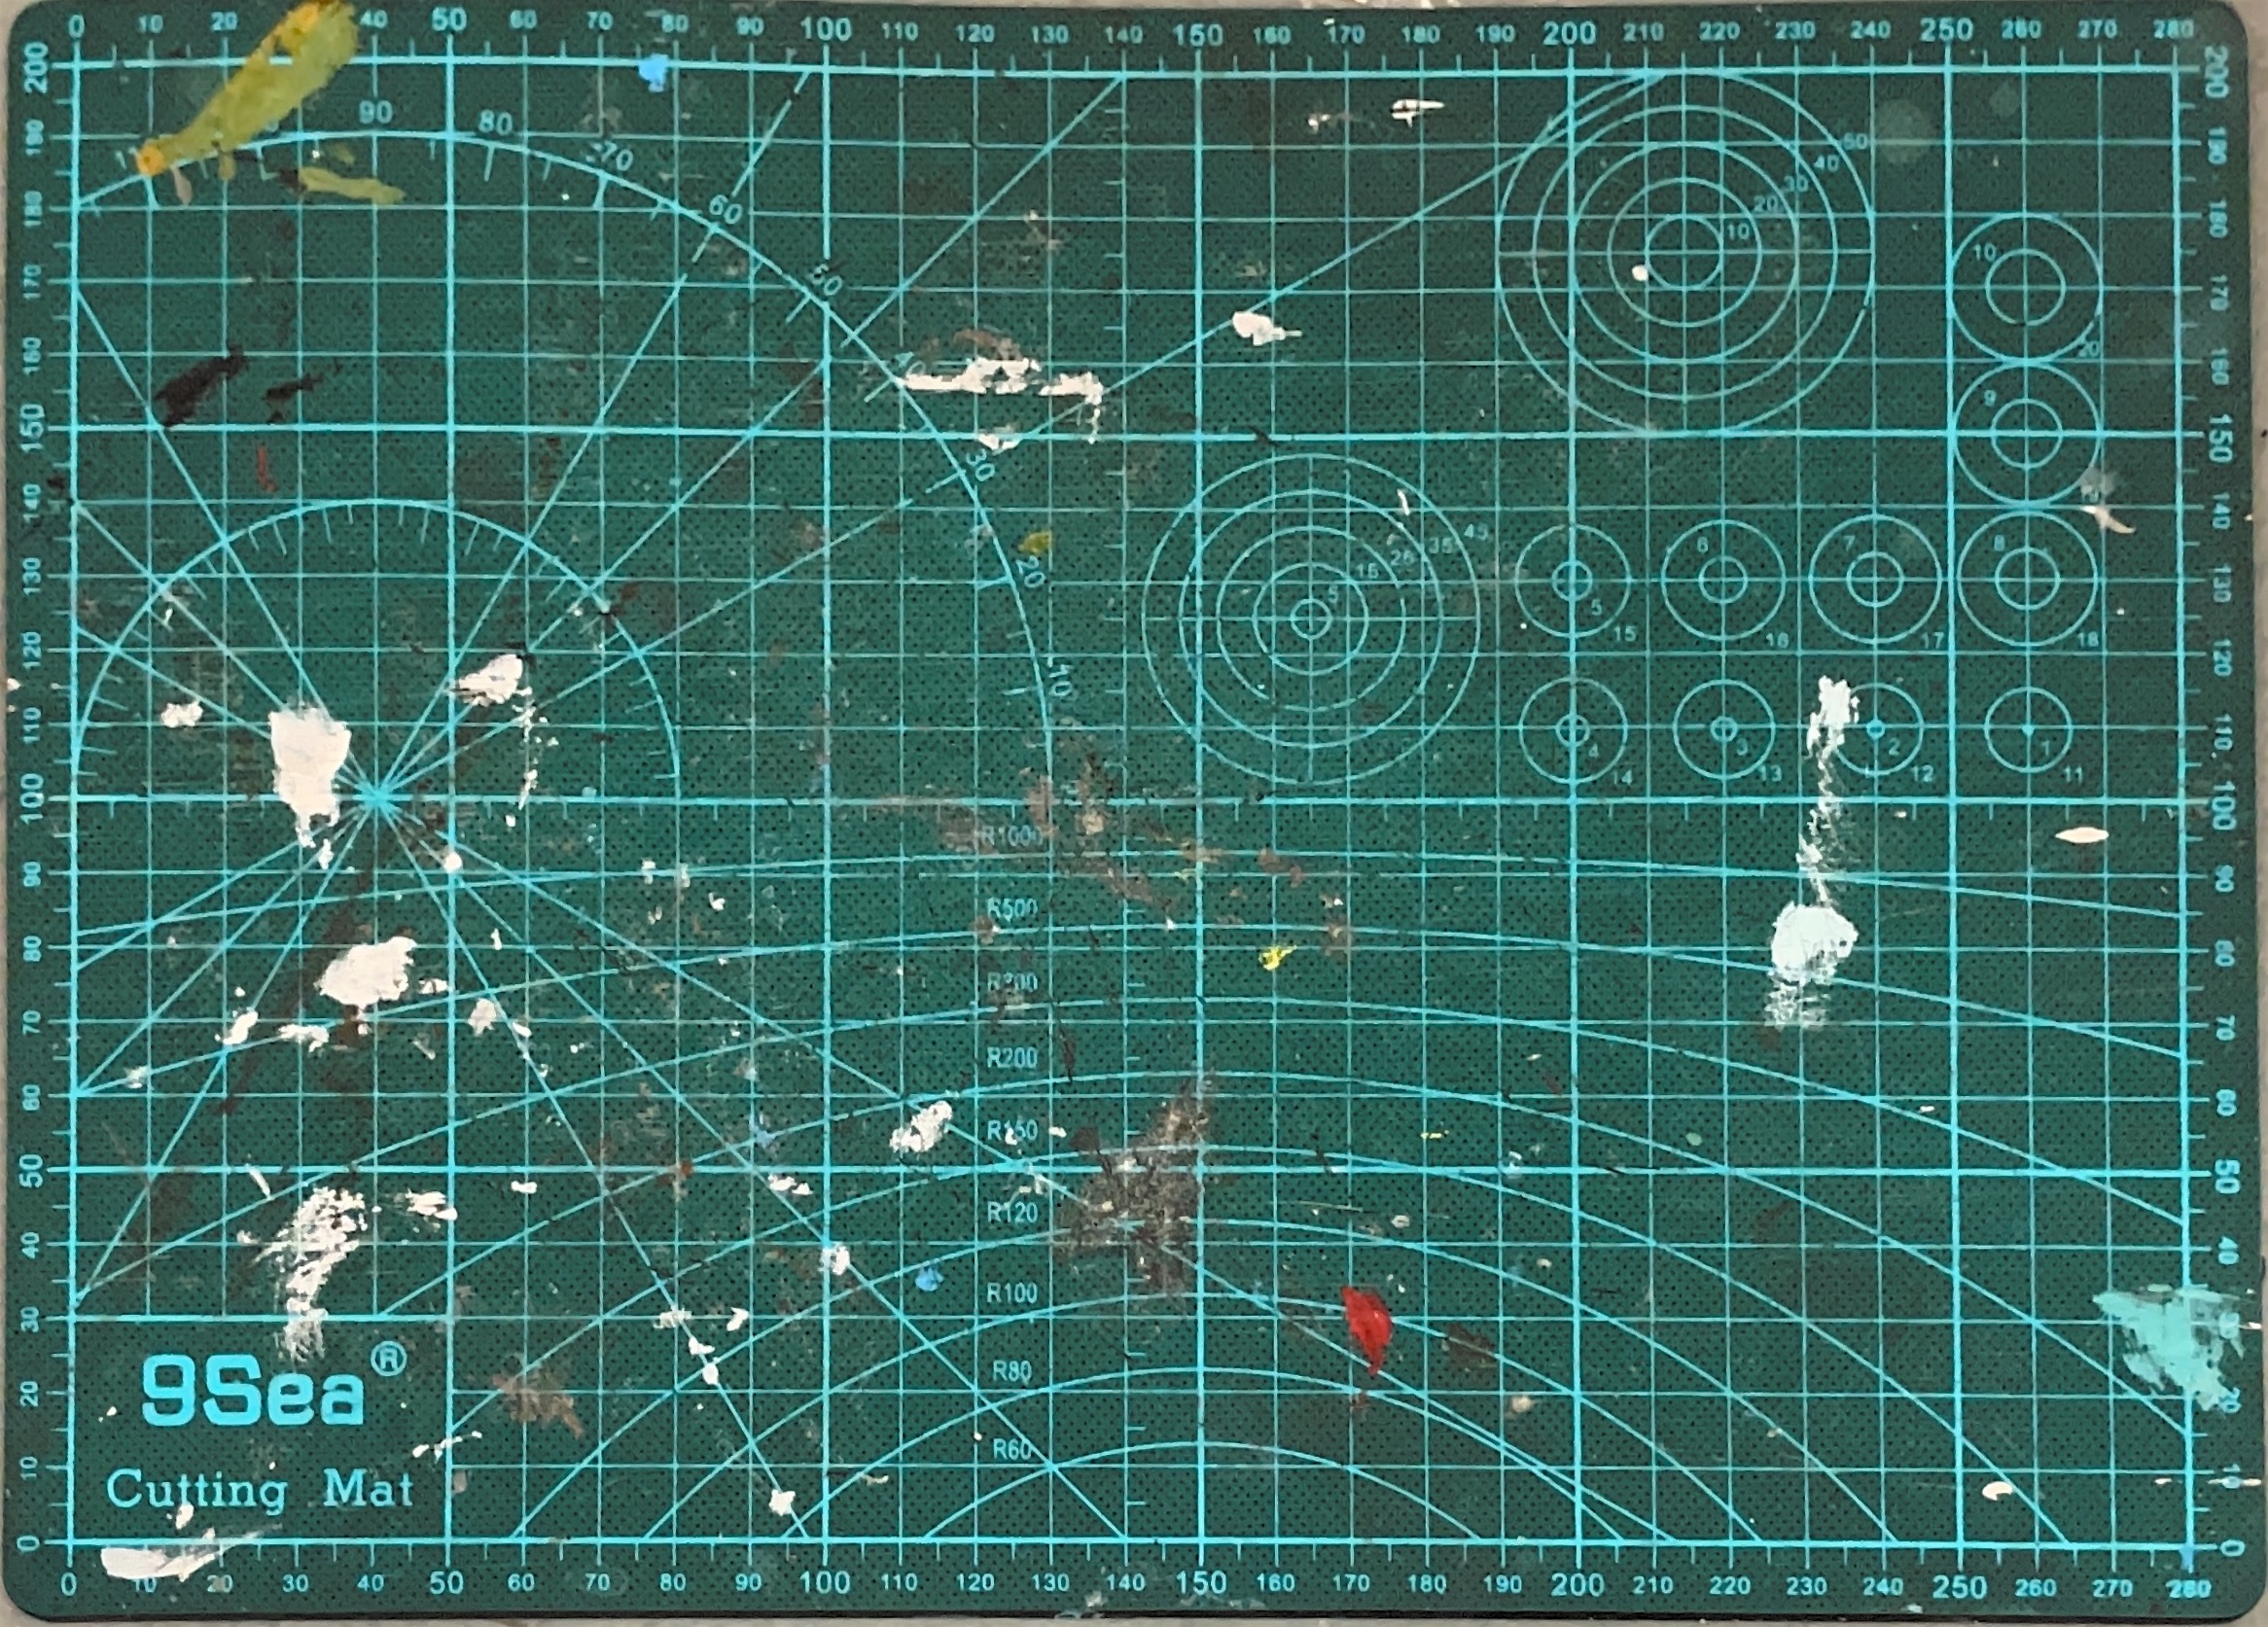
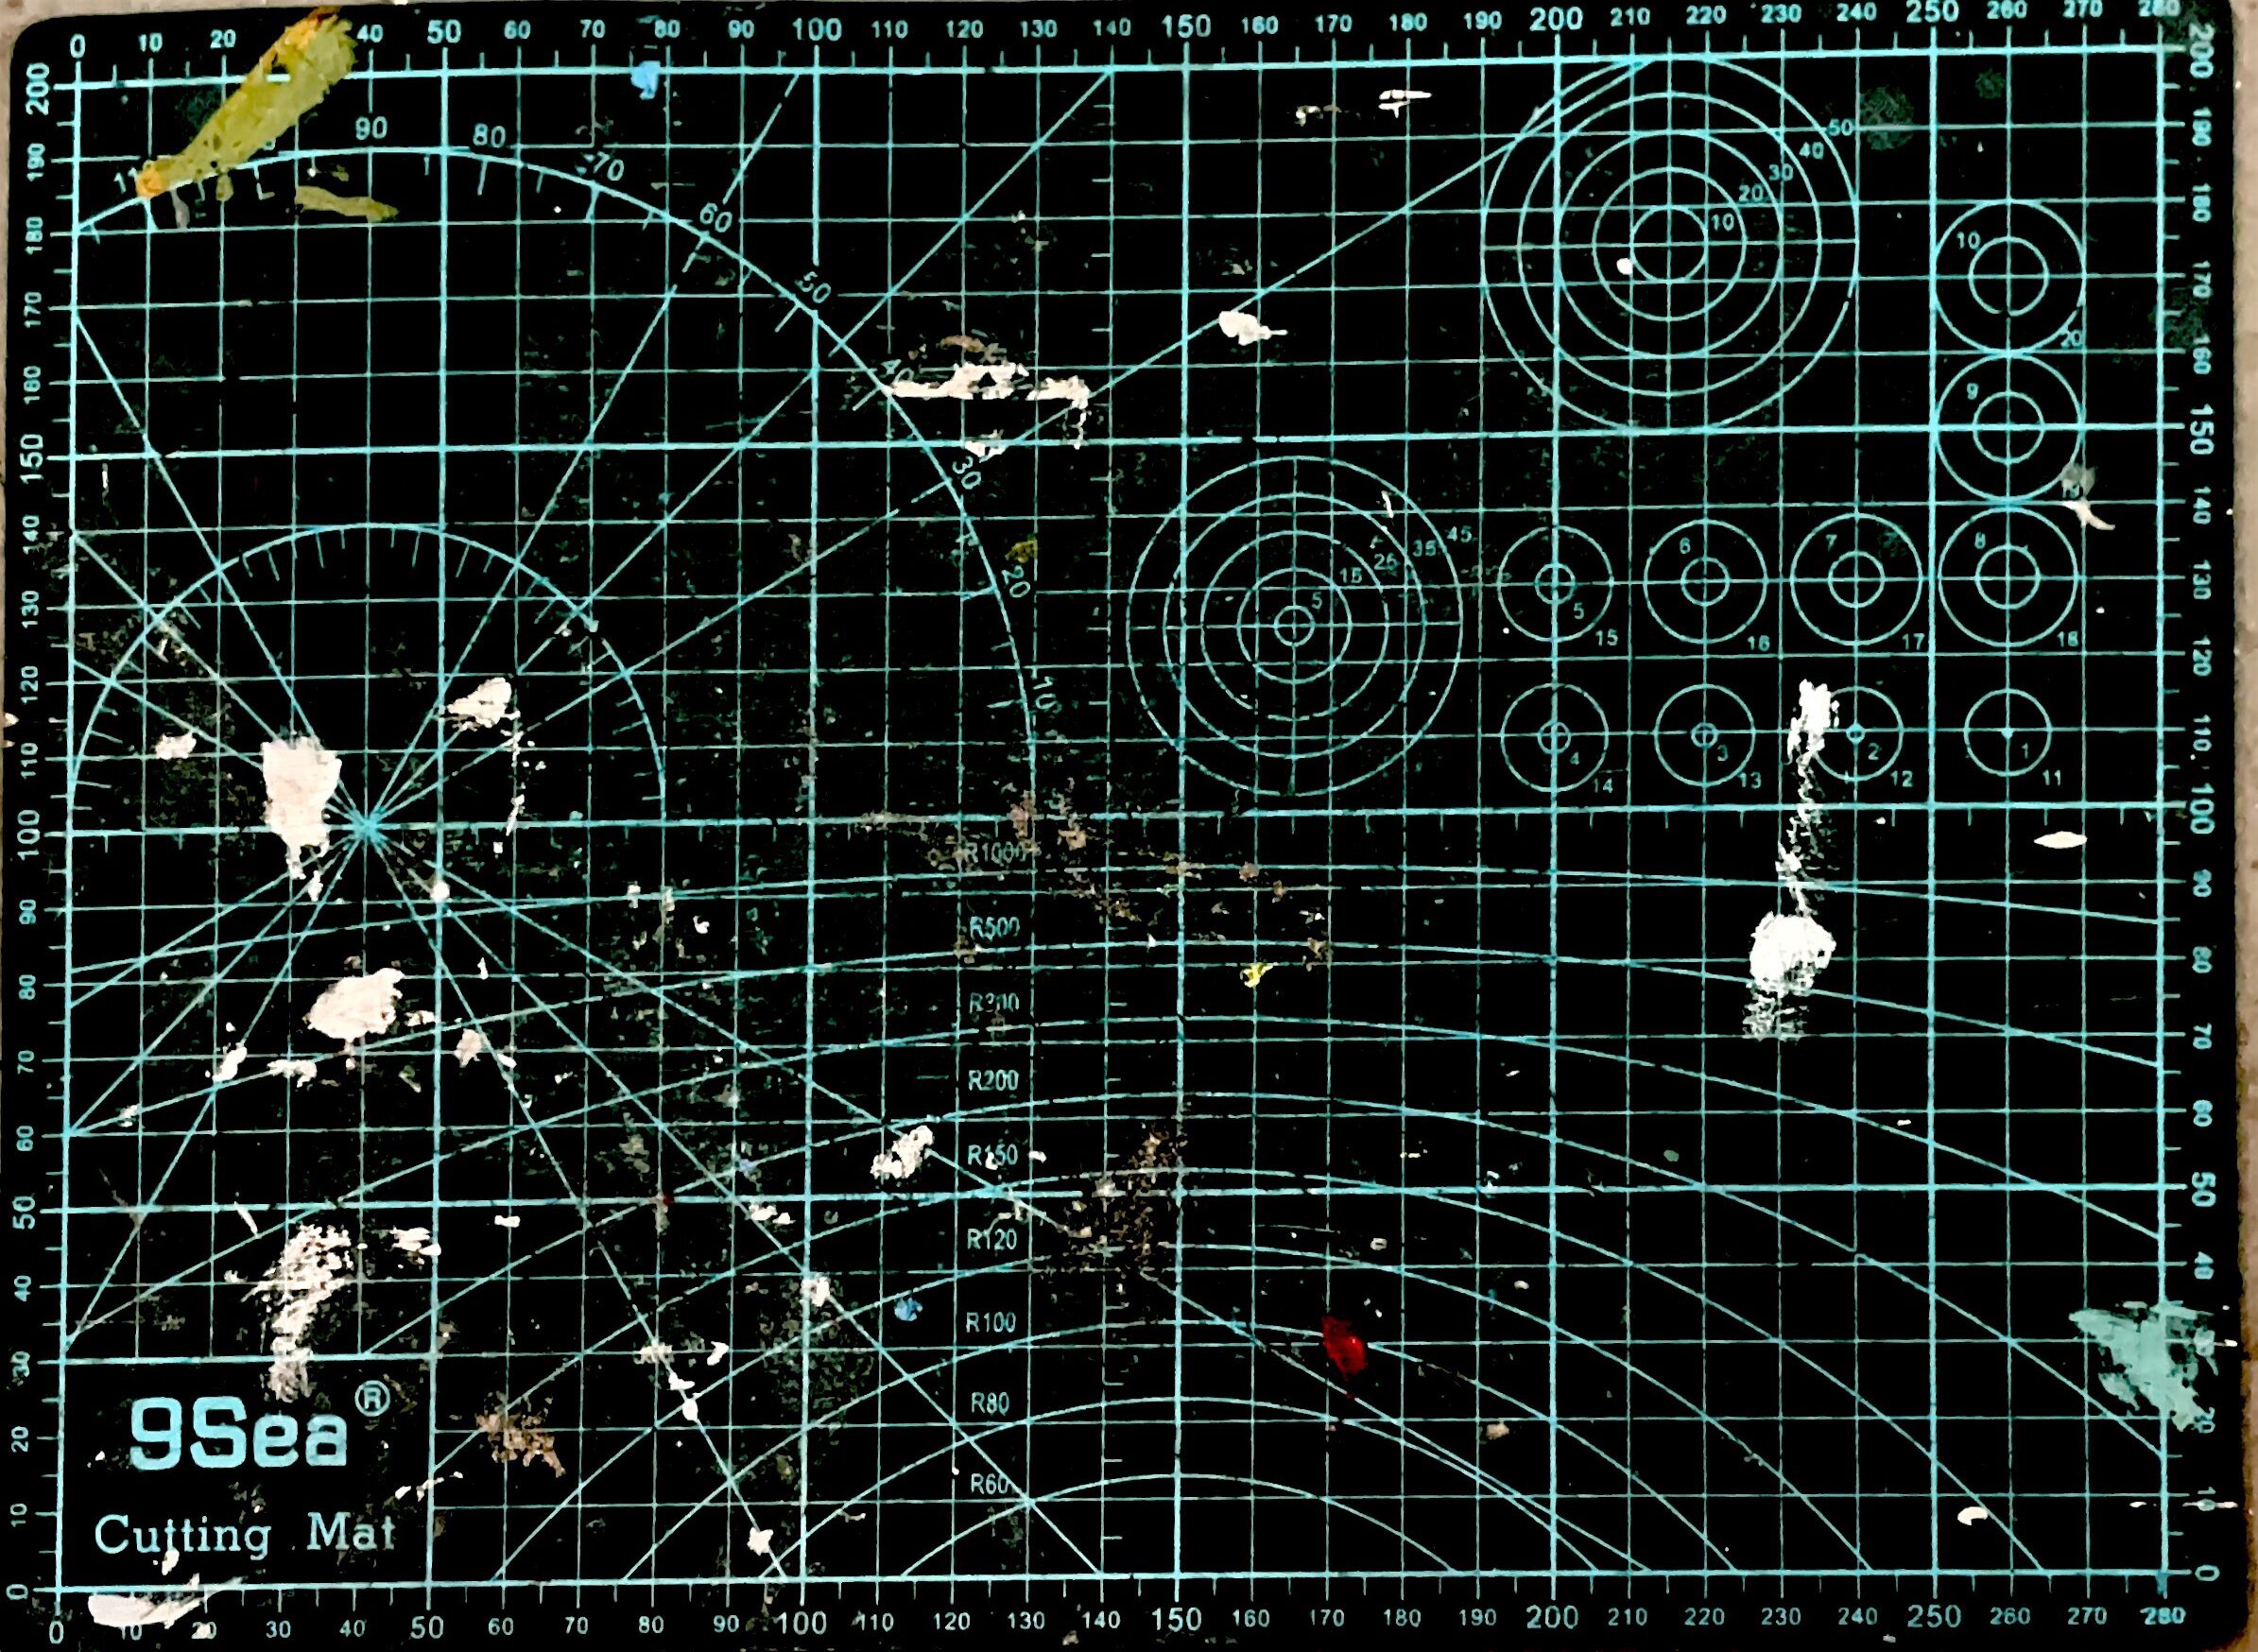
After taking the picture in even lighting (which I defined by fluorescent overhead lighting), I would move the cutting mat to a shadowed location and take another picture and compare.

The Results 

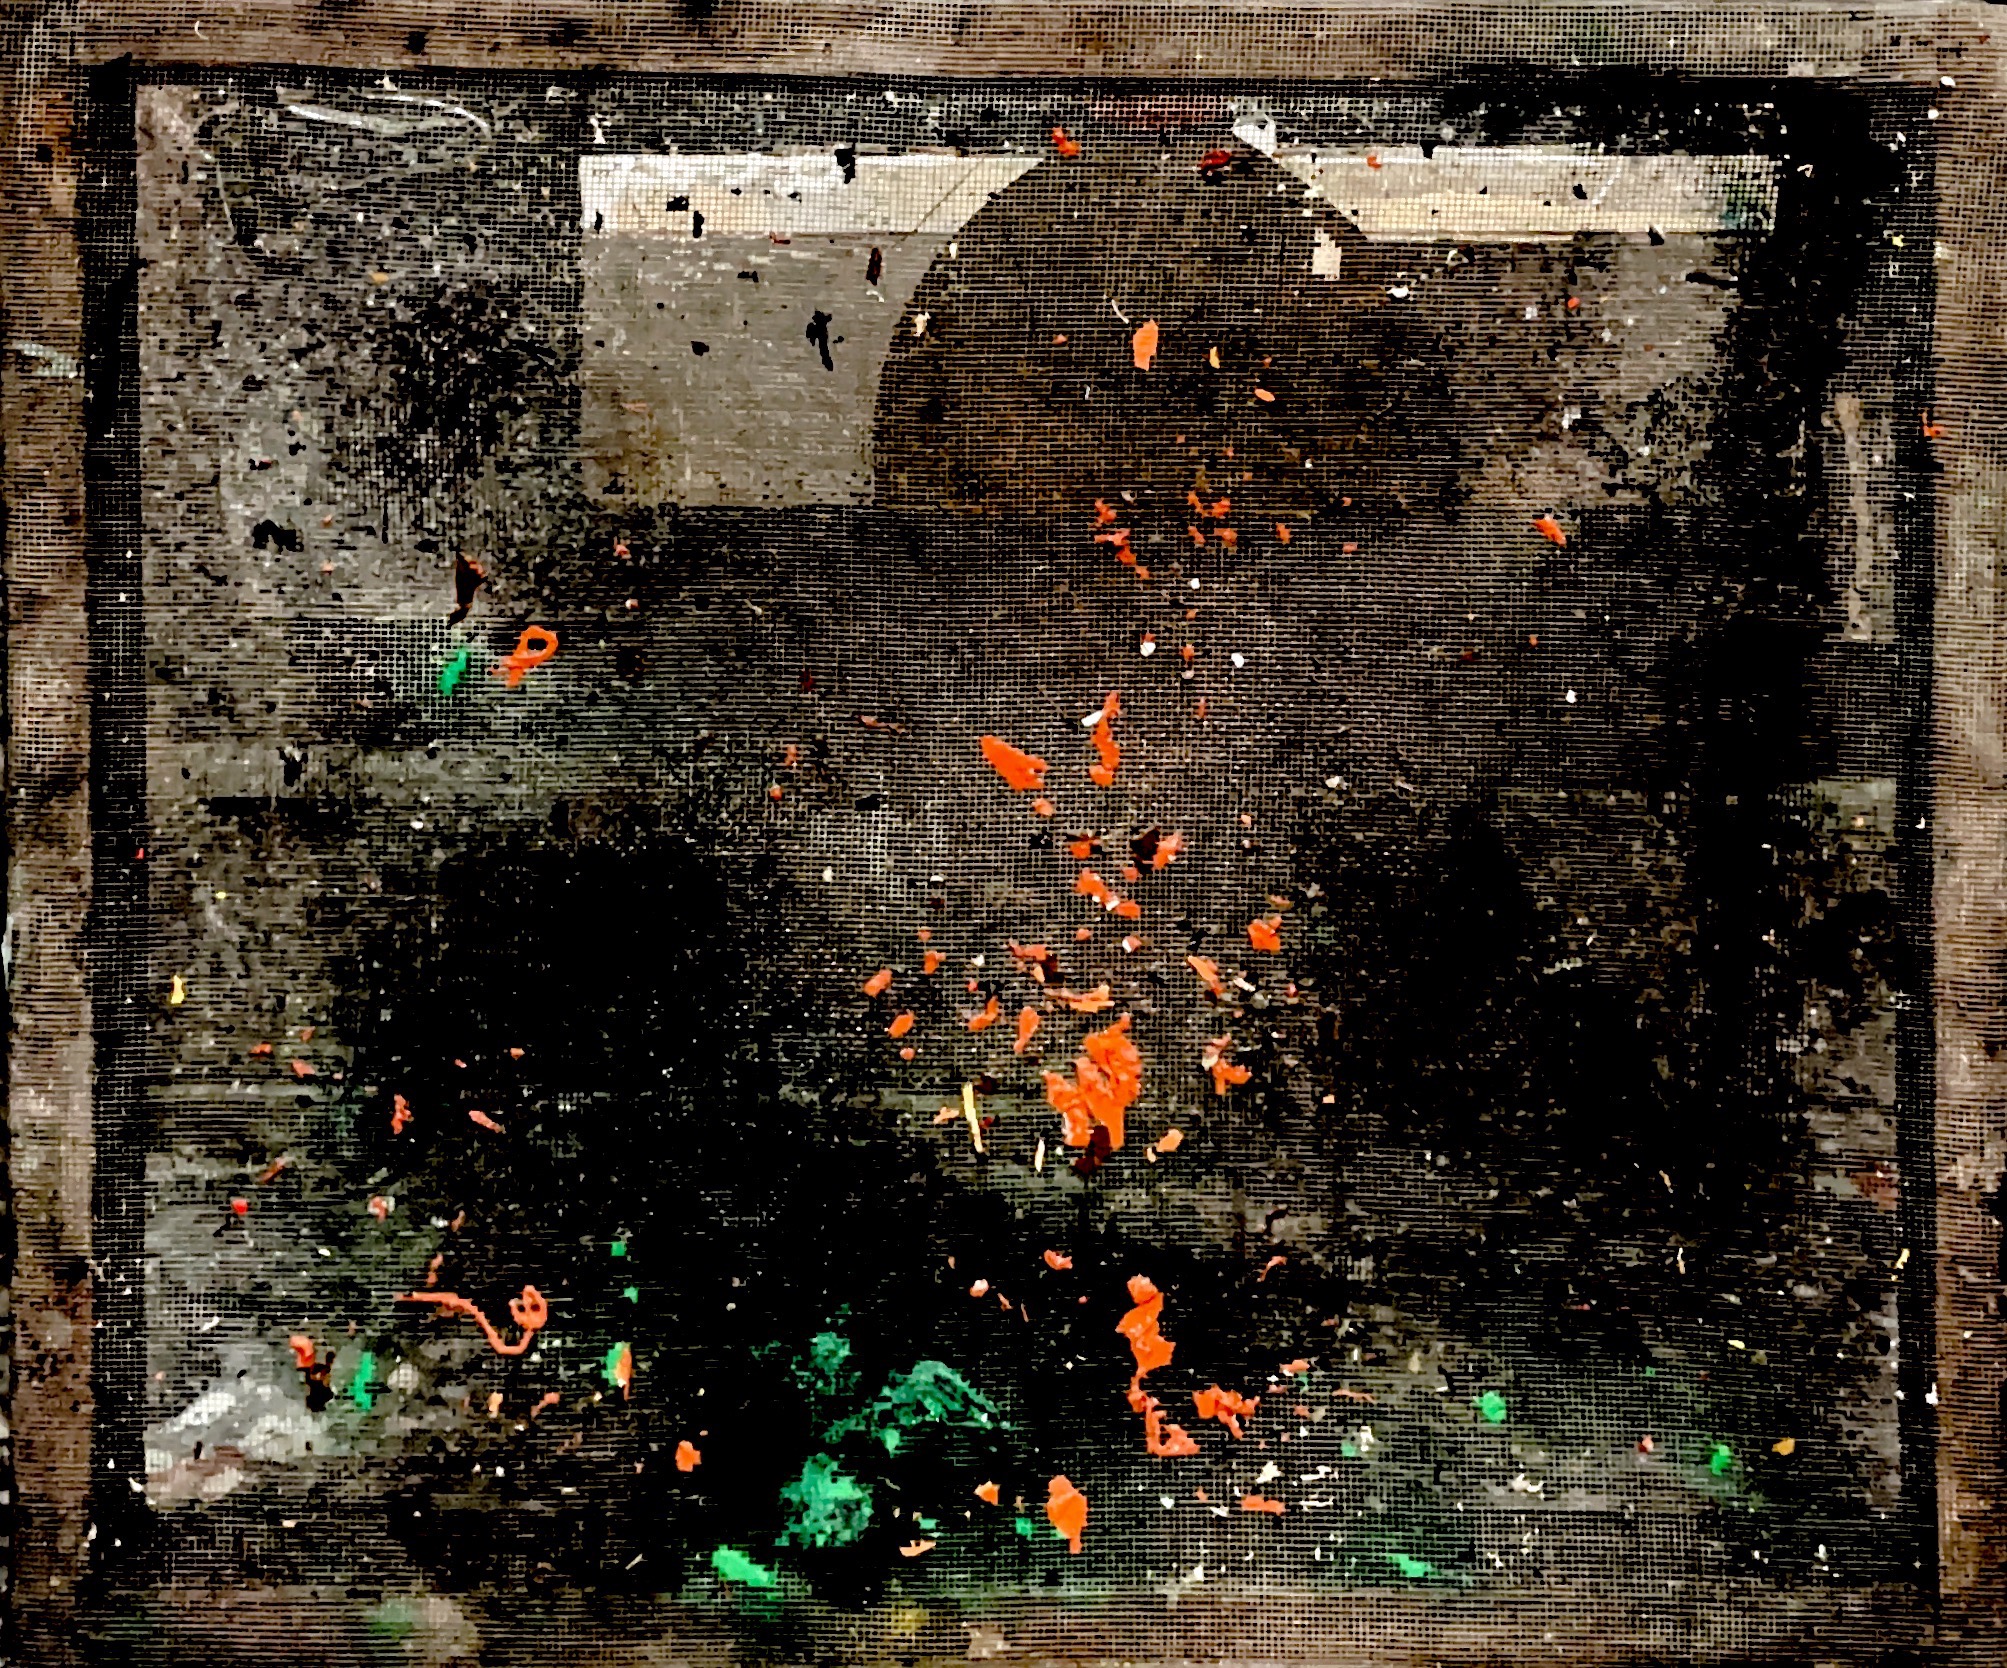
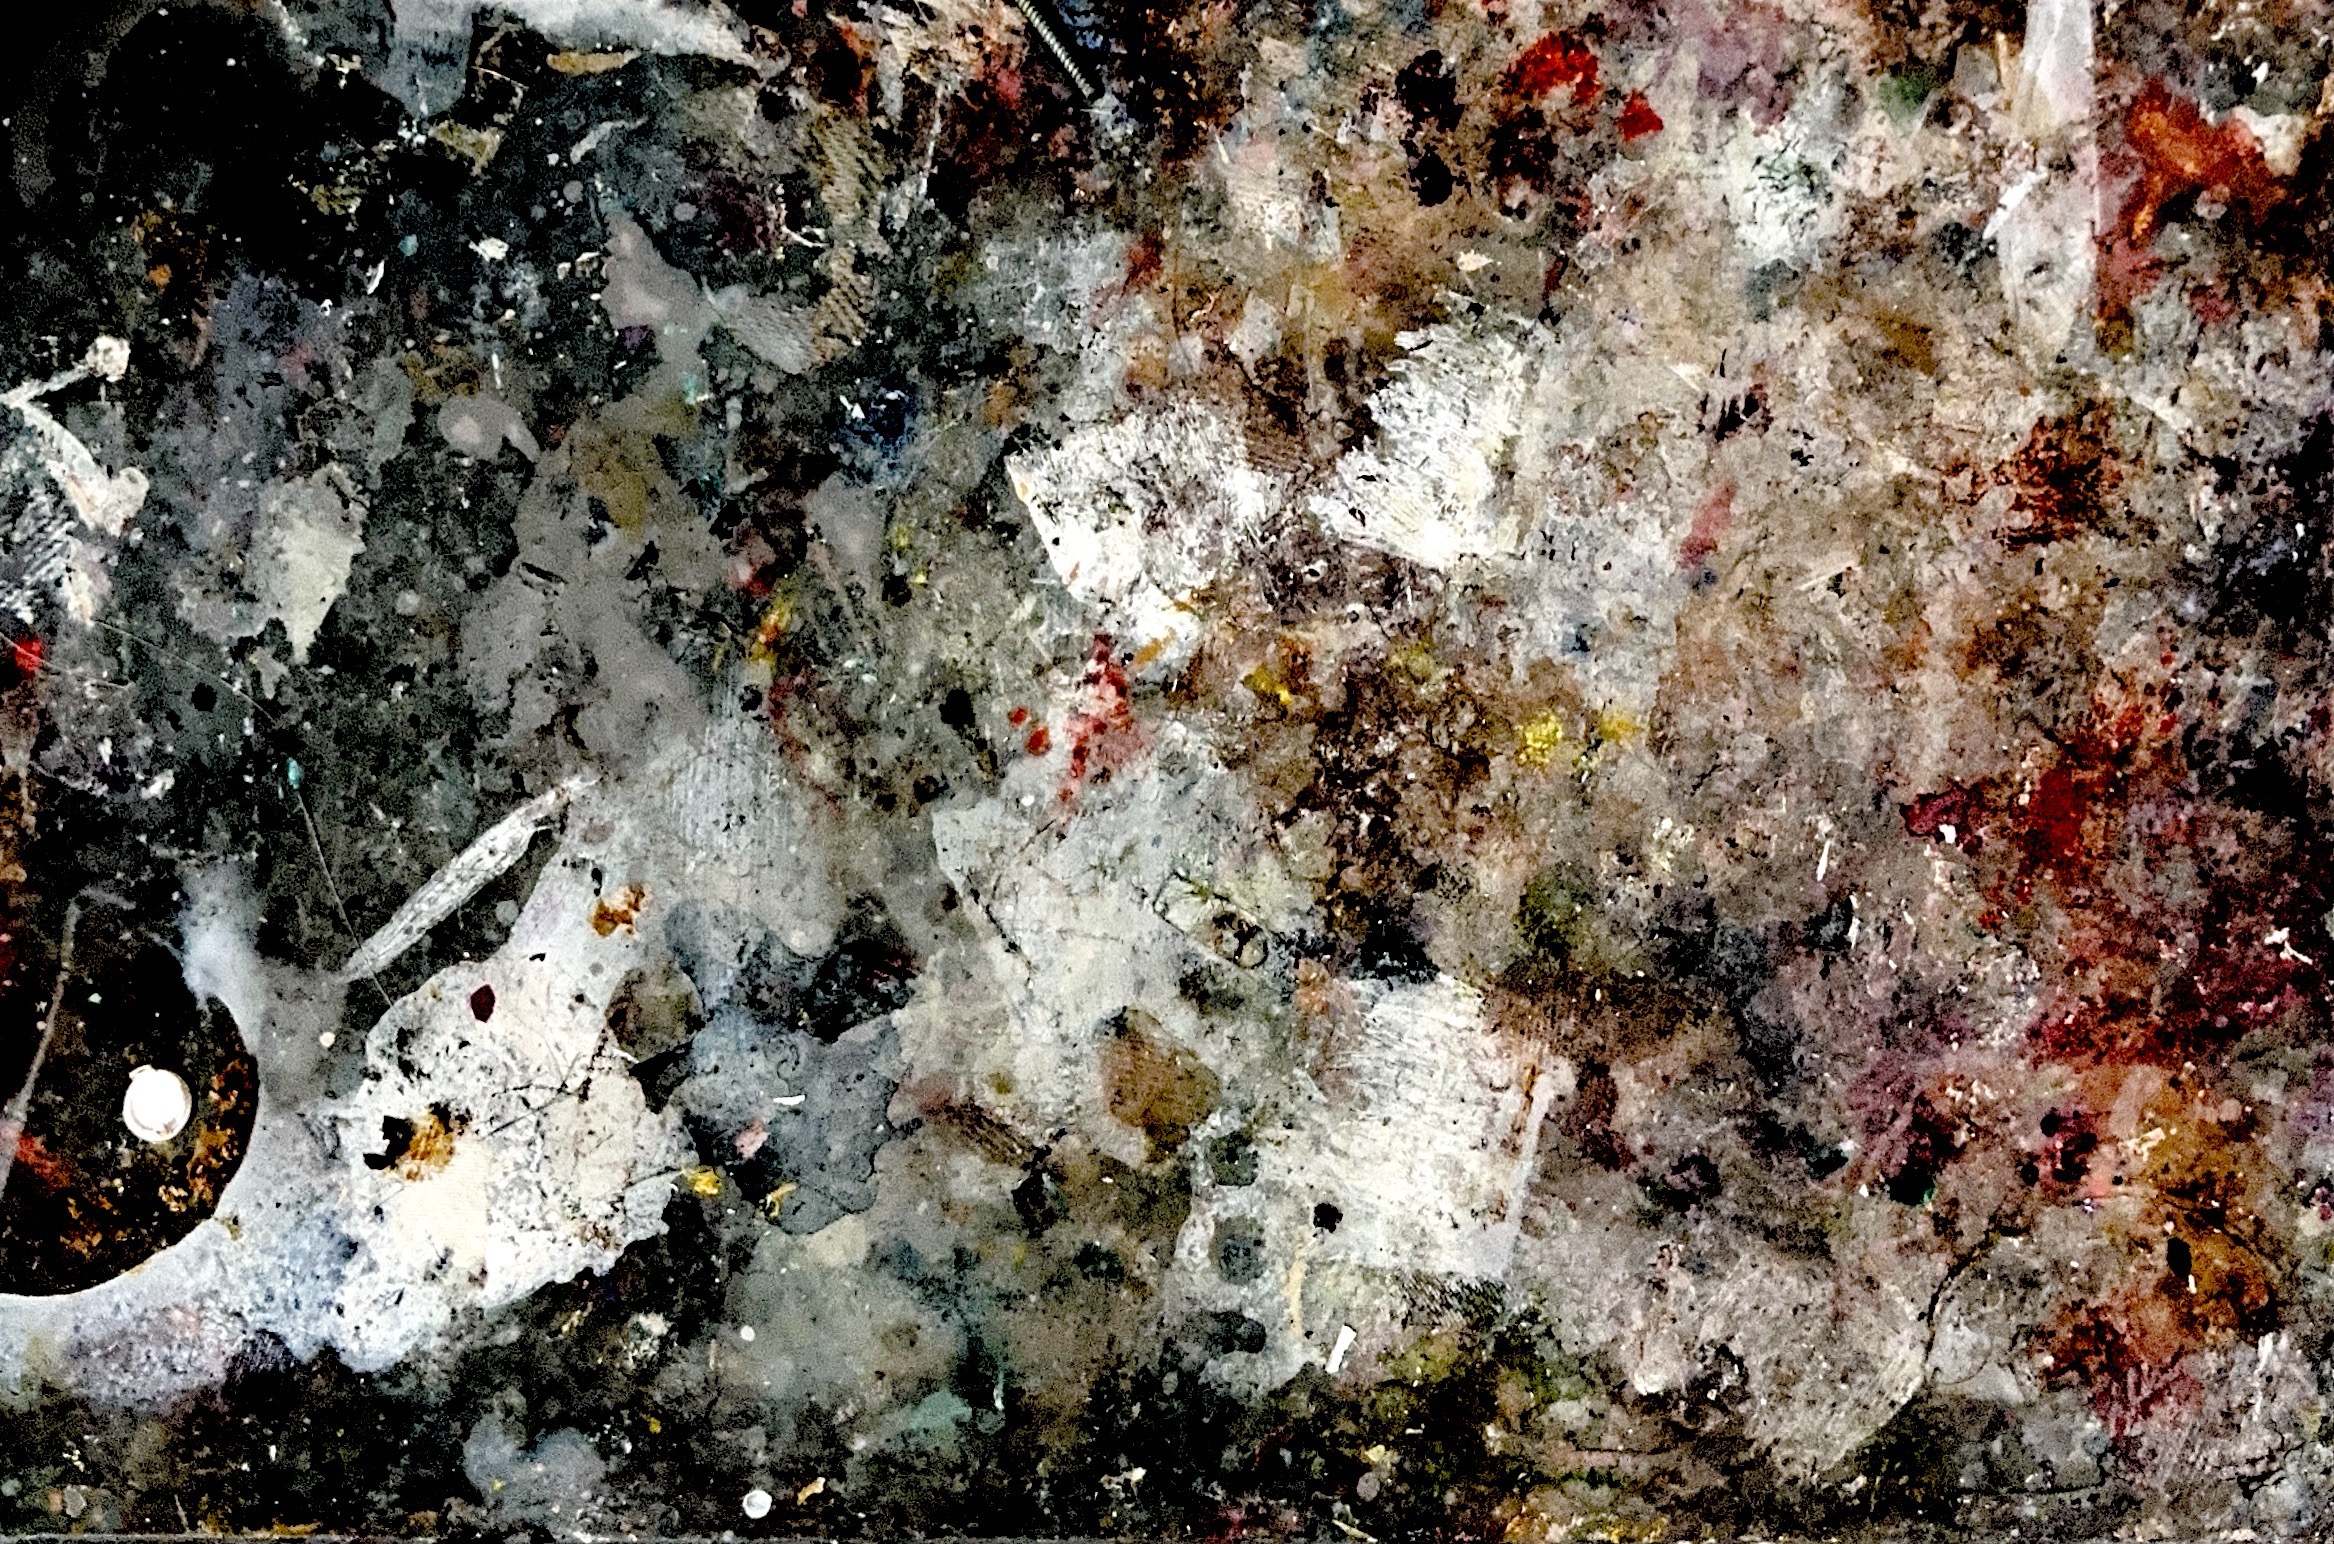
Some Selected Scans:

Some Fun Ones:

Troubleshooting

Things I realized with this project:

  • The contrast between the floor and the mat matters for the auto-capture to work. The scans look best when it is shot by auto-focused capture as they are less likely to be warped and capture the details better. Example:
Manual Shot
Auto-Capture
  • Diffused lighting is key to getting the best scans without light spots.
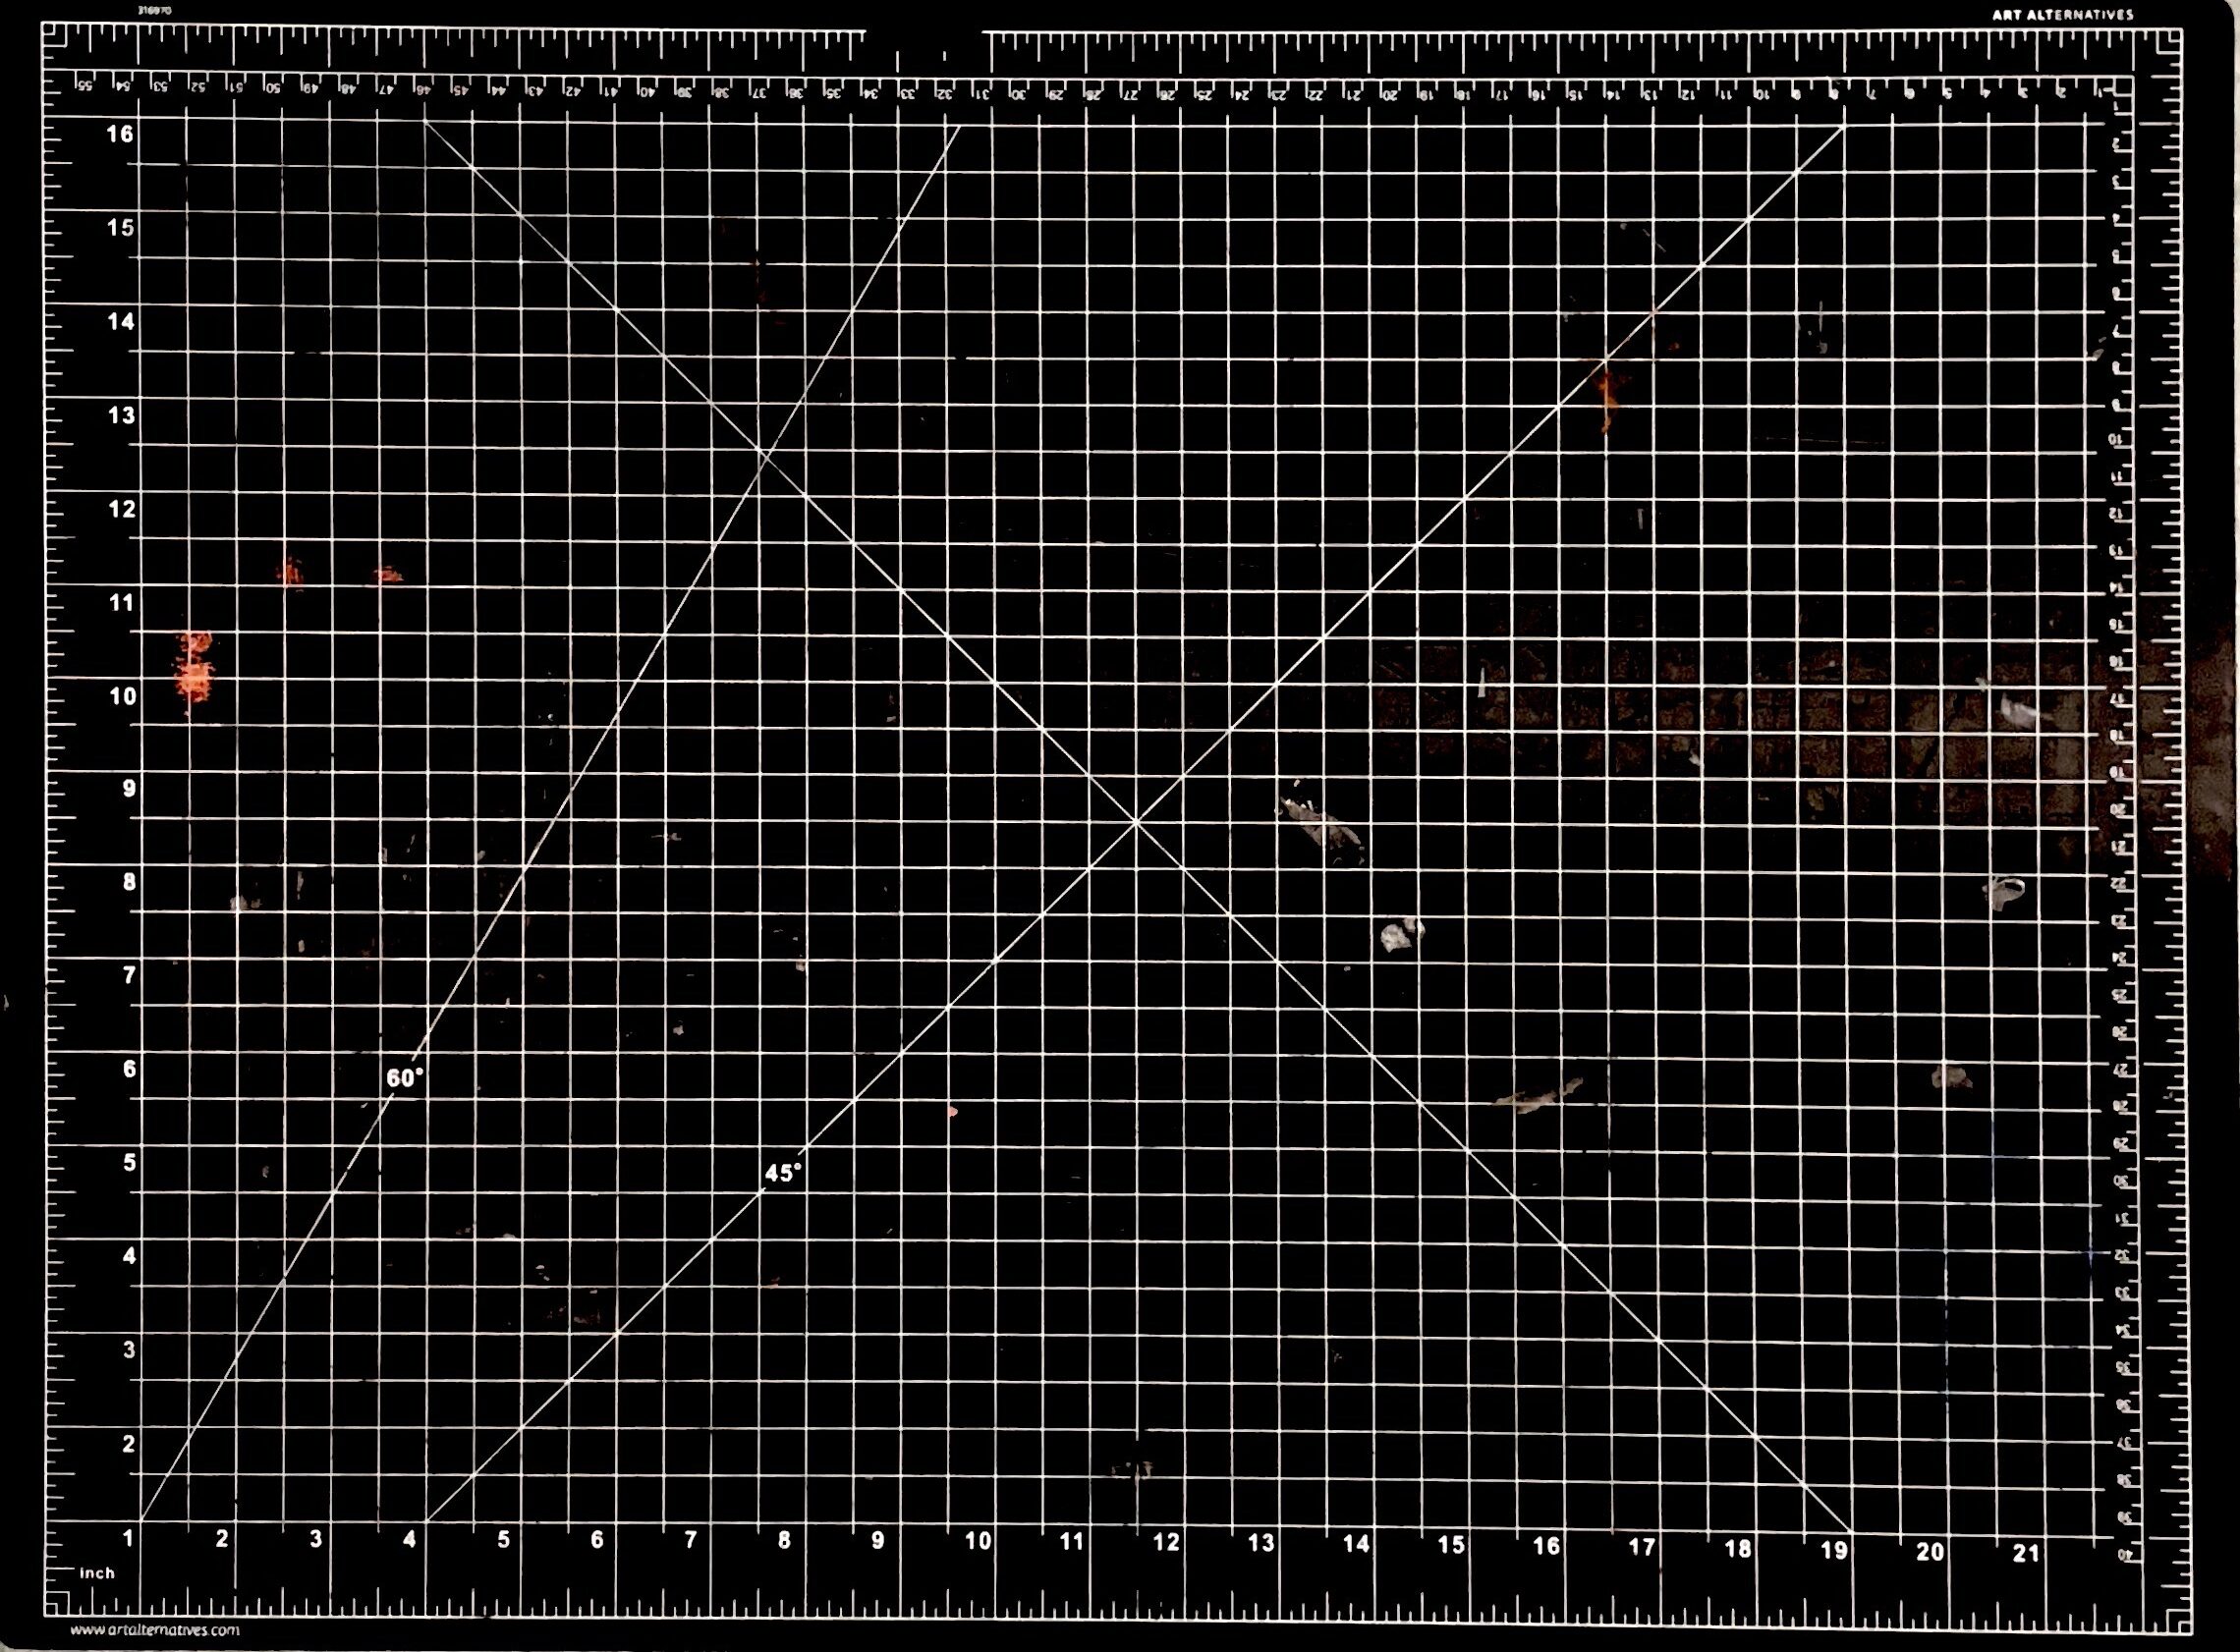
  • The color of the cutting board matters. Black cutting boards offer better contrast and separation between the surface damage and the mat. However, it is more vulnerable to light spots and the details of the cutting mat itself gets lost. This makes it difficult to get a clean image. Example:


Final Thoughts

Ultimately, I am satisfied with where my project went. It is very different from what I had been ideating for the past month, but this project sparked my curiosity more, and it was fun running around Purnell and CFA scanning people’s cutting mats and recognizing some of the projects that were worked on them.

However, I struggled to strike the exact balance I was looking for of both the cutting mat and the damage on top being equally visible due to the factors listed above.  If I pursue this more in the future, I would like to standardize my lighting in a studio setting. I feel that this will give me more flexibility and control with the different cutting mats. Further, I wondered if there was a process where I could use the Notes App feature but not the native iPhone camera so that I could capture it in an even higher resolution. Finally, I am pretty sure that there are more cutting boards than the ones I’ve scanned. If I were to broaden the scope of this project, I would see if I could befriend an architecture kid and go around their studio taking scans.
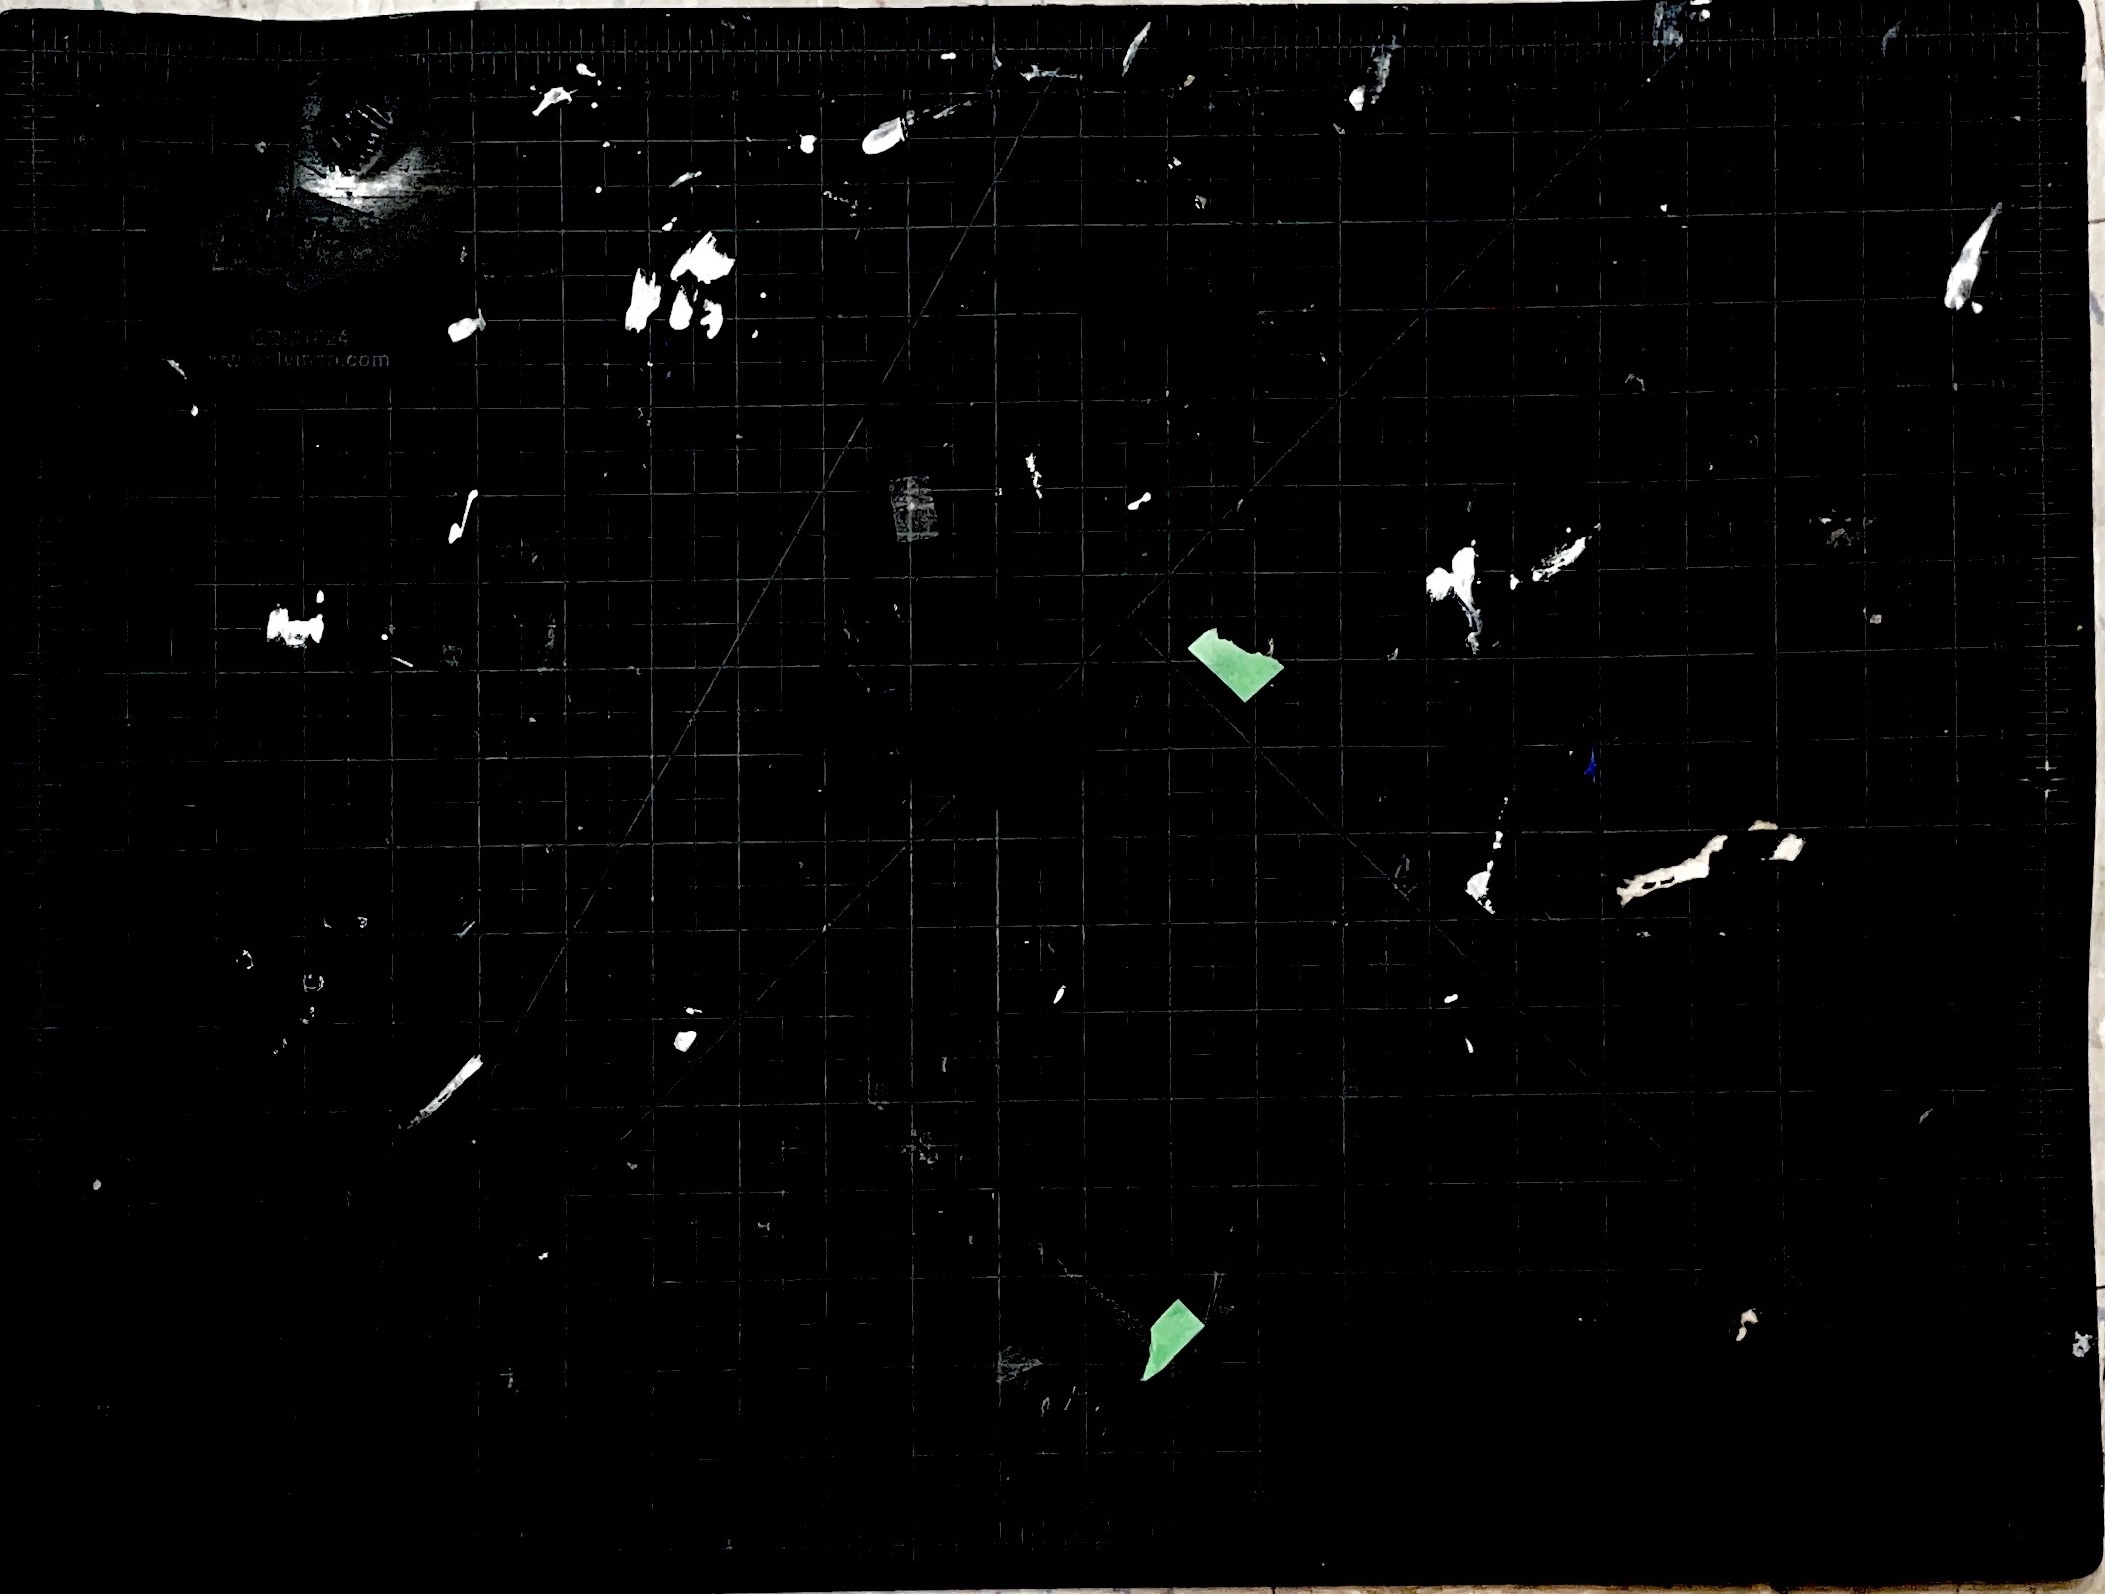
The Rest of It (or at least the ones worth seeing)

Typology: Pittsburgh Bridges

When is the last time you looked up while driving or walking underneath a bridge?

Through this project, I set out to document bridge damage in a way that is difficult to experience with the naked eye, or that we are likely to overlook or take for granted in our day to day life.

Inspiration and Background

At the beginning of this process, I was really inspired by the TRIP Report on Pennsylvania bridges, a comprehensive report that listed PA’s most at risk bridges and ranked them by order of priority. I was interested in drawing attention to the “underbelly,”  an area that’s often difficult to access, as a way to reveal an aspect of our daily life that tends to be unnoticed.

Initially, I was planning to use a thermal camera to identify damage that’s not visible to the naked eye. After meeting with two engineers from PennDOT, I learned that this method would not be effective in the way I intended, as it only works when taken from the surface of the bridge. It would have been unsafe for me to capture the surface, so I decided to recalibrate my project from capturing invisible damage, to emphasizing visible damage that would otherwise be unnoticed or hard to detect. Here are some examples of my attempts at thermal imaging on the bottom of the bridge. I was looking for heat anomalies, but as you can see the bridges I scanned were completely uniform, regardless of the bridge material or time of day.

Process and Methodology

After thermal imaging, I moved to LiDAR (depth) based 3D modeling. My research revealed this is the favored method for bridge inspectors, but the iPhone camera I was using had a pretty substantial depth limitation that prevented me from getting useful scans. Here are a few examples of my first round.
A LiDAR scan of Murray Avenue Bridge
Murray Avenue Bridge
Polish hill, Railroad Bridge over Liberty Avenue
376 over Swinburne Bridge

These scans were not great at documenting cracks and rust, which are the focus of my project. At Golan’s recommendation I made the switch to photogrammetry. For my workflow, I took 200-300 images of each bridge at all angles, which were then processed through Polycam After that, I uploaded each one to Sketchfab, due to the limitations of Polycam’s UI.

I chose photogrammetry because it allows the viewer to experience our bridges in a way that is not possible with the naked eye or even static photography. Through these 3D captures, it’s possible to see cracks and rust that are 20+ feet away in great detail.

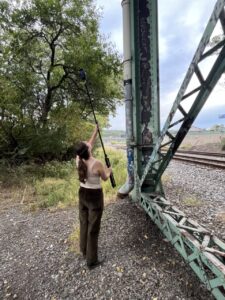
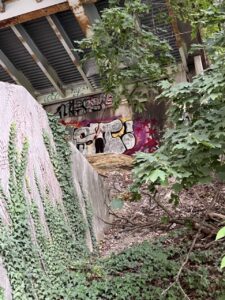
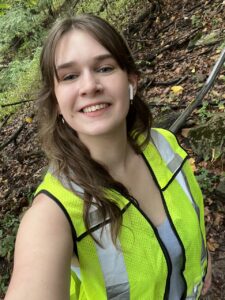
Here’s some pictures of me out capturing. A construction worker saw me near the road and came and gave me a high vis vest for my safety, which was so nice I want to give him a shoutout here!
Results

This project is designed to be interactive. If you’d like to explore on your own device, please go here if you’re viewing on a computer, and here for augmented reality (phone only). I’ve provided a static image of each scan in this post, as well as 5 augmented reality fly throughs, out of the 9 models I captured.
Railroad Bridge over Liberty Ave
Race St Bridge
Penn Ave Bridge
Panther Hollow Bridge
Greenfield Railroad Bridge
Swinburne Bridge
Frazier St Viaduct (376)
Allegheny River Bridge

I am quite pleased with the end result compared to where I started, but there’s still a lot of room for improvement in the quality of the scans. After so many iterations I was restricted by time, but in the future I would prefer to use more advanced modeling software. I would also like to explore hosting them on my own website.

Special thanks to PennDOT bridge engineers Shane Szalankiewicz and Keith Cornelius for their extraordinary assistance in the development of this project.