ClassifierDemo Arduino Sketch
N.B. this is new and still being tested.
This sketch demonstrates an example of ultrasonic range sensor data processing using a combination of signal filters and a classification tree. The classifier code was generated using the Python script classify_gen.py on recorded and labeled training data. The underlying classification tree was automatically generated using the Python scikit-learn library. For more details on the filtering, please see FilterDemos Arduino Sketch.
The purpose of the classifier is to categorize a multi-dimensional data point into an integer representing membership within a discrete set of classifications. In the sample model, the data is two-dimensional for clarity of plotting the result. The data points could be extended to higher dimensions by including multiple samples over time or other sensor channels.
There are a couple of steps to using this approach in your own system.
Decide how to create different physical conditions which produce meaningful categories of data.
Decide what combination of sensor inputs and processed signals might disambiguate the categories. This will constitute the definition of each data point.
Set up a sketch with the data sampling and filtering portion of your system as a means to recording real-world data. The example uses integer units for efficiency; you may wish to prescale your data for increased integer accuracy, or you may decide to enable float values.
If your system can support a few extra user inputs, the data collection process will be easier if the data can be labeled while it is being collected. E.g., adding a ‘Record’ button and some category buttons could support emitting labeled data directly from the Arduino. (This was not done in the sample code below).
Record data from the real system under the different conditions.
Trim the data as needed to remove spurious startup transients or other confounding inputs.
If needed, label each data sample and merge into a single training file. For an example, see label_and_merge.py.
Run classify_gen.py to process the training data file into code.
For 2-D data, inspect the plot output as a sanity check. You may wish to tune the modeling parameters or adjust your data set and regenerate the model.
Incorporate the final classifier code in your sketch.
Decide whether the classifier output needs additional processing, e.g. debouncing to remove spurious transients.
The sketch files may be downloaded in a single archive file as ClassifierDemo.zip, or browsed in raw form in the source folder. The individual files are documented below.
Sample Model
The sample model was built by recording filtered data generated by this sketch under four different physical conditions. The individual files were manually trimmed, then labeled and combined using label_and_merge.py.
This particular example is somewhat contrived, since a reasonable two-dimensional classifier could be built by hand after inspecting the data. But this can be significantly harder in higher dimensions, e.g., if each data point were extended to include a few samples of history.
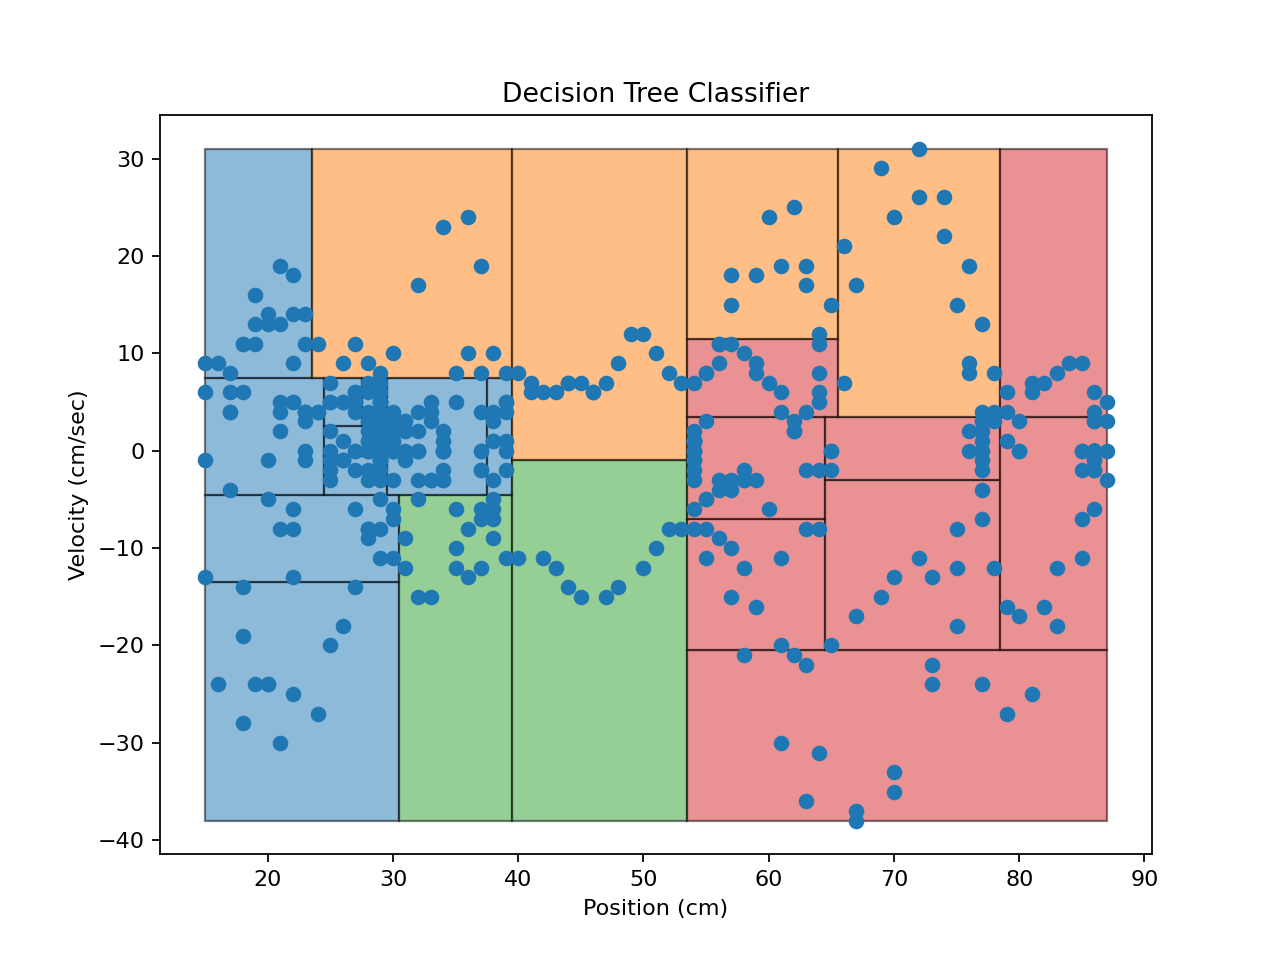
The binary classifier tree drawn over the training data. Each point represents one sample of position and velocity computed by the smoothing and fitting filters. Each color represents a labeled class: blue for ‘near’, red for ‘far’, orange for ‘receding’, green for ‘approaching’. The black lines represent the binary splitting lines subdividing sample regions; each splitting line corresponds to a if/else block in the classifier code.
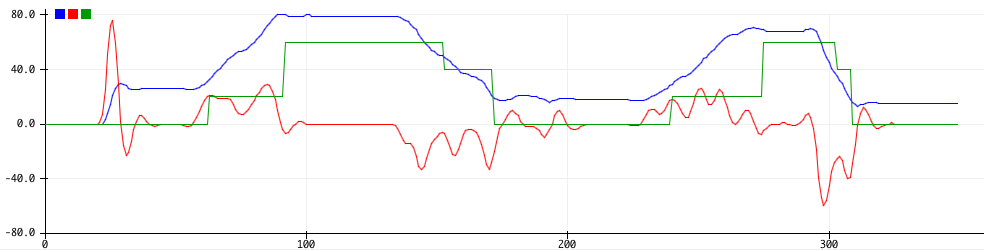
Live test of the classifier. The blue line represents the filtered position estimate, the red line is velocity, and the green line the debounced output of the classifier. The following state sequence is observed twice: near, receding, far, approaching. The plot was captured from the Arduino IDE Serial Plotter.
Related files:
Main Sketch
The main sketch file is ClassifierDemo.ino. It includes an event loop to sample a sonar range finder sensor, filter and fit the range signal to estimate position and velocity, then classify the state. The output is printed in a form suitable for real-time plotting using the IDE Serial Plotter.
1 2 3 4 5 6 7 8 9 10 11 12 13 14 15 16 17 18 19 20 21 22 23 24 25 26 27 28 29 30 31 32 33 34 35 36 37 38 39 40 41 42 43 44 45 46 47 48 49 50 51 52 53 54 55 56 57 58 59 60 61 62 63 64 65 66 67 68 69 70 71 72 73 74 75 76 77 78 79 80 81 82 83 | // ClassifierDemo.ino : Arduino program to demonstrate application of a decision tree.
// No copyright, 2020, Garth Zeglin. This file is explicitly placed in the public domain.
// The decision tree function and is kept in a separate .ino files which will
// automatically be compiled with this one by the Arduino IDE. The tree code
// was generated from data using classify_gen.py.
// The baud rate is the number of bits per second transmitted over the serial port.
const long BAUD_RATE = 115200;
//================================================================
// Hardware definitions. You will need to customize this for your specific hardware.
const int sonarTriggerPin = 7; // Specify a pin for a sonar trigger output.
const int sonarEchoPin = 8; // Specify a pin for a sonar echo input.
//================================================================
// Standard Arduino initialization function to configure the system.
void setup()
{
// initialize the Serial port
Serial.begin( BAUD_RATE );
// Initialize the digital input/output pins.
pinMode(sonarTriggerPin, OUTPUT);
pinMode(sonarEchoPin, INPUT);
}
//================================================================
// Standard Arduino polling function. This function is called repeatedly to
// handle all I/O and periodic processing. This loop should never be allowed to
// stall or block so that all tasks can be constantly serviced.
void loop()
{
// Calculate the interval in microseconds since the last polling cycle.
static unsigned long last_time = 0;
unsigned long now = micros();
unsigned long interval = now - last_time;
last_time = now;
// Poll the sonar at regular intervals.
static long sonar_timer = 0;
sonar_timer -= interval;
if (sonar_timer < 0) {
sonar_timer += 100000; // 10 Hz sampling rate
// read the sonar; zeros represent a no-ping condition
int raw_ping = ping_sonar();
// suppress zeros in the input, just repeating the last input
int nz_ping = suppress_value(raw_ping, 0);
// convert the value from microseconds to centimeters
float cm = fmap(nz_ping, 0.0, 5900.0, 0.0, 100.0);
// apply a low-pass filter to smooth the raw data
cm = lowpass(cm);
// fit a trajectory curve to recent sample history
float traj[3];
trajfit(cm, traj);
// quantize and classify the current estimation
int posvel[2];
posvel[0] = (int) traj[0];
posvel[1] = (int) traj[1];
int cls = classify(posvel);
// debounce the classification to eliminate transient changes
cls = debounce(cls, 5);
// emit some data to plot
// Serial.print(raw_ping); Serial.print(" "); // ping time in microseconds
// Serial.print(cm); Serial.print(" "); // centimeter-scaled, zero-suppressed
// Serial.print(traj[0]); Serial.print(" "); // quadratic position
// Serial.print(traj[1]); Serial.print(" "); // quadratic velocity
Serial.print(posvel[0]); Serial.print(","); // integer position for classification
Serial.print(posvel[1]); Serial.print(" "); // integer velocity for classification
Serial.print(20*cls); Serial.print(" "); // integer sample classification, amplified for live plotting
Serial.println();
}
}
|
classify.ino
1 2 3 4 5 6 7 8 9 10 11 12 13 14 15 16 17 18 19 20 21 22 23 24 25 26 27 28 29 30 31 32 33 34 35 36 37 38 39 40 41 42 43 44 45 46 47 48 49 50 51 52 53 54 55 56 57 58 59 60 61 62 63 64 65 66 67 68 69 70 71 72 73 74 75 76 77 78 79 80 81 82 83 84 85 86 87 88 89 90 91 92 93 94 95 96 97 | // Decision tree classifier generated using classify_gen.py
int classify(int input[2])
{
if (input[0] <= 53) {
if (input[0] <= 39) {
if (input[1] <= 7) {
if (input[1] <= -4) {
if (input[0] <= 30) {
if (input[1] <= -13) {
return 0;
} else {
return 0;
}
} else {
return 2;
}
} else {
if (input[0] <= 29) {
if (input[0] <= 24) {
return 0;
} else {
if (input[1] <= 2) {
if (input[1] <= 0) {
return 0;
} else {
return 0;
}
} else {
if (input[0] <= 27) {
return 0;
} else {
return 0;
}
}
}
} else {
if (input[0] <= 37) {
return 0;
} else {
return 0;
}
}
}
} else {
if (input[0] <= 23) {
return 0;
} else {
return 1;
}
}
} else {
if (input[1] <= -1) {
return 2;
} else {
return 1;
}
}
} else {
if (input[1] <= 3) {
if (input[1] <= -20) {
return 3;
} else {
if (input[0] <= 78) {
if (input[0] <= 64) {
if (input[1] <= -7) {
return 3;
} else {
return 3;
}
} else {
if (input[1] <= -3) {
return 3;
} else {
return 3;
}
}
} else {
return 3;
}
}
} else {
if (input[0] <= 78) {
if (input[0] <= 65) {
if (input[1] <= 11) {
return 3;
} else {
return 1;
}
} else {
return 1;
}
} else {
return 3;
}
}
}
}
|
filters.ino
1 2 3 4 5 6 7 8 9 10 11 12 13 14 15 16 17 18 19 20 21 22 23 24 25 26 27 28 29 30 31 32 33 34 35 36 37 38 39 40 41 42 43 44 45 46 47 48 49 50 51 52 53 54 55 56 57 58 59 60 61 62 63 64 65 66 67 68 69 70 71 72 73 74 75 76 77 78 79 80 81 82 83 84 85 86 87 88 89 90 91 92 93 94 95 96 97 98 99 100 101 102 103 104 105 106 107 108 109 110 111 112 113 114 115 116 117 118 119 120 121 122 | // filters.ino : filtering primitives used by the ClassifierDemo sketch.
// No copyright, 2020, Garth Zeglin. This file is explicitly placed in the public domain.
//================================================================
// Suppress a specific value in an input stream. One integer of state is required.
int suppress_value(int input, int value)
{
static int previous = 0;
if (input != value) previous = input;
return previous;
}
//================================================================
// Debounce an integer stream by suppressing changes from the previous value
// until a specific new value has been observed a minimum number of times. Three
// integers of state are required.
int debounce(int input, int samples)
{
static int current_value = 0;
static int new_value = 0;
static int count = 0;
if (input == current_value) {
count = 0;
} else {
if (count == 0) {
new_value = input;
count = 1;
} else {
if (input == new_value) {
count += 1;
if (count >= samples) {
current_value = new_value;
count = 0;
}
} else {
new_value = input;
count = 1;
}
}
}
return current_value;
}
//================================================================
// Floating-point version of map(). The standard Arduino map() function only
// operates using integers; this extends the idea to floating point. The
// Arduino function can be found in the WMath.cpp file within the Arduino IDE
// distribution. Note that constrain() is defined as a preprocessor macro and
// so doesn't have data type limitations.
float fmap(float x, float in_min, float in_max, float out_min, float out_max) {
float divisor = in_max - in_min;
if (divisor == 0.0) {
return out_min;
} else {
return (x - in_min) * (out_max - out_min) / divisor + out_min;
}
}
//================================================================
// Low-Pass Butterworth IIR digital filter, generated using filter_gen.py.
// Sampling rate: 10 Hz, frequency: 1.0 Hz.
// Filter is order 4, implemented as second-order sections (biquads).
// Reference: https://docs.scipy.org/doc/scipy/reference/generated/scipy.signal.butter.html
float lowpass(float input)
{
float output = input;
{
static float z1, z2; // filter section state
float x = output - -1.04859958*z1 - 0.29614036*z2;
output = 0.00482434*x + 0.00964869*z1 + 0.00482434*z2;
z2 = z1;
z1 = x;
}
{
static float z1, z2; // filter section state
float x = output - -1.32091343*z1 - 0.63273879*z2;
output = 1.00000000*x + 2.00000000*z1 + 1.00000000*z2;
z2 = z1;
z1 = x;
}
return output;
}
//================================================================
// Trajectory estimation filter generated using trajfit_gen.py.
// Based on Savitzky-Golay polynomial fitting filters.
// Sampling rate: 10 Hz.
// The output array will contain the trajectory parameters representing the signal
// at the current time: [position, velocity, acceleration], with units of [1, 1/sec, 1/sec/sec].
// Reference: https://docs.scipy.org/doc/scipy/reference/generated/scipy.signal.savgol_coeffs.html
void trajfit(float input, float output[3])
{
const float coeff[3][5] =
{{ 0.085714, -0.142857, -0.085714, 0.257143,
0.885714},
{ 3.714286, -3.857143, -5.714286, -1.857143,
7.714286},
{ 28.571429, -14.285714, -28.571429, -14.285714,
28.571429}};
static float ring[5]; // buffer for recent time history
static unsigned oldest = 0; // index of oldest sample
// save the new sample by overwriting the oldest sample
ring[oldest] = input;
if (++oldest >= 5) oldest = 0;
// iterate over the coefficient rows
unsigned index = oldest;
for (int i = 0; i < 3; i++) {
output[i] = 0.0; // clear accumulator
// Iterate over the samples and the coefficient rows. The index cycles
// around the circular buffer once per row.
for (int j = 0; j < 5; j++) {
output[i] += coeff[i][j] * ring[index];
if (++index >= 5) index = 0;
}
}
}
//================================================================
|
sonar.ino
1 2 3 4 5 6 7 8 9 10 11 12 13 14 15 16 17 18 19 20 21 22 23 | // sonar.ino: operate a HC04 ultrasonic range sensor
// No copyright, 2020, Garth Zeglin. This file is explicitly placed in the public domain.
// Run a measurement cycle on the sonar range sensor. Returns the round-trip
// time in microseconds. Returns zero if no ping is detected. This code
// assumes the pin constants are defined in another file.
int ping_sonar(void)
{
// Generate a short trigger pulse.
digitalWrite(sonarTriggerPin, HIGH);
delayMicroseconds(10);
digitalWrite(sonarTriggerPin, LOW);
// Measure the echo pulse length. The ~6 ms timeout is chosen for a maximum
// range of 100 cm assuming sound travels at 340 meters/sec. With a round
// trip of 2 meters distance, the maximum ping time is 2/340 = 0.0059
// seconds. You may wish to customize this for your particular hardware.
const unsigned long TIMEOUT = 5900;
unsigned long ping_time = pulseIn(sonarEchoPin, HIGH, TIMEOUT);
return ping_time;
}
//================================================================
|
Development Tools
The development of this sketch involves several other tools which are not documented:
A Python script for generating a classifier using scikit-learn: classify_gen.py
A customizable Python script for capturing a serial data stream: record_Arduino_data.py
A customizable Python script for merging and labeling data files: label_and_merge.py
A set of recorded training data files: data/
The Python scripts use several third-party libraries:
SciPy: comprehensive numerical analysis library
scikit-learn: machine learning library built on top of SciPy
Matplotlib: plotting library for visualizing data
pySerial: portable support for the serial port used for Arduino communication