// Jiyeon Chun
// Section C
// jiyeonch@andrew.cmu.edu
// Project-07-Project
var nPoints = 100;
function setup() {
createCanvas(400, 400);
background(242, 140, 86);
frameRate(20);
}
function draw() {
push();
//make origin the center of canvas
translate(width/2, height/2);
drawEpicycloidCurve();
pop();
}
function drawEpicycloidCurve() {
//Epicycloid:
//https://mathworld.wolfram.com/Epicycloid.html
var x;
var y;
var a = mouseX / 5;
var b = a / int(mouseY / 25);
stroke(255);
strokeWeight(.5);
noFill();
beginShape();
for (var i=0; i<nPoints; i++) {
var t = map(i, 0, nPoints, 0, TWO_PI);
x = (a+b)*cos(t)-b*cos(((a+b)/b)*t);
y = (a+b)*sin(t)-b*sin(((a+b)/b)*t);
vertex(x,y);
}
endShape(CLOSE);
}
function mousePressed() { //press mouse to clear canvas and restart
background(242, 140, 86);
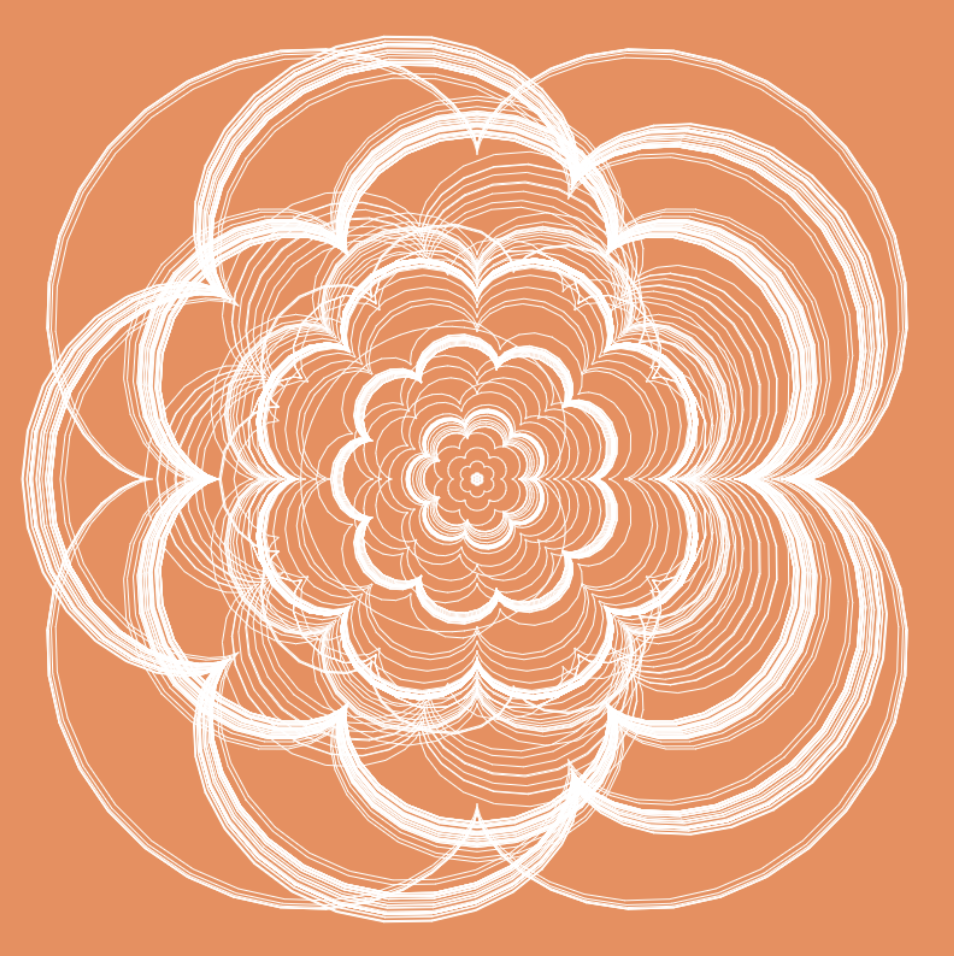
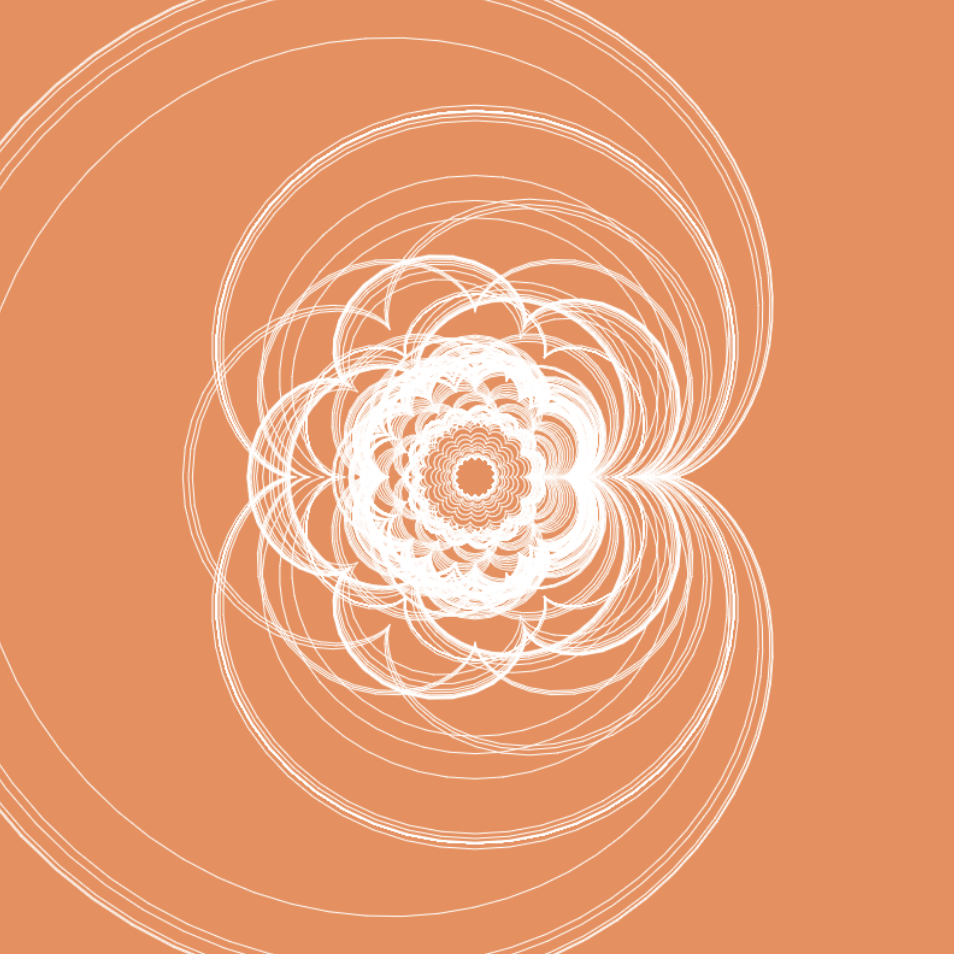
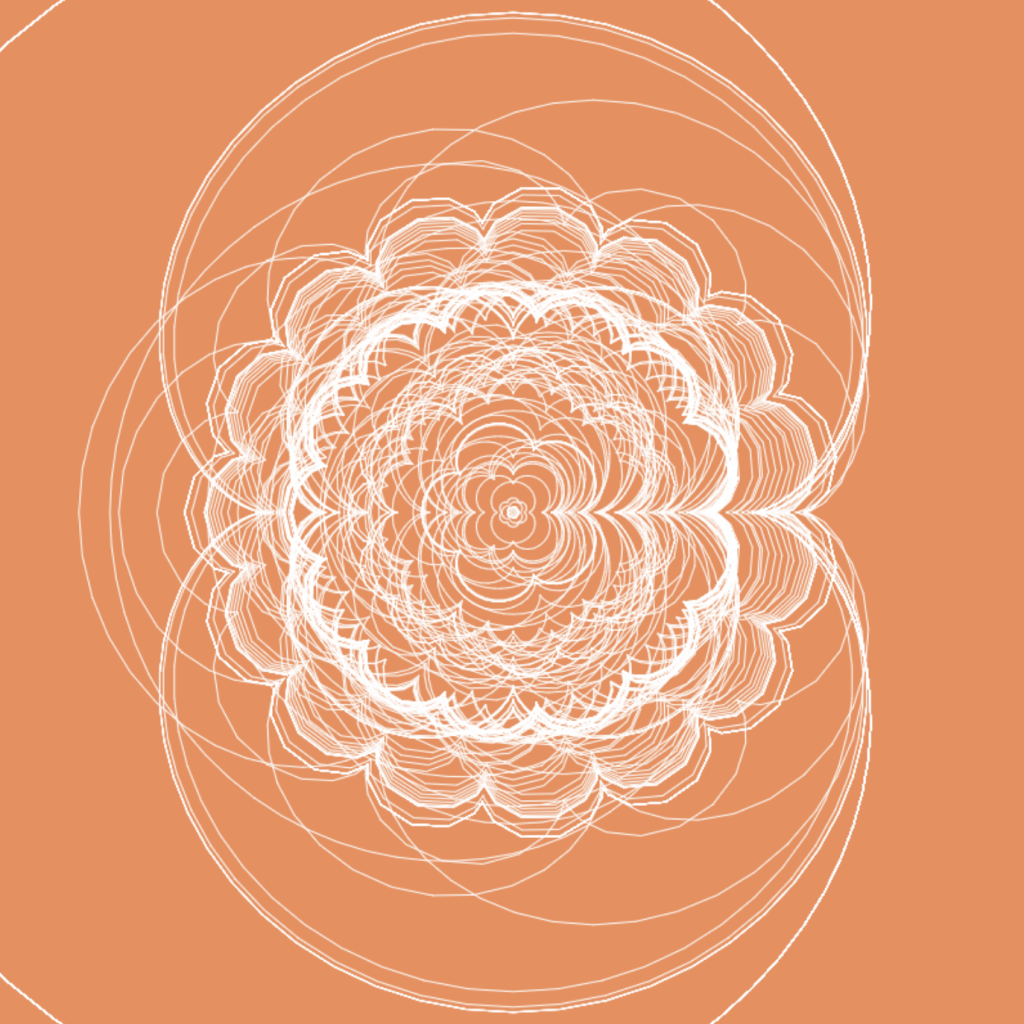
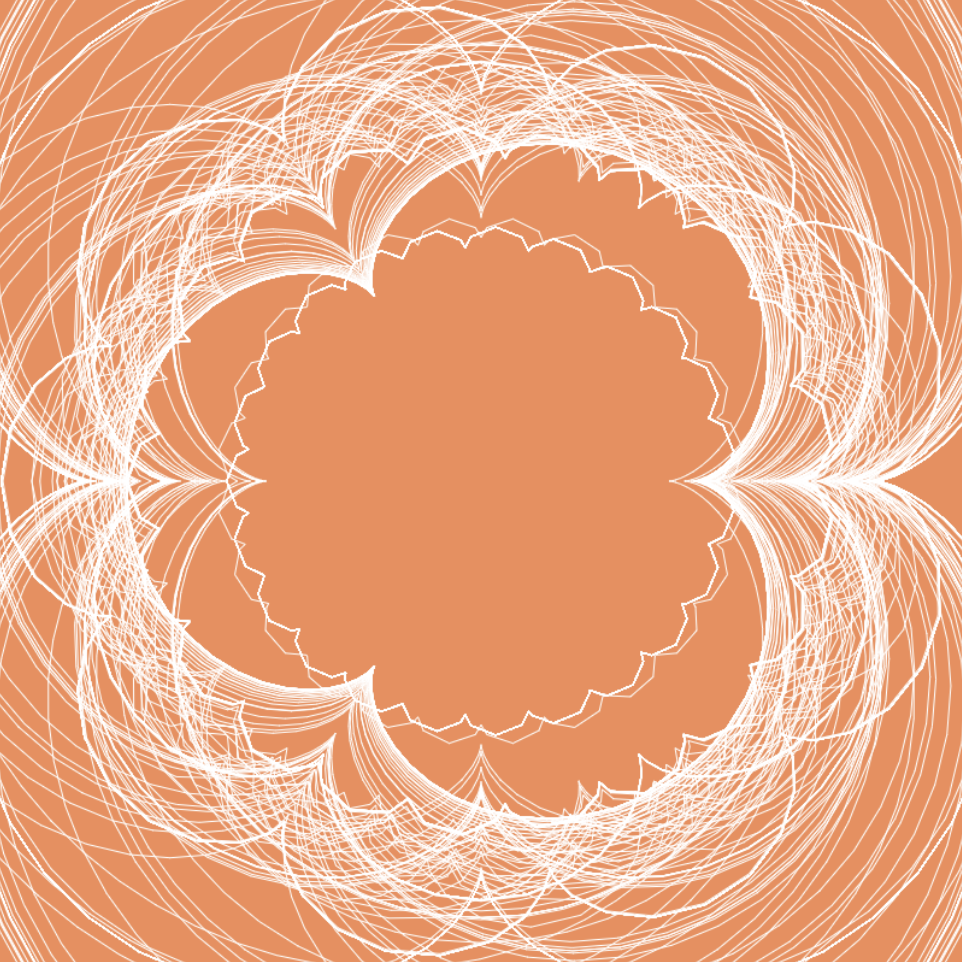
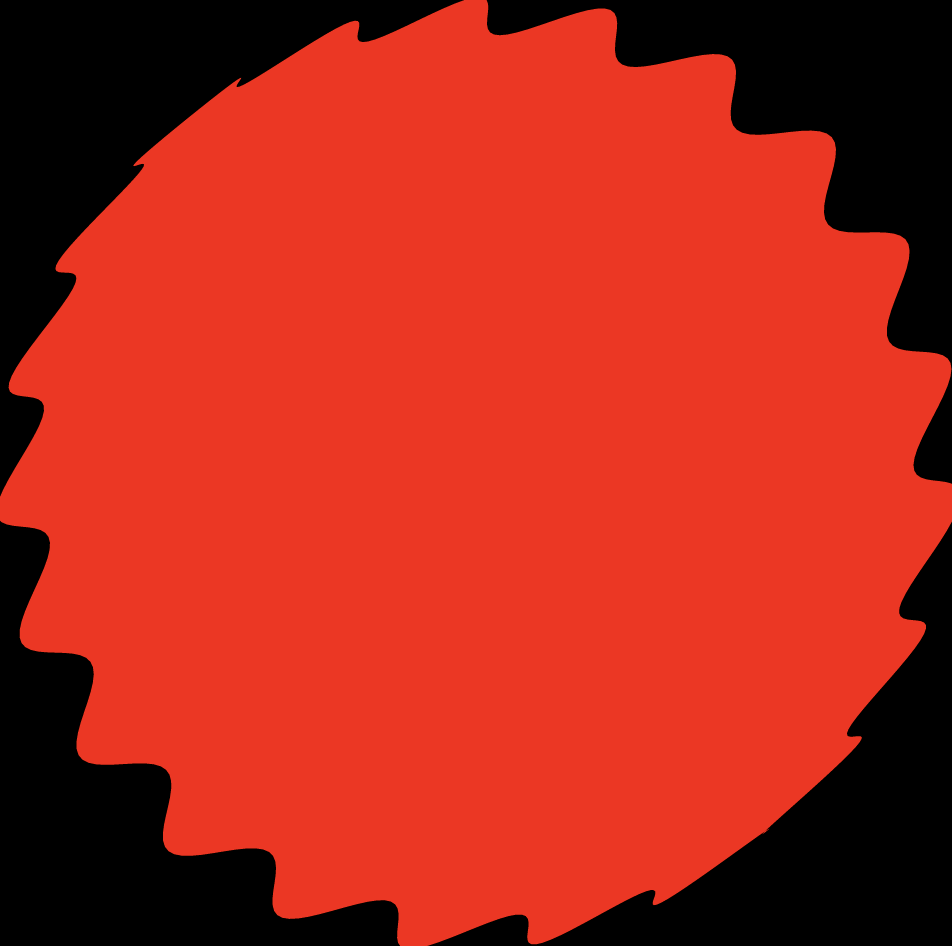
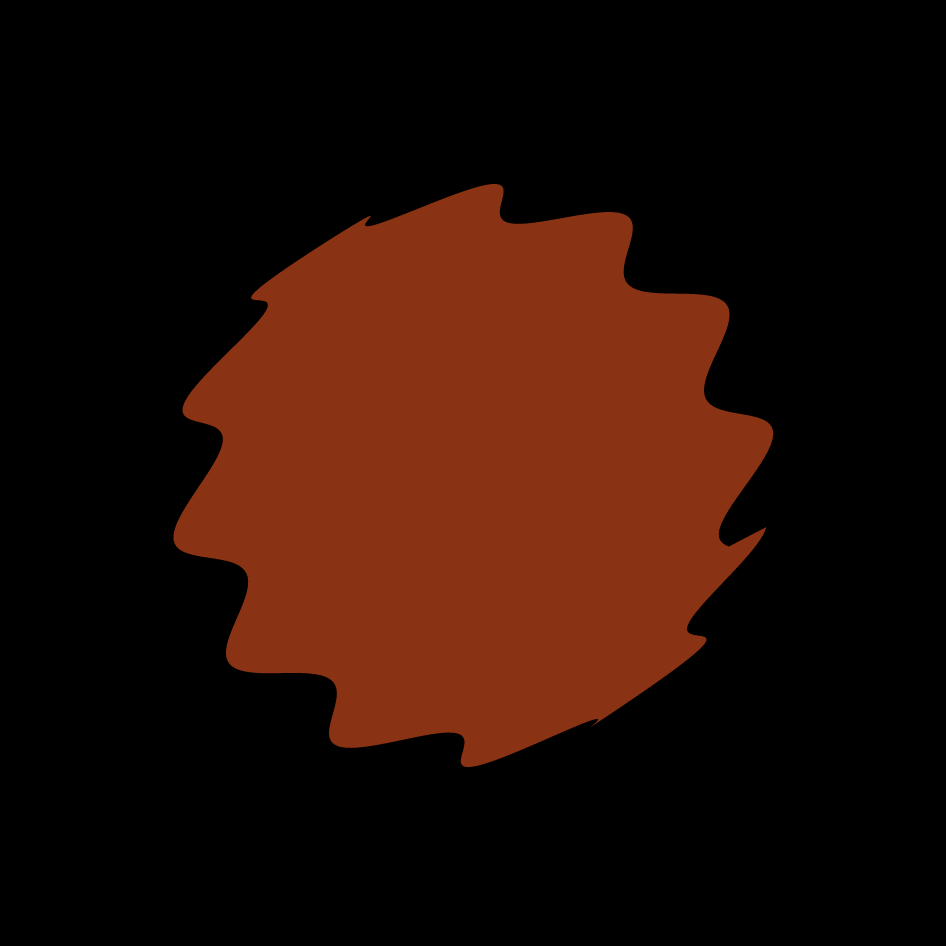
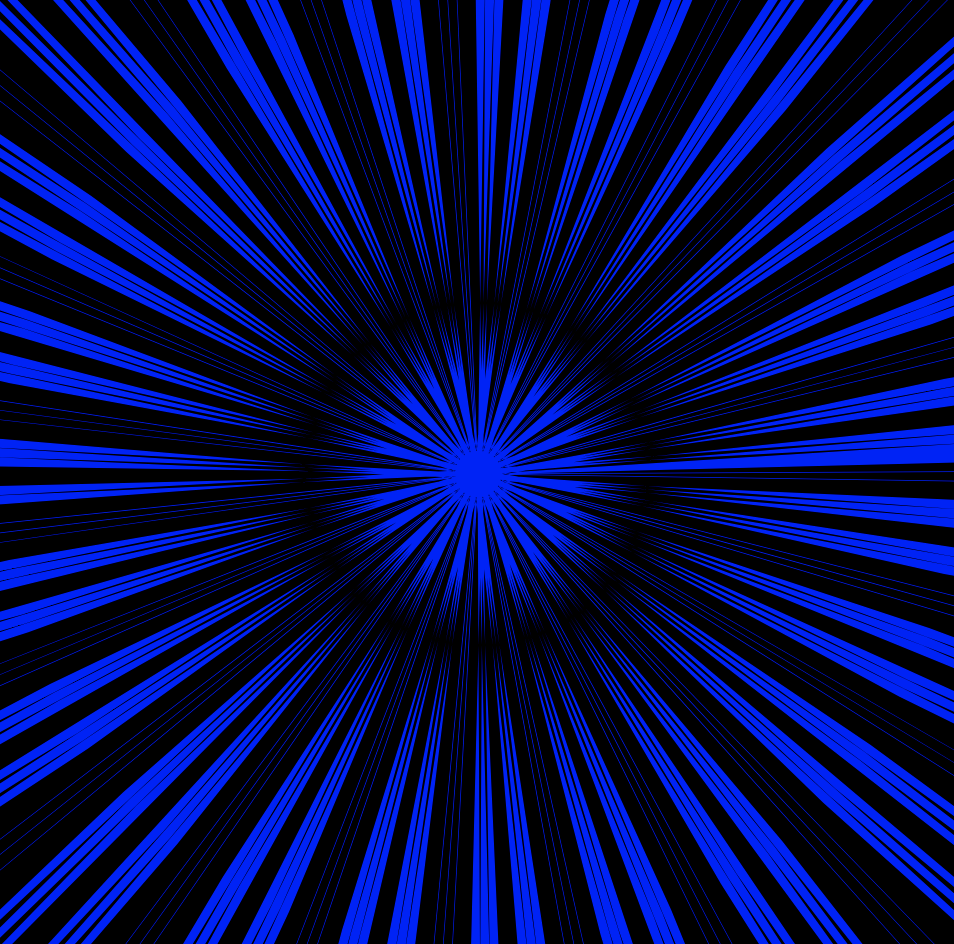
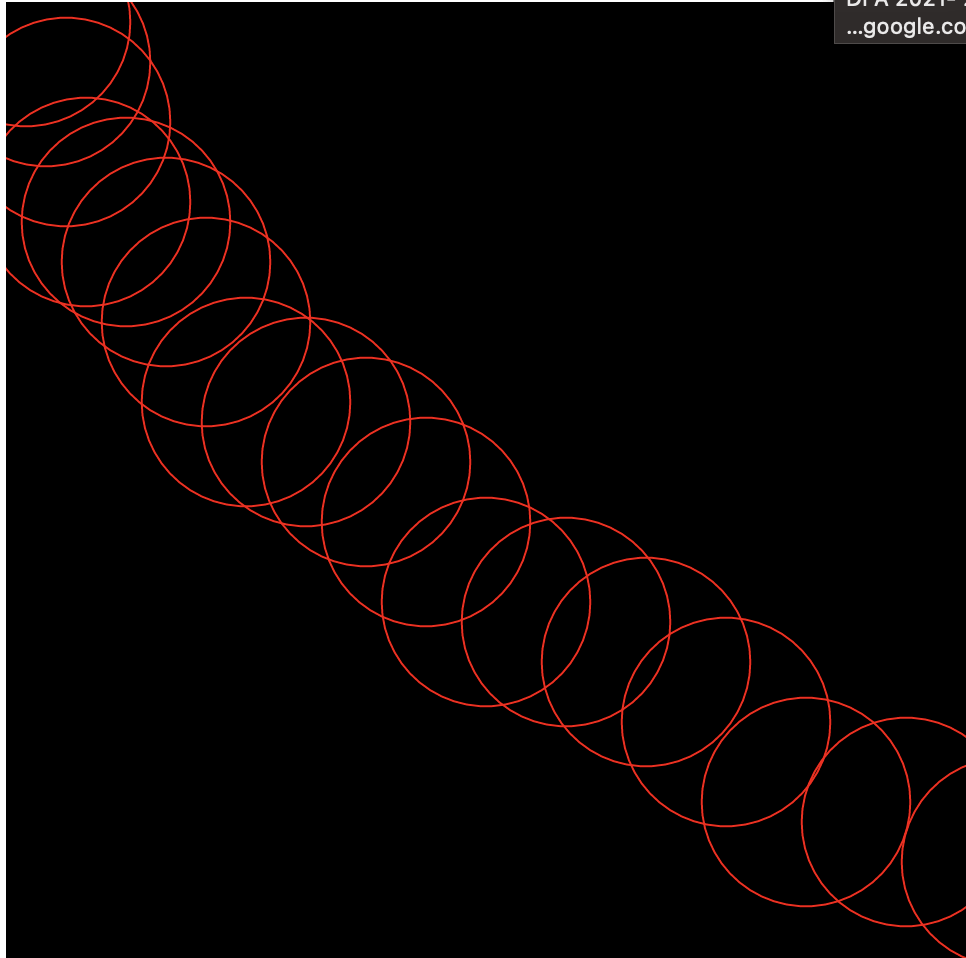
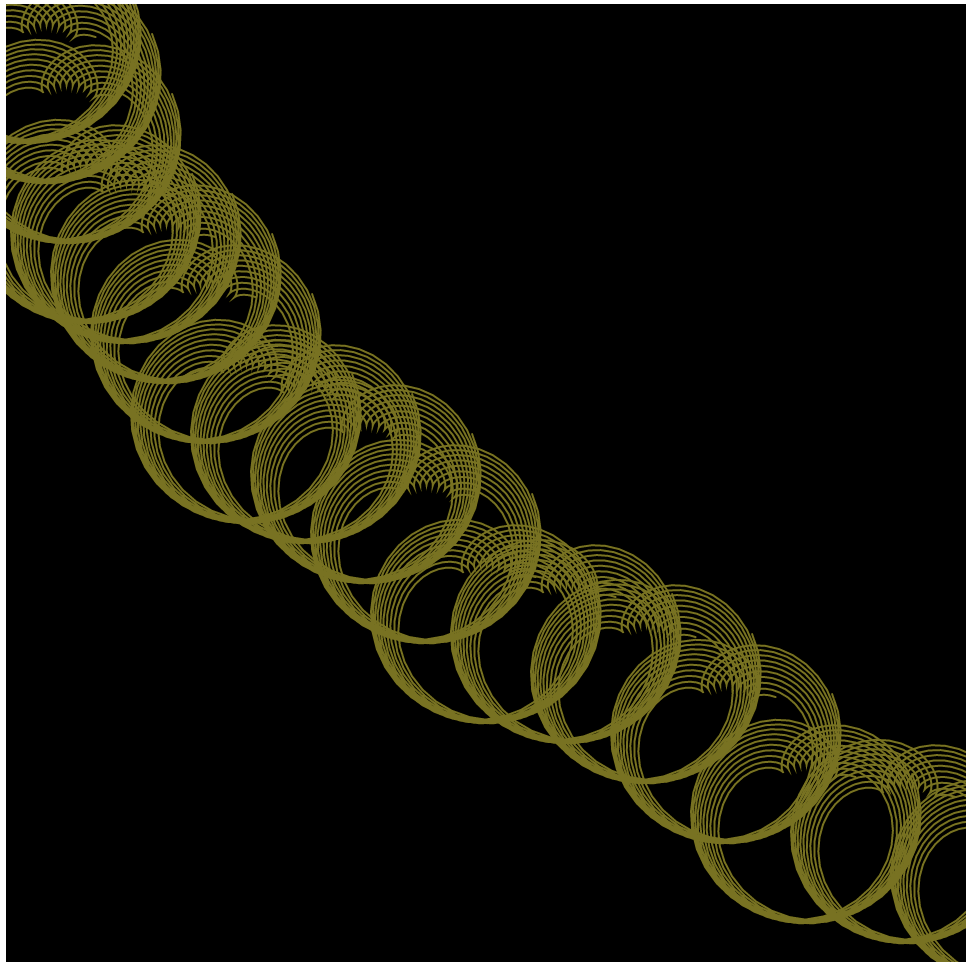
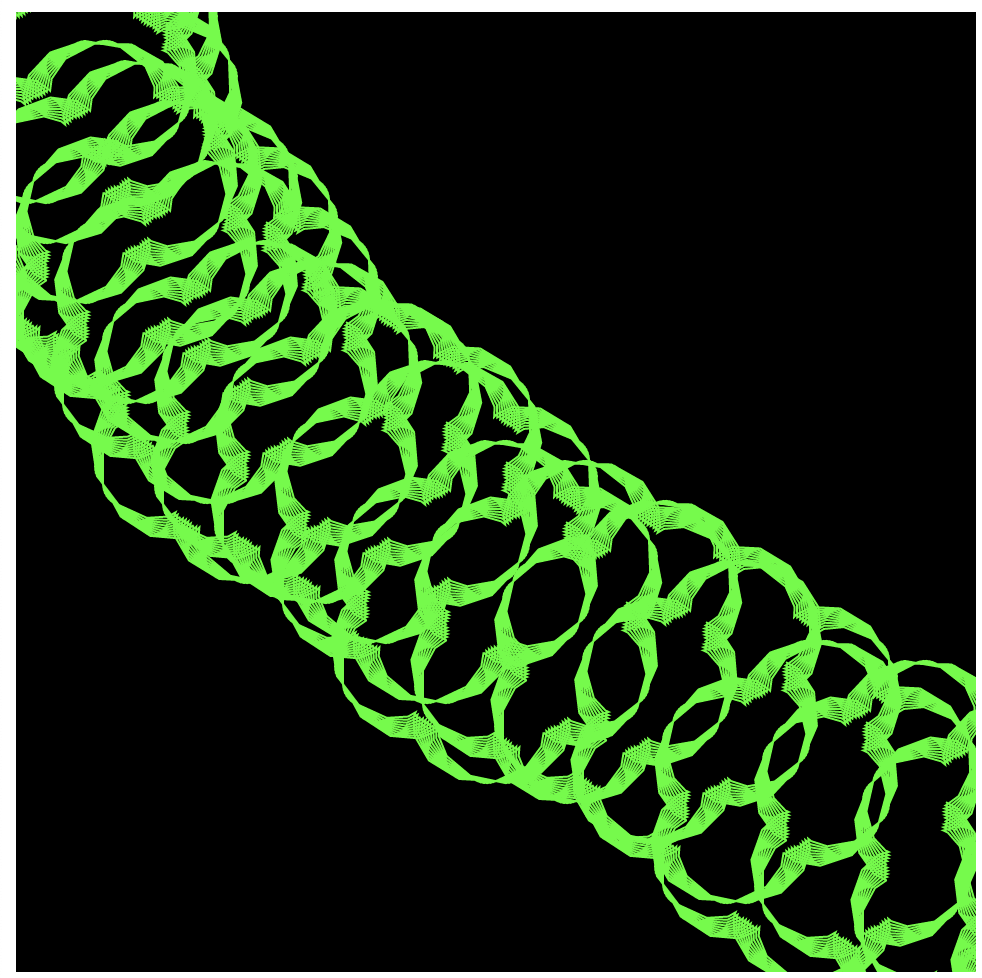
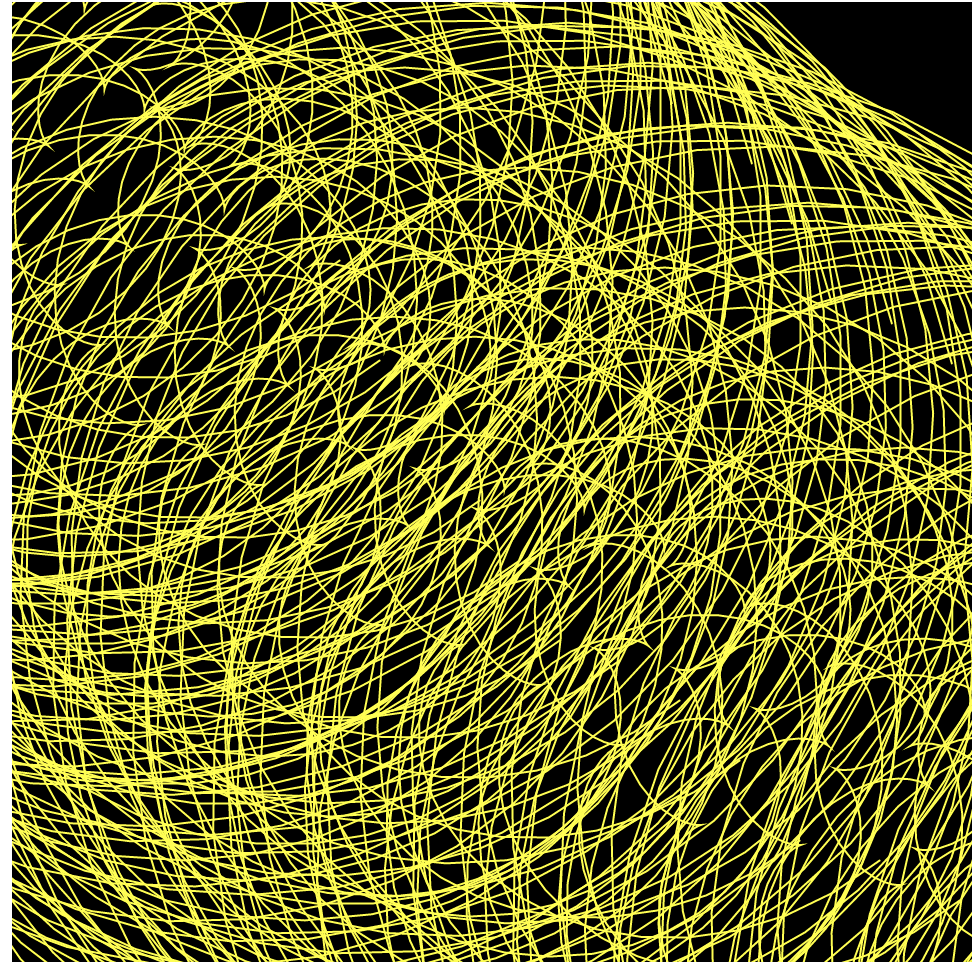
}My project is a program that allows the user to build up a composition using their interaction with the epicycloid curve with their mouse movements. I started off with other curves at first, however, some of the others didn’t offer as many change-able variables, as I wanted the program to be very dynamic upon the movement of the mouse. After putting the curve into my program, I took away the background from the draw function so that the canvas could keep a “history” of the mouse movement every frame, creating a composition over time in which the canvas has responded to the user’s mouse movements and the user to the canvas’ current composition! Here are just a few of the infinite amount of possible compositions:
// John Henley; jhenley; 15-104 section D
function setup() {
createCanvas(480, 480);
background(0);
}
function draw() { // draw loop for each spiral
background(0);
translate(width/2, height/2);
spiral1(); // calls spiral functions
spiral2();
}
function spiral1() { // horizontal spirals
beginShape();
noFill();
stroke(255);
for (var t = 0; t <= 100; t += 20) { // for loop for inner rings
for (var i = 1; i <= 100; i ++) { // loop for each spiral
var theta = map(i, 0, 100, 0, TWO_PI);
var a = map(mouseX, 0, width/2, 0, 1); // maps mouseX onto 0 - 1 scale
var x = a * t * cos(theta)^20;
var y = a * t * sin(theta);
vertex(x, y);
endShape();
}
}
}
function spiral2() { // vertical spiral
beginShape();
noFill();
stroke(255);
for (var t = 0; t <= 100; t += 20) { // for loop for inner rings
for (var i = 1; i <= 100; i ++) { // loop for each sprial
var theta = map(i, 0, 100, 0, TWO_PI);
var a = map(mouseX, 0, width/2, 0, 1); // maps mouseX onto 0 - 1 scale
var x = a * t * cos(theta);
var y = a * t * sin(theta)^20;
vertex(x, y);
endShape();
}
}
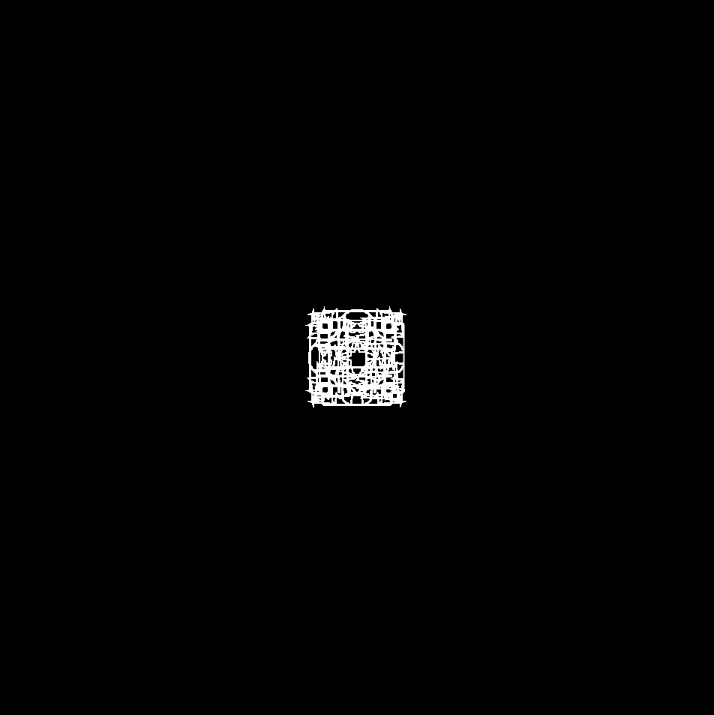
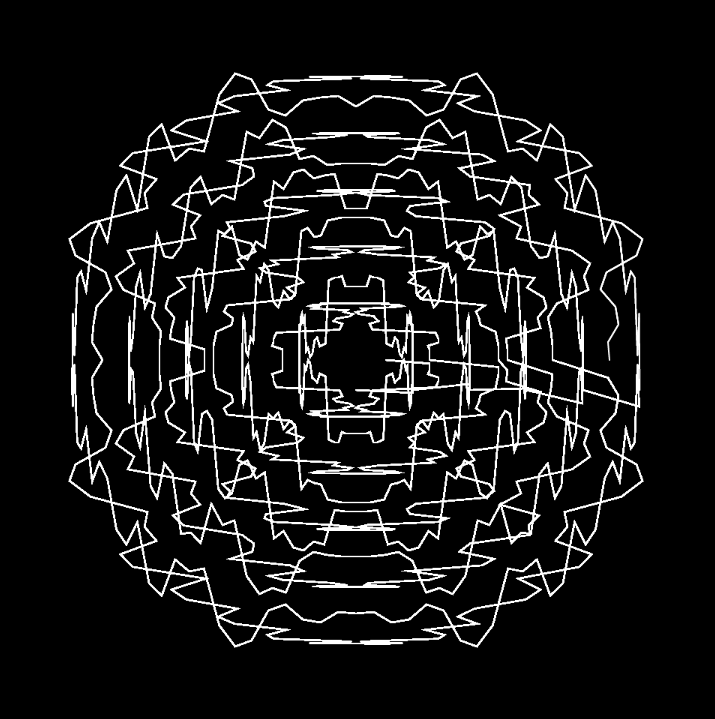
}I wanted to make my curves very sharp and dramatic rather than the traditional smooth spiral. I accomplished this by using the equation for a spiral (r*cos(theta)^x, parametrically) and adjusted the exponent value and values in the map function until I achieved the desire effect. Below are two separate states of the program: the first is when the mouse is far to the left of the canvas, and the second is when the mouse is far to the right.
//Jacky Lococo
//jlococo
//Section C
var nPoints = 50; // points on the epispiral and ranunculoid
function setup() {
    createCanvas(480, 480);
}

function draw() {
    background(255);
    push()
    translate(width/2, height/2)
    rotate(mouseX/2, mouseY/2)
    epispiralOne() //espiral - will repeat this shape to make more spiral lines
    epispiralOne()
    rotate(mouseX/4, mouseY/2)
    epispiralOne()
    ranunculoid() //flower curve -- will repeat to create spirals
    rotate(mouseX, mouseY)
    scale(2.0)
    ranunculoid() //flower curve scaled by factor of 2
    ranunculoid()
    scale(0.5)
    ranunculoid()
    pop()

    push()
    scale(2.0) //scaled up flower in top left corner
    ranunculoid()
    pop()
    ranunculoid() // flower in top left corner

    push()
    translate(width, height)
    ranunculoid()// flower in bottom right corner
    scale(2.0)//scaled up flower in right corner
    ranunculoid()
    pop()

    ellipse(width/2, height/2, mouseY/30, mouseY/30 ) //creates scaling ellipse


}

function epispiralOne(){ //episprial with two curves
    var a = 40
    var b = a / 2.0;
    var h = mouseX
    var ph = mouseX / 50.0
    noFill()
    strokeWeight(2)
    stroke(0, 100, mouseY)
    beginShape();
    for (var i = 0; i < nPoints; i++) {
        var t = map(i, 0, nPoints, 0, TWO_PI);
        x = (a + b) * cos(t) - h * cos(ph + t * (a + b) / b); //formulas
        y = (a + b) * sin(t) - h * sin(ph + t * (a + b) / b);
        vertex(x,y)
    }
    endShape()

}

function ranunculoid(){ // type of Epicycloid with four petals
    var a = mouseY / 30 // changes the size of the shape
    noFill()
    stroke(mouseX, 0, 100) // changes just the red value
    strokeWeight(1)
    beginShape();
    for (var i = 0; i < nPoints; i++) {
        var t = map(i, 0, nPoints, 0, TWO_PI);
        x = a*(6 * cos(t) - cos(6*t)); //formulas
        y = a*(6 * sin(t) - sin(6*t));
        vertex(x,y)
    }
    endShape()

}
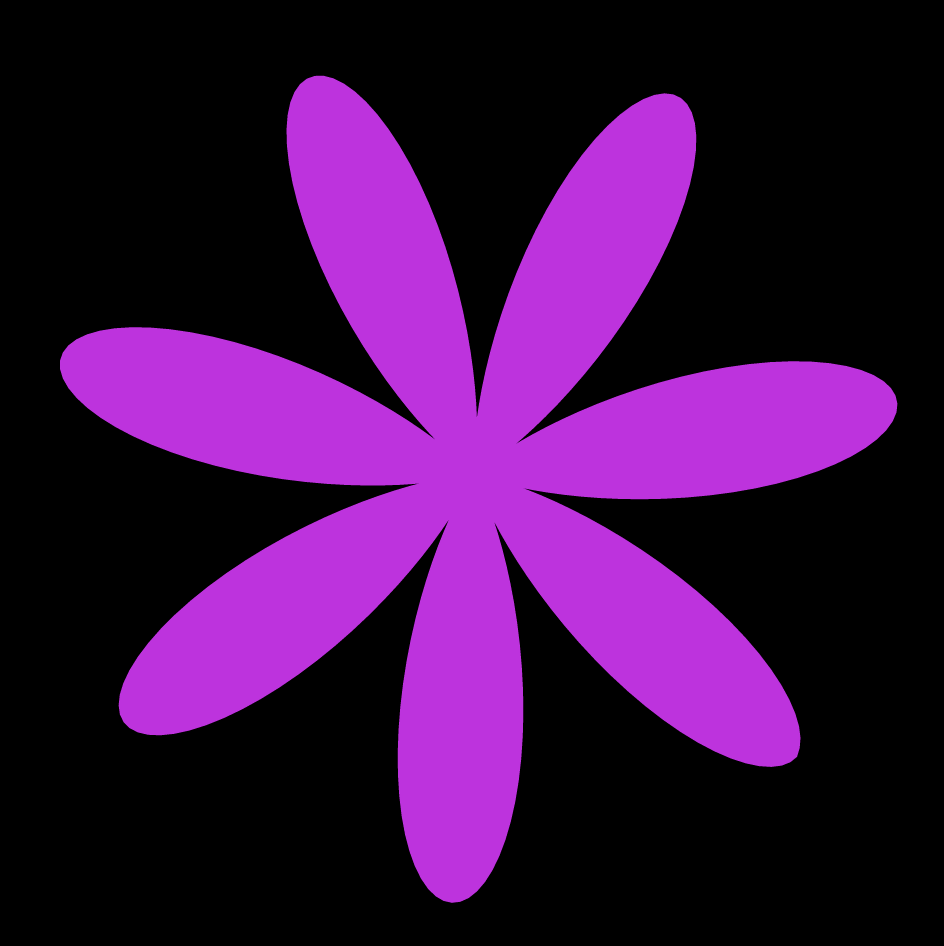
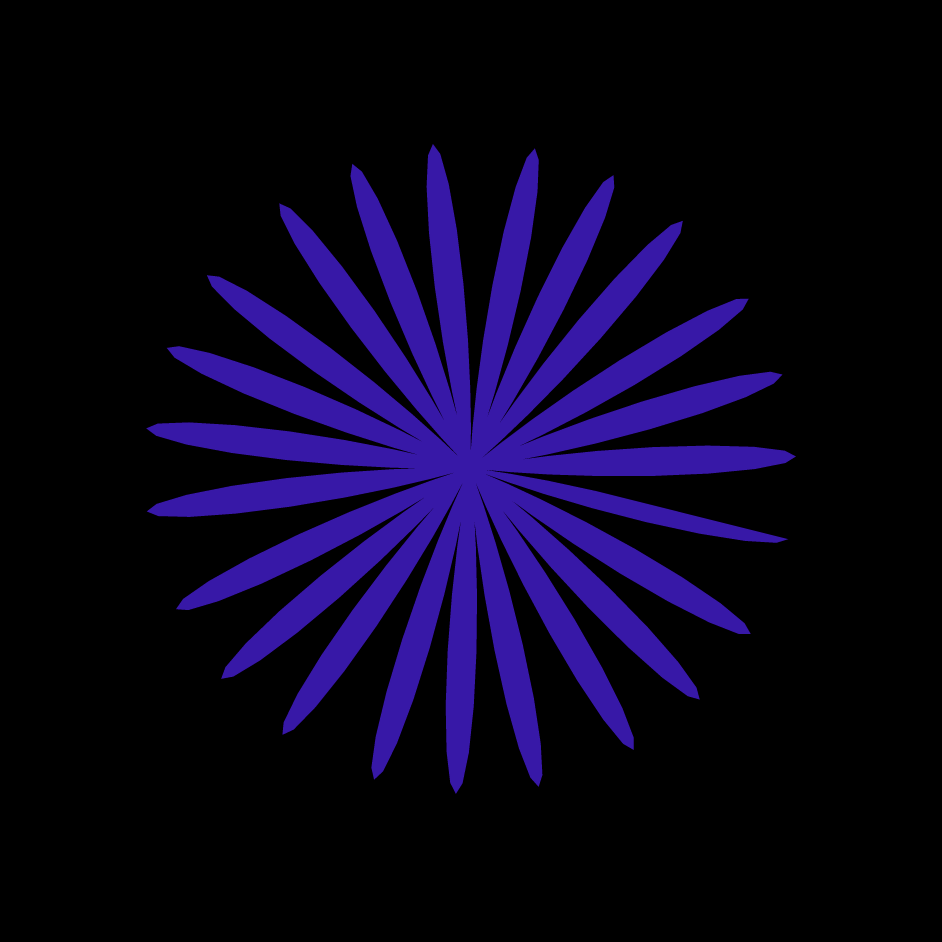
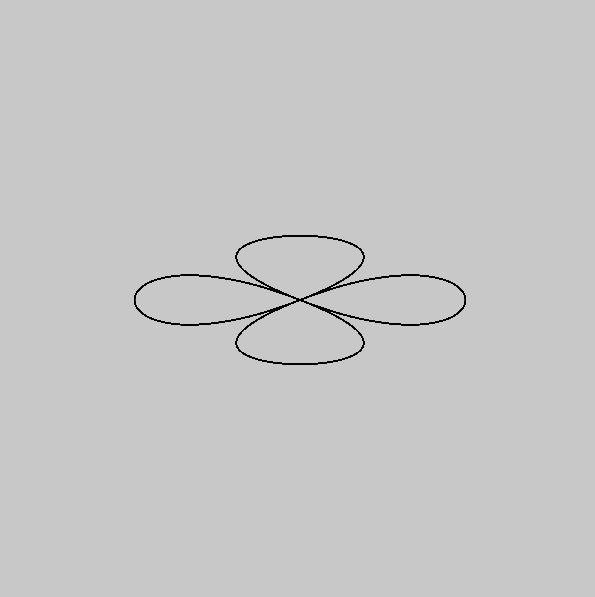
For this project, I was excited to explore different types of curves and how you can create new ones through simple interactions. I started off my process by looking at and trying different curves in Sublime to see which ones were the most interesting to change. I also spent some time plugging mouseX and mouseY into different parts of the equation to see how they changed. I found it interesting that curves can look completely different based on which variables were changed. For instance, I used a Cayley’s Sextic curve for one of my curves, which looks like a rounded heart. However, when you control the ratio multiplied by cosine, it changes the number of curves and their rotation so it looks like a flower.
Astroid curve in different phases:
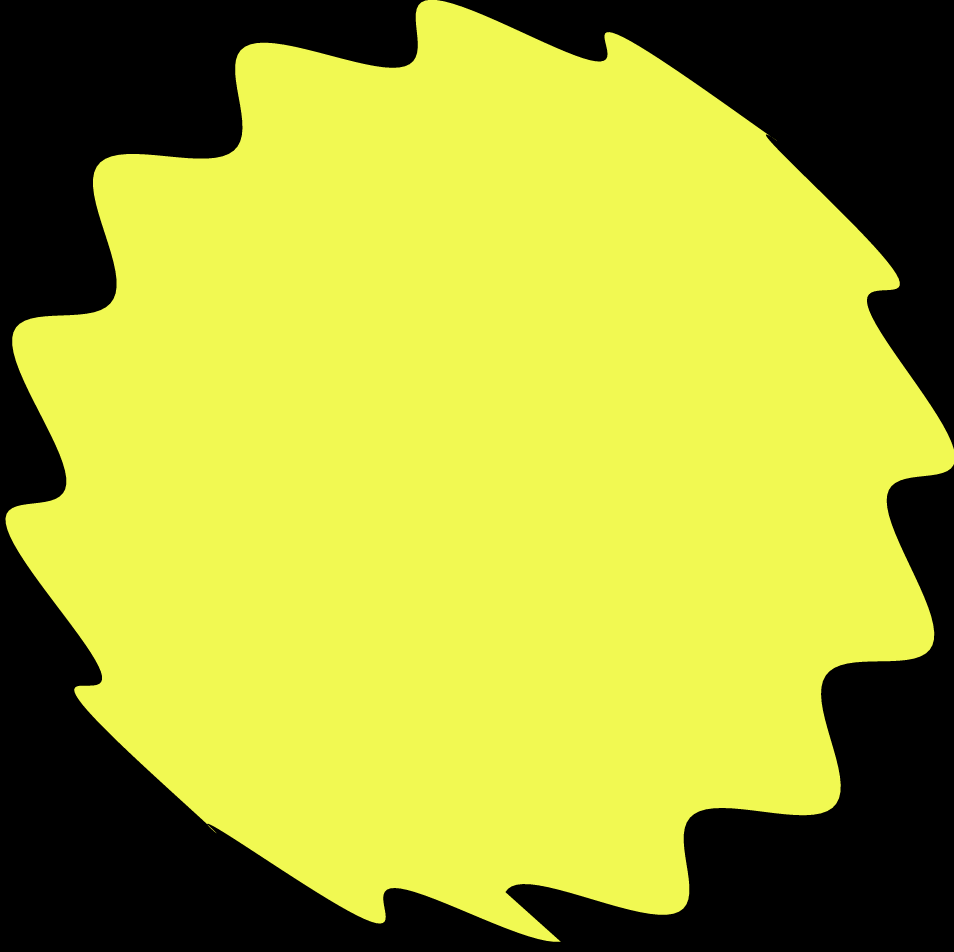
Cayley’s Sextic in different phases:
//Catherine Liu
//jianingl@andrew.cmu.edu
//Section D
//jianingl_07_Project

var type = 1 //keeps track of current type of curve

//draws two different types of curves that changes with mousePressed
function setup() {
    createCanvas(480, 480);
}

function draw() {
    //checks for current curve
    if (type == 1) {
        drawSextic();
    } else if (type == 2) {
        drawAstroid();
    }
}

function drawAstroid() {
    //Astroid
    //https://mathworld.wolfram.com/Astroid.html
    //creates a circular form with curves around the circumference
    var red = min(mouseX, 255);
    var green = min(mouseY, 255);
    fill(red, green, 0);
    noStroke();
    translate(width/2,height/2);
    background(0);
    beginShape();
    var x ;
    var y ;

    var b = map(mouseY, 0, 480, 10, 20); //controls number of curves around circumference
    var a = constrain(mouseX, 0, width/2); //controls size of circle curve
    rotate(radians(mouseY/3));
    for (i = 0; i < 480; i++) {
        var theta = map(i,0,480, 0, TWO_PI);
        x = (a-b)*cos(theta) + b*cos((a-b)/b*(theta));
        y = (a-b)*sin(theta) - b*cos((a-b)/b*(theta));
        vertex(x,y);
    }
    endShape();

}

function drawSextic() {
    //Cayley's Sextic
    //https://mathworld.wolfram.com/CayleysSextic.html
    //creates a flower form with different numbers of petals
    push();
    var blue= min(mouseX, 255);
    var red = min(mouseY, 255);
    translate(width/2,height/2);
    fill(red,0,blue);
    noStroke();
    background(0);
    beginShape();
    var x ;
    var y ;

    var b = map(mouseY, 0, 480, 0, 1); //controls rotation and number of petals
    var a = map(mouseX, 0, width, 0, 150); //controls size of form
    rotate(radians(mouseY/5));
    for (i = 0; i < 480; i++) {
        var theta = map(i, 0, 480, 0, PI * 3);
        x = (3*a*pow(cos((1/b)*theta),3)*cos(theta));
        y = (3*a*pow(cos((1/b)*theta),3)*sin(theta));
        vertex(x,y);
    }
    endShape();
    pop();
}

function mousePressed() {
    //switches current curve when mouse is pressed
    if (type == 1) {
        type += 1
    } else if (type == 2) {
        type = 1
    }
}
function setup() {
    createCanvas(600, 600);
    background(200);
    stroke(0);
    noFill();
}

function draw() {
    curve(300+mouseX*2, 300+mouseY*2, 300, 300, 300, 300, 300+mouseX*2, 300-mouseY*2);
    curve(300+mouseX*2, 300-mouseY*2, 300, 300, 300, 300, 300-mouseX*2, 300-mouseY*2);
    curve(300-mouseX*2, 300-mouseY*2, 300, 300, 300, 300, 300-mouseX*2, 300+mouseY*2);
    curve(300-mouseX*2, 300+mouseY*2, 300, 300, 300, 300, 300+mouseX*2, 300+mouseY*2);
}
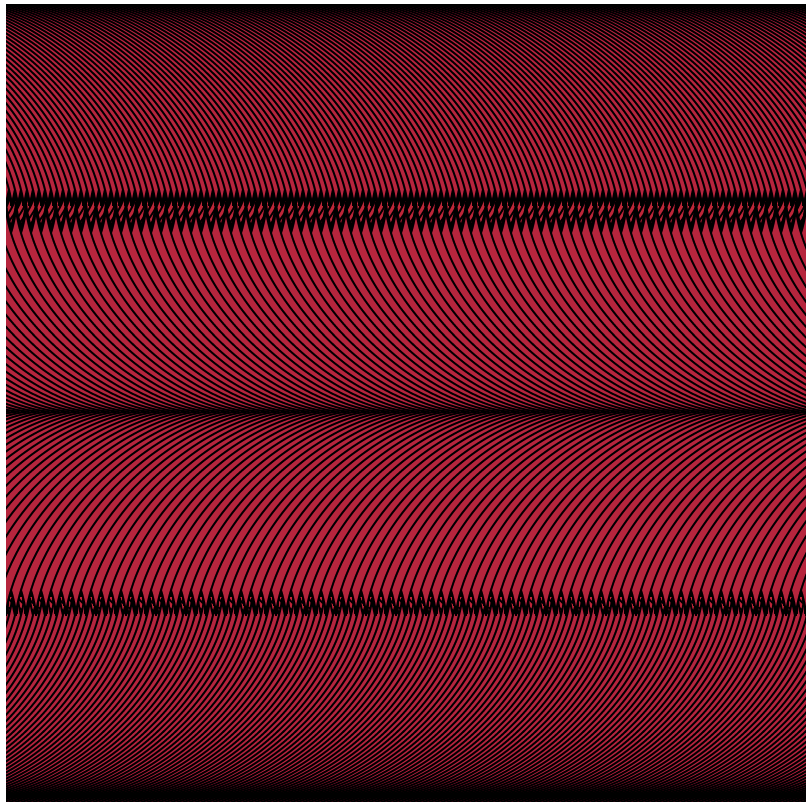
For this project I made 2 lemniscates(?) that can be manipulated using the x and y coordinates of the mouse. I decided not to erase the previous drawings so that the user could have multiple shapes on the canvas.
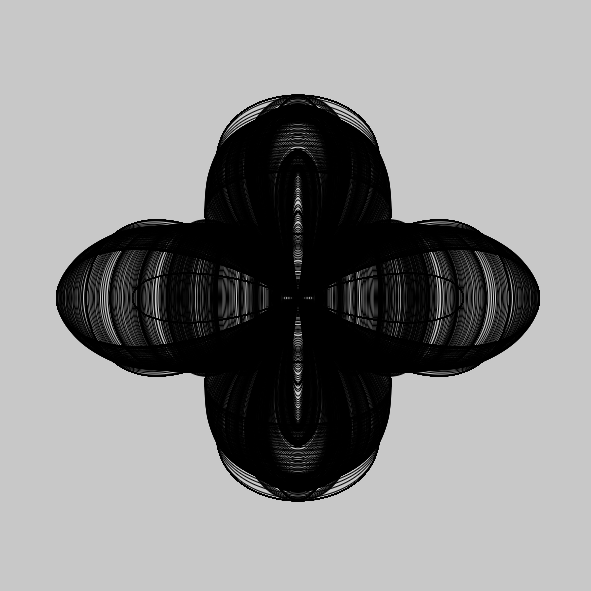
]]>I chose to use two curves in my project. both are hypocycloids, which I think are very interesting curves. However, while they are both hypocycloids, they behave very differently from each other. The one in the center never overlaps itself each time it is drawn; However, each time the outer curve is drawn it crossed over itself a bunch of times due to the parameters it is given. This causes a cool effect to be visualized on the canvas. I also think the colors work well together.
var nPoints = 100;

function setup() {
    createCanvas(480, 480);
    background(200,50,86);
}

function draw() {

        push();
        translate(240, 240);
        Hypotrochoid();
        Astroid();
        pop();

}

function Astroid() {
    //housekeeping
    c = color(map(mouseX, 0,480, 0, 255), map(mouseY, 0,480, 150, 200),map(mouseY+mouseY, 0, 960, 0, 255))
    stroke(c);
    strokeWeight(3);
    noFill();

    //asteroid equation
    var a = int(map(mouseY, 0, width, 4, 20));
    var b = int(map(mouseX, 0, width, 0, 100));
    beginShape();
    for (var i = 0; i < nPoints; i++){
        angle = map(i, 0, nPoints, 0, radians(360));
        x = (b / a) * ((a - 1) * cos(angle) + cos((a - 1) * angle));
        y = (b / a) * ((a - 1) * sin(angle) - sin((a - 1) * angle));
        vertex(x,y);
    }
    endShape();

}

function Hypotrochoid() {
    //housekeeping
    c = color(map(mouseX, 0,480, 150, 200), map(mouseY, 0,480, 0, 255),map(mouseY+mouseY, 0, 960, 0, 255))
    stroke(c);
    strokeWeight(1);
    noFill();

    // hypotrochoid equation
    var a = map(mouseY, 0, 480, 0, 250);
    var b = 5
    var h = map(mouseX, 0, 480, 2, 105);
    beginShape();
    for (var i = 0; i < nPoints; i++ ) {
        var angle = map(i, 0, nPoints, 0, radians(360));
         x = (a - b) * cos(angle) + h * cos((a - b) * (angle / b));
         y = (a - b) * sin(angle) - h * sin((a - b) * (angle / b));
        vertex(x, y);
    }

  endShape();
}// gnmarino@andrew.cmu.edu
// Gia Marino
// section D
var red; // variable for red in fill for gradient
var blue; // variable for blue in fill for gradient
function setup() {
createCanvas(400, 400);
background(200);
}
function draw() {
// maps variables red and blue so mouseX at 0 makes fill blue
// and at edge of the canvas mouseX makes color red
// creates a blue to red gradient
red = map(mouseX, 0, width, 0, 255);
blue = map(mouseX, width, 0, 0, 255);
// fills shapes and makes a red to blue gradient
fill(red, 0, blue);
// nested loop draws astroids going to the right and skips every other row
for (var y1 = 0; y1 <= width; y1 += 4*size) {
drawAstroid(0, y1);
for(var x1 = 0; x1 <= width + size; x1 += 3) {
drawAstroid(x1, y1);
}
}
// nested loop draws astroids going to the left and skips every other row
for (var y2 = 2 * size; y2 <= width; y2 += 4*size) {
drawAstroid(width, y2);
for(var x2 = width; x2 >= 0 - size; x2-=5) {
drawAstroid(x2, y2);
}
}
}
function drawAstroid(x, y) {
// push needed so translate doesn't effect rest of code
push();
translate(x, y);
beginShape();
// loop and astriod x and y implements math for astroid curve
for(var k = 0; k<360; k++){
// allows for mouseY to change size of astroid between 20 up to 80 pixels
size = map(mouseY, 0, height, 20, 80);
Astroidx = size * Math.pow(cos(radians(k)),3);
Astroidy = size * Math.pow(sin(radians(k)),3);
vertex(Astroidx,Astroidy);
}
endShape(CLOSE);
pop();
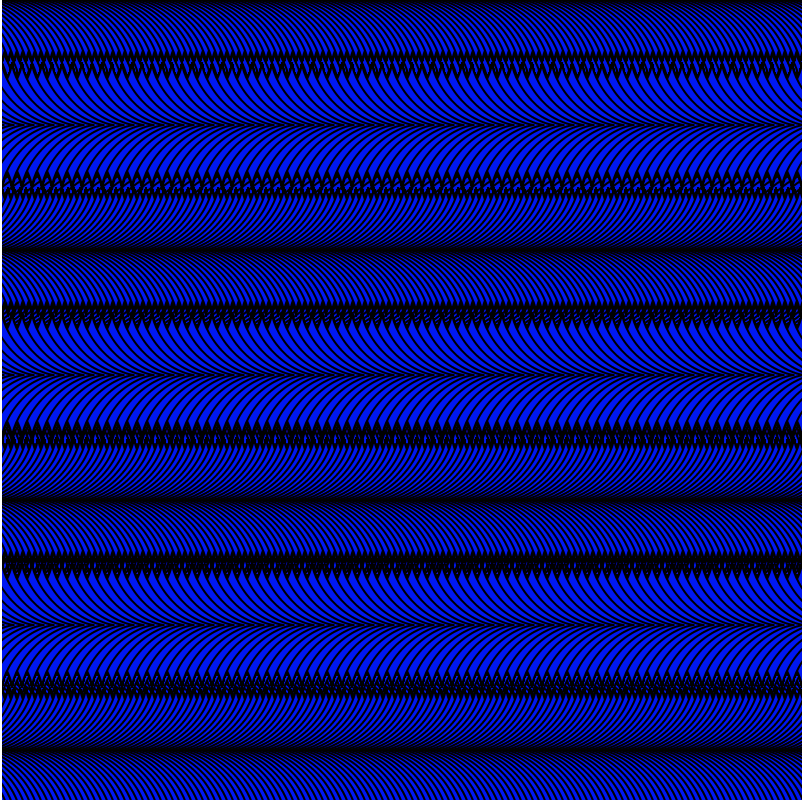
}For this week I had a really difficult time figuring out what curves would work for my ideas. I originally wanted to try a whirl with a logarithmic spiral but it was too difficult to implement the math. I then found the astroid shape and thought it was cool so I figured out how to implement it into code and then I made it move with mouse X and mouse Y tried to find a pattern or drawing that would look cool. I eventually found a pattern by doing this and decided my idea. I then decided my parameters would be changing the size of the astroid which therefore changes how many rows you see, and the color.
var nPoints = 100;
var EPITROCHOID = 0;
var CRANIOID = 1;

var curveMode = EPITROCHOID;


function setup() {
    createCanvas(480, 480);
    frameRate(5);
}


function draw() {
    background(200,200,255);

    // curve
    push();
    translate(width / 2, height / 2);
    switch (curveMode) {
    case EPITROCHOID:
        drawEpitrochoidCurve();
        break;
    case CRANIOID:
        drawCranioidCurve();
        break;
    }
    pop();

    //moving shape
    let x = mouseX;
     let y = mouseY;
     let ix = width - mouseX;  // Inverse X
    let iy = height - mouseY; // Inverse Y
    ellipse(x, height/2, y, y);
     fill(255);
     noStroke();
    ellipse(ix, height/2, iy, iy);
}

function drawEpitrochoidCurve() {

    var x;
    var y;

    var a = mouseY;
    var b = mouseX;

    noStroke();
    fill(255,200,200);

    beginShape();
    for (var i = 0; i < nPoints; i++) {
        var t = map(i, 0, nPoints, 0, TWO_PI);

        x = 4 * b * cos (t)* cos (t)* cos (t);
        y = a * sin (t) *sin (t)* sin (t);

      vertex(x, y);
    }
    endShape(CLOSE);

}
//Julianna Bolivar
//jbolivar@andrew.cmu.edu
//Section D
//Project 07: Composition with Curves

var x;
var y;

function setup() {
    createCanvas(480, 480);
    frameRate(10);
}

function draw() {
    background(0);
    for (var curveLines = 1; curveLines < 10; curveLines++){ //draw slinky
        for (var amtLines = 1; amtLines < 5; amtLines++){
            push();
            translate(curveLines * 10, amtLines * 10);
            drawEpiTri();
        }
    }
}

function drawEpiTri() {
    var a = map(mouseX, 0, width, 15, 100);
    var b = map(mouseY, 0, height, 15, 50);
    noFill();
    stroke(mouseX, mouseY, 0); //color changes with mouse
    push();

    var a = map(mouseY, 0, width, 10, 50);
    var b = map(mouseX, 0, height, 10, 50);
    var h = constrain(mouseY, 0, b);
    var ph = mouseY/50;

    beginShape();
    for (var i = 0; i <= 500; i ++) { //shape equation
        var theta = map(i, 0, 50, 0, TWO_PI);
        x = (a+b)*cos(theta)-h*cos(ph+theta*(a+b)/b);
        y = (a+b)*sin(theta)-h*sin(ph+theta*(a+b)/b);
        vertex(x, y);
    }
    endShape();
    pop();
}
//Yanina Shavialenka
//Section B
var n;
var heartShape = [];
var theta = 0;
var nPoints = 55;
function setup() {
createCanvas(480, 480);
}
function draw() {
background(map(mouseX, 0, width, 0, mouseY));
heartCurve();
epitrochoidCurve();
hypotrochoidCurve();
astroidCurve();
}
function heartCurve() {
//https://mathworld.wolfram.com/HeartCurve.html
push();
fill(255, 153, 255);
stroke(73, 84, 216);
translate(width/2, height/2-35);//changes (0,0) point to center the heart in the middle
beginShape(); //Begins to draw heart curve
for (var v of heartShape) {
vertex(v.x, v.y);
}
endShape(); //Ends drawing heart curve
//The following equations were taken from teh MathWorld
var radius = height / 40; //sets how big the heart is on the canvas
var xPos = 16 * pow(sin(theta), 3) * radius;
var yPos = (13 * cos(theta) - 5 * cos(2 * theta) - 2 * cos(3 * theta) - cos(4 * theta)) * -radius;
heartShape.push(createVector(xPos, yPos));
theta += 0.8; //changes the angle by 0.8 each time which increases the outer blue stroke
pop();
}
function epitrochoidCurve() {
//https://mathworld.wolfram.com/Epitrochoid.html
var b = 3.5;
var h = (b + 5) + mouseX/100;
var a = mouseX/b;
push();
noFill();
stroke(0, 0, mouseX);
translate(180, height/2-50);
/*
Changes (0,0) point to center the epitrochoid on the
left side of a heart.
*/
beginShape(); //Begins to draw epitrochoid curve
//The following equations were taken from teh MathWorld
for(var t = 0; t <= TWO_PI; t += PI/110){
var xPos = (a+b) * sin(t) - h * sin(((a+b)/b) * t);
var yPos = (a+b) * cos(t) - h * cos(((a+b)/b) * t);
vertex(xPos,yPos);
}
endShape(); //Ends drawing epitrochoid curve
pop();
}
function hypotrochoidCurve() {
//https://mathworld.wolfram.com/Hypotrochoid.html
var b = 3.5;
var h = mouseY/2; //As height increases, the get little sharp crown circles
//As height decreases, we get oval star curves instead of crown circles
var a = mouseX/b;
push();
noFill();
stroke(mouseX, 0, 0);
translate(width/2+70, height/2-35);
/*
Changes (0,0) point to center the hypotrochoid on the
right side of a heart.
*/
beginShape(); //Begins to draw hypotrochoid curve
//The following equations were taken from teh MathWorld
for (var i = 0; i <= nPoints; i ++) {
var t = map(i, 0, 50, 0, TWO_PI);
var xPos = (a-b) * cos(t) + (h * cos(((a-b)/b) * t));
var yPos = (a-b) * sin(t) - (h * sin(((a-b)/b) * t));
vertex(xPos,yPos);
}
endShape(); //Ends drawing hypotrochoid curve
pop();
}
function astroidCurve() {
//https://mathworld.wolfram.com/Astroid.html
var a = map(mouseX, 0, width, 0, height);
push();
noFill();
stroke(0, mouseX, 0);
translate(width/2, 300);
/*
Changes (0,0) point to center the astroid at the
bottom of a heart.
*/
beginShape(); //Begins to draw astroid curve
//The following equations were taken from teh MathWorld
for (var i = 0; i < height; i++) {
var t = map(i, 0, width, 0, TWO_PI);
var xPos = 3 * a * cos(t) + a * cos(3 * t);
var yPos = 3 * a * sin(t) - a * sin(3 * t);
vertex(xPos,yPos);
}
endShape(); //Ends drawing astroid curve
pop();
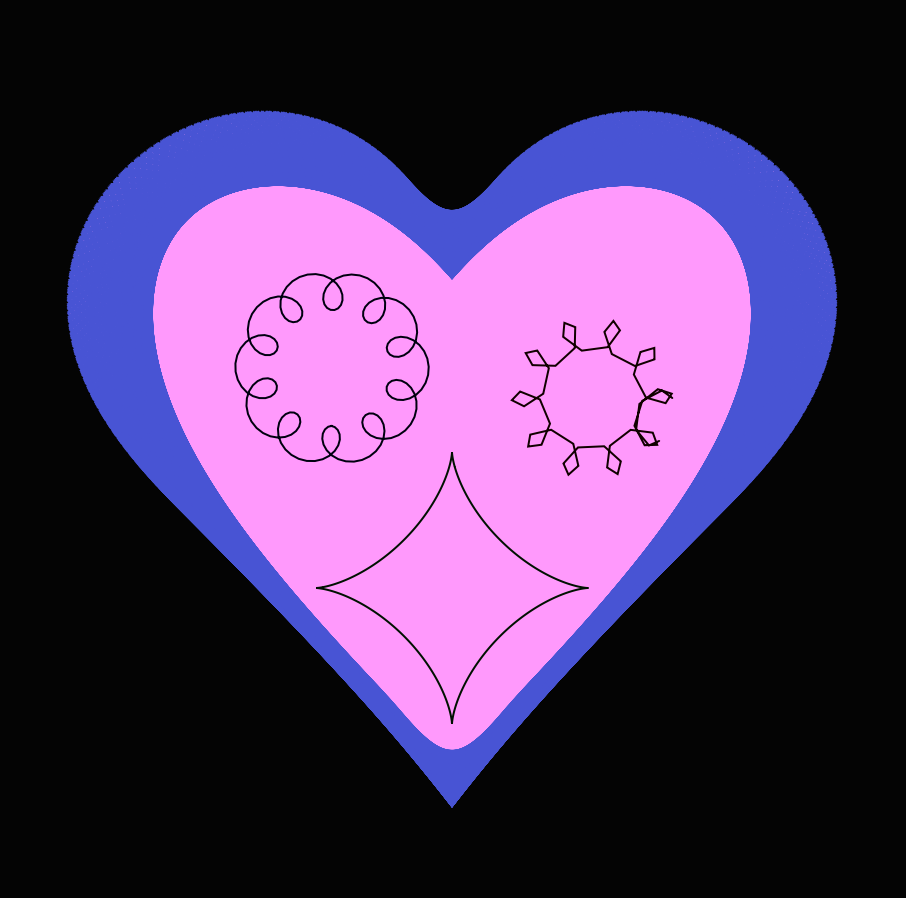
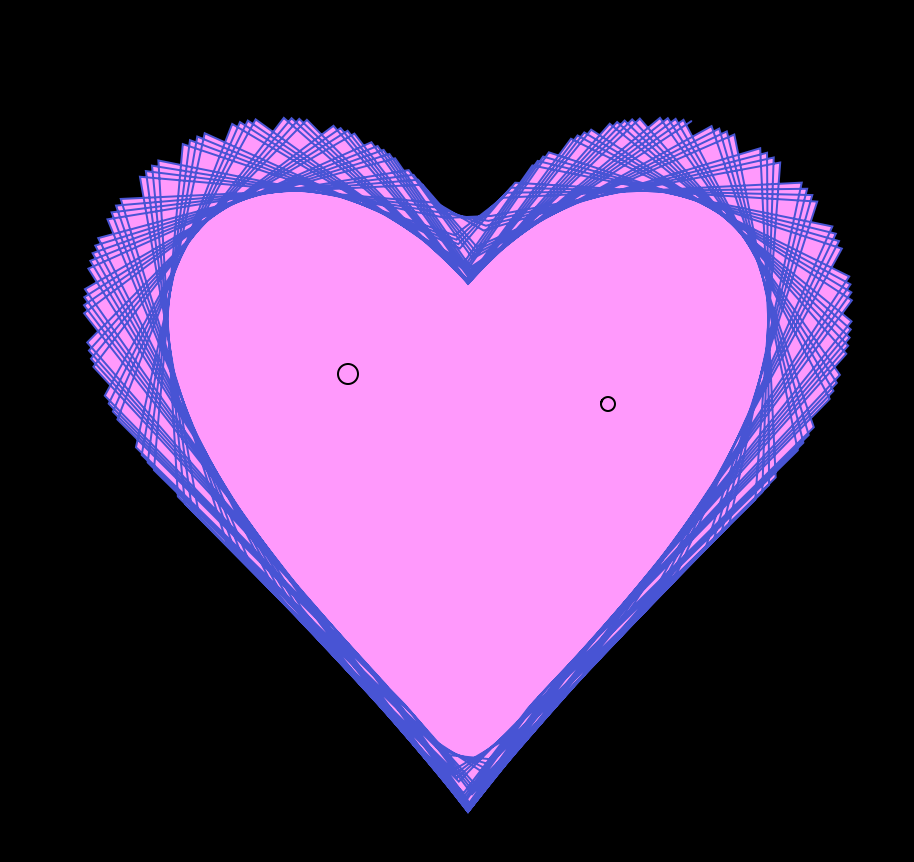
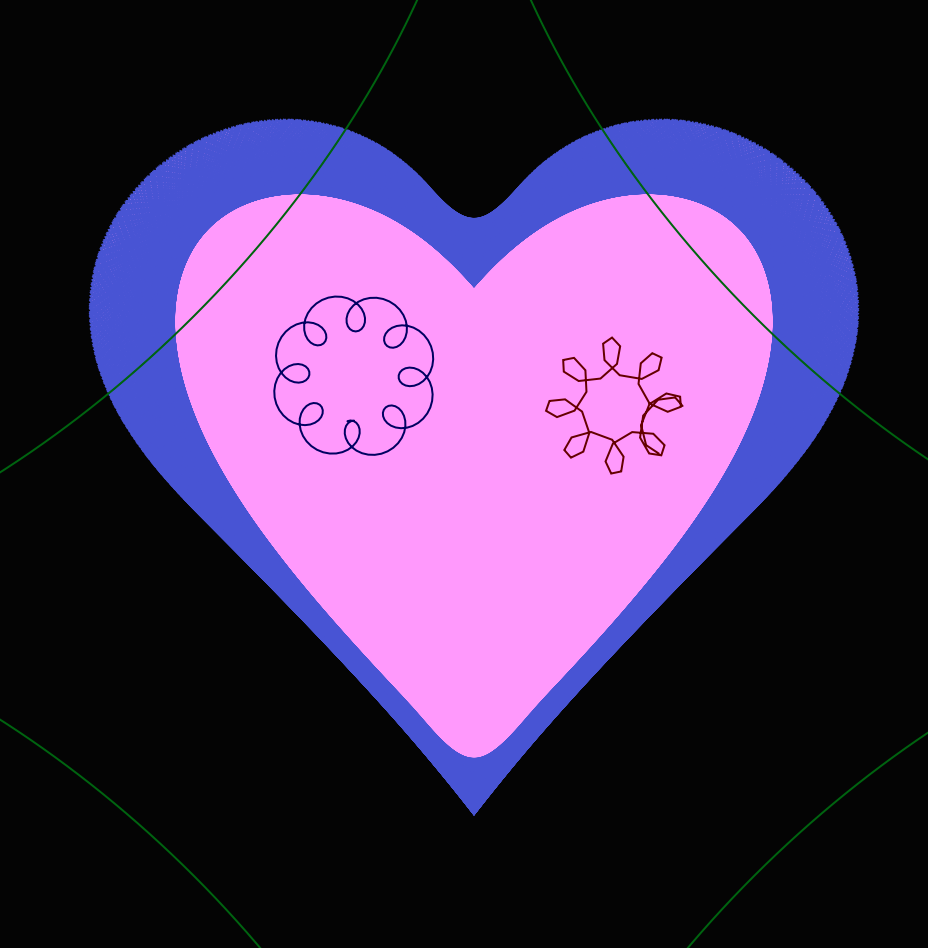
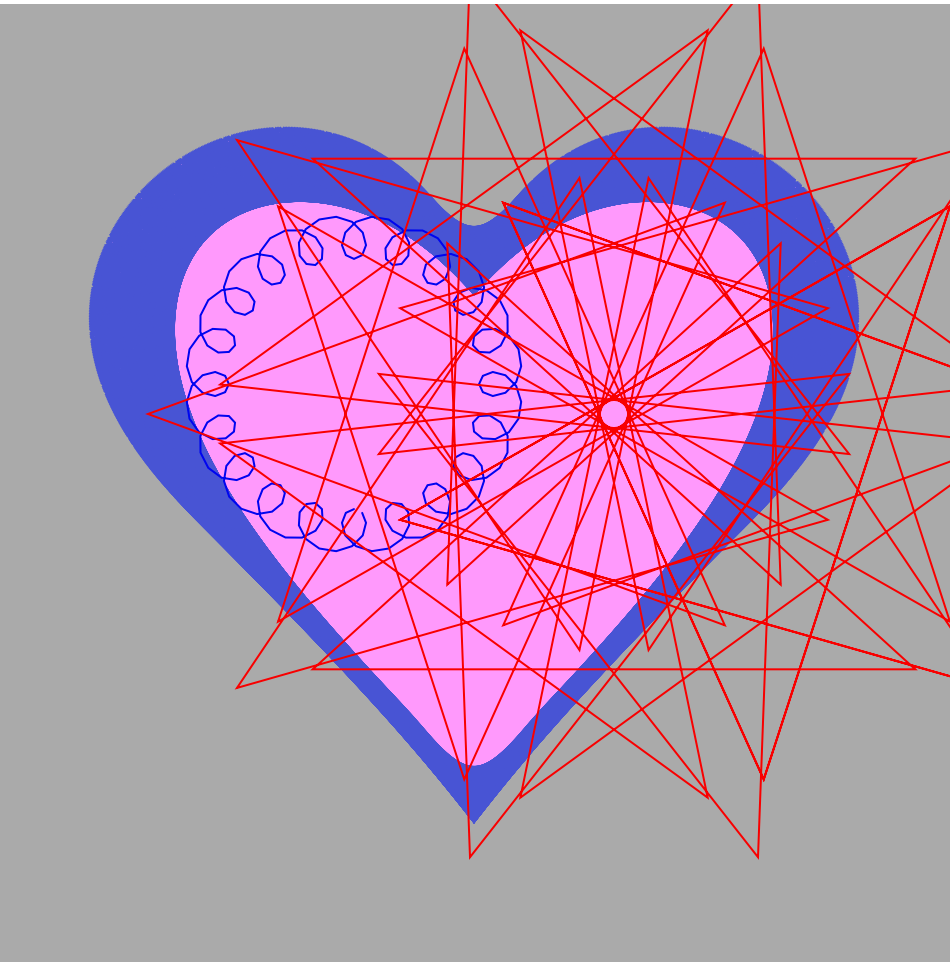
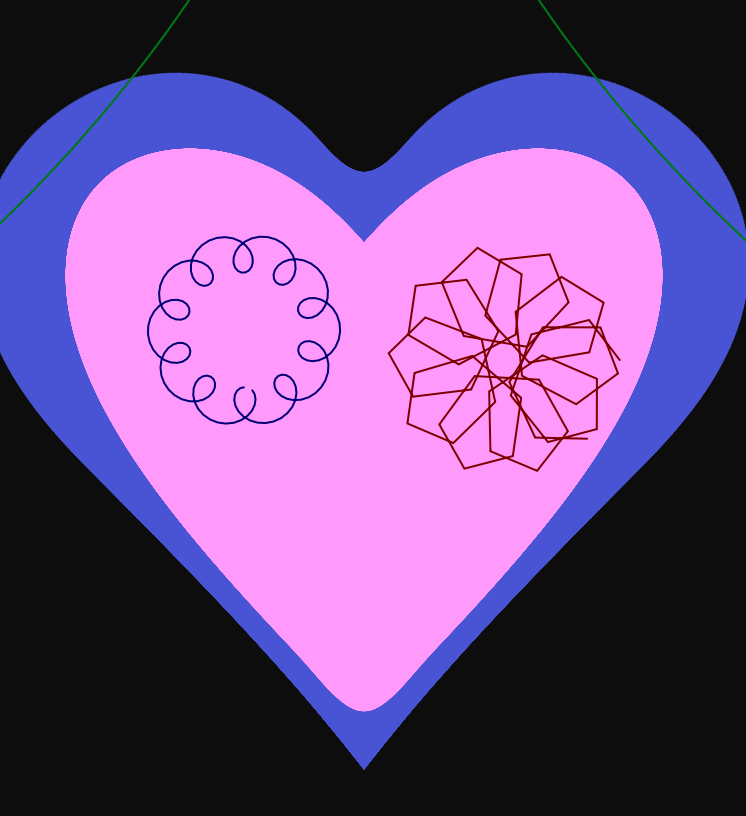
}In this project I drew the curve of a heart and inside of a heart there’s 3 addition curves. Epitrochoid and hypotrochoid in my opinion were kind of like opposite of each other since epitrochoid draws ellipses inside and hypotrochoid draws ellipses outside. For me it was kind of challenging to do this because I had to research a lot of new functions such as Math.pow and many things for me didn’t work so I had to change the curves multiple times for them to work. It was interesting to analyze how angles of 0.1 or 1 would affect the curves, sometimes the smaller the angle the bigger the shape became which is polar opposite of what would I have expected.