![[OLD SEMESTER] 15-104 • Introduction to Computing for Creative Practice](https://courses.ideate.cmu.edu/15-104/f2022/wp-content/uploads/2023/09/stop-banner.png)
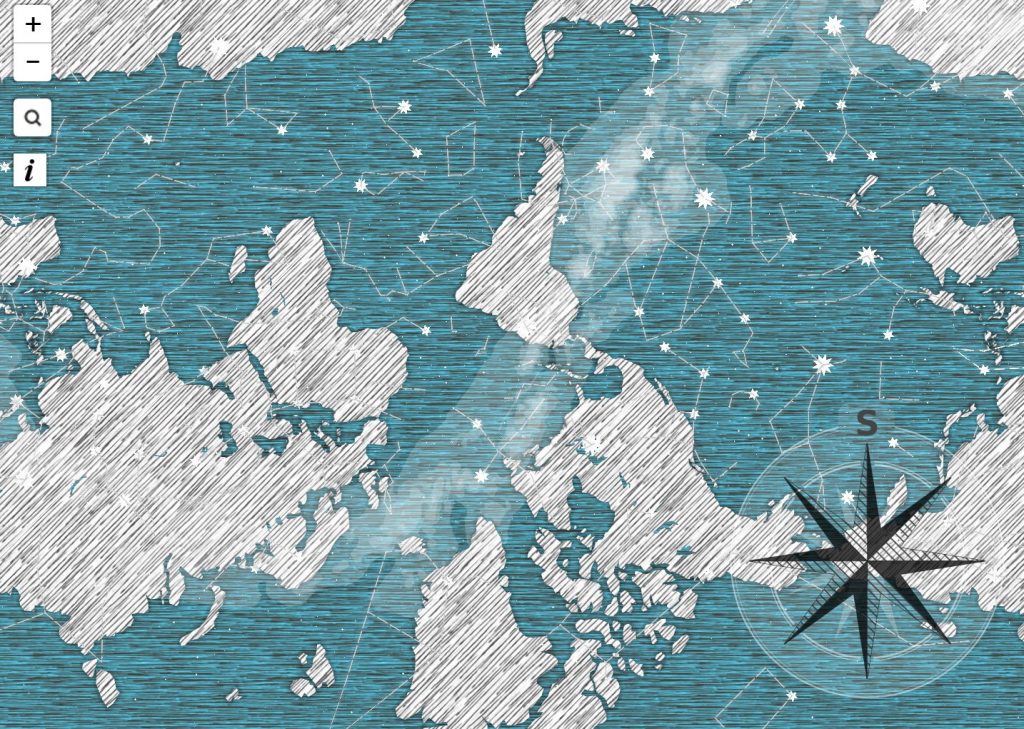
I really admired Patricio González Vivo and Jen Lowe’s map “Guayupia”, which is created for their son, and it’s a great example for discovering about data visualization. They think beyond typical standard and restrictions in creating a map: they want to use this map to tell their son where he comes from and the unlikely fact of his existence. So this is a map exploring about culture and history rather than simple numerical information. They explore South America and Argentina history from different aspects, and there are many different components in this map. The thing I found is interesting is that they also make their map become a symbol of culture: they combine stars with human, creatures and god, and they even incorporates the mass migrations of the Tupi-Guarani people.
Lowe uses basic lines and shading to construct this map. They use lines to show star, land and coastline based on history research, shading is used to show migrations. I like the color of this map and how they use uniformed ways to represent different things.
link: http://themapisnot.com/issue-iv-patricio-gonzalez-vivo-jen-lowe