![[OLD SEMESTER] 15-104 • Introduction to Computing for Creative Practice](https://courses.ideate.cmu.edu/15-104/f2022/wp-content/uploads/2023/09/stop-banner.png)
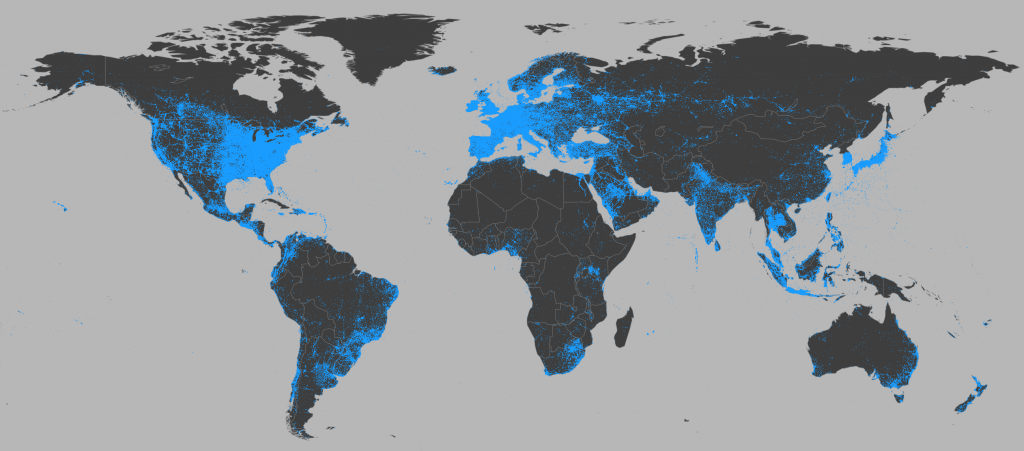
To better understand Computational Information Visualization, I looked into the Visual Earth project led by Dr. Lev Manovich. It’s a really cool project that compiles data about images and photographs on the internet on a visual map of the earth in order to understand global growth trends better, and how our visually heavy spaces online vary geographically in relation to various factors like economic and cultural differences. They compute this by using images from Twitter that have the locations tagged. However, they mention only processing a part of the total data set they collect (100 out of 270 million) which is done through a random process much like the ‘random’ function in p5.js. The visual form of processing and communicating this massive amount of information is really useful in allowing people to visually process different rates of image sharing as they are influenced by things like income or even geographical landscape.