![[OLD SEMESTER] 15-104 • Introduction to Computing for Creative Practice](https://courses.ideate.cmu.edu/15-104/f2022/wp-content/uploads/2023/09/stop-banner.png)
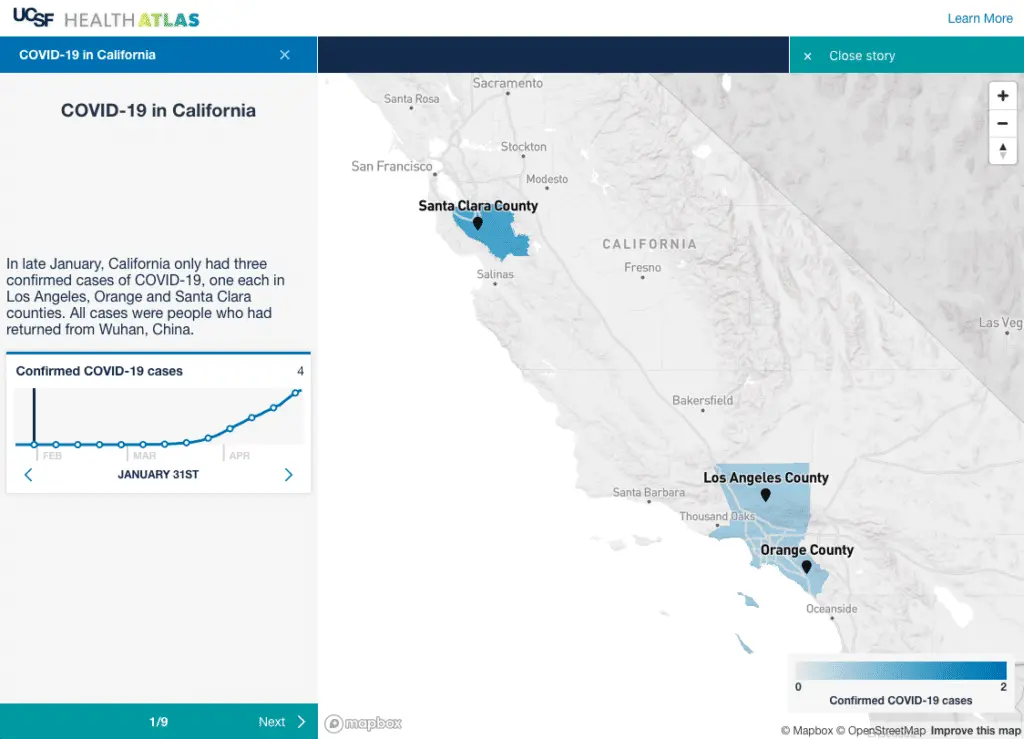
The UCSF Health Atlas is an online software that visualizes Covid 19 pandemic cases in all the counties in California. I admire its purpose, which is to explore the influence of “socioeconomic and environmental factors” during the pandemics, which means the project is based on census tract at a county level, and it allows us to see the detrimental influence of pandemics with our eyes.
For the Algorithm, I believe that it imports census Datas and data of covid cases into the website. Then the web divides the cases into different data sets on a county level and uses different coloration to represent the severity of the pandemic. The blue the county is on the map, the more covid cases it has, and yellow represents the amount of people who died from the pandemic in that county.
The artistic sensibilities manifest in the final form of a map of blue California that shows the number of the covid cases based on its lightness, because the darker colors mean more cases. I hope it becomes a map of the whole planet in the future, so people all over the world can know when to be cautious about pandemics.
Link: UCSF Health Atlas Author: Collaboration of UCSF School of Medicine Dean’s Office of Population Health and Health Equity led by Debby Oh and Stamen Design Year of Creation: 2020(To my best Knowledge)