![[OLD SEMESTER] 15-104 • Introduction to Computing for Creative Practice](https://courses.ideate.cmu.edu/15-104/f2022/wp-content/uploads/2023/09/stop-banner.png)
sketch
//SRISHTY BHAVSAR
//15-104 SECTION C
//PROJECT 7
var nPoints = 500;
function setup() {
createCanvas(400, 400);
}
function draw() {
createCanvas(480, 480);
background(0);
// draw the curve
fill(154,205,40,70); // yellow green color
ranunculoid(10,20);
hypotro();
noFill();
ranunculoid(30,50);
ranunculoid(40,60);
}
//--------------------------------------------------
function hypotro() {
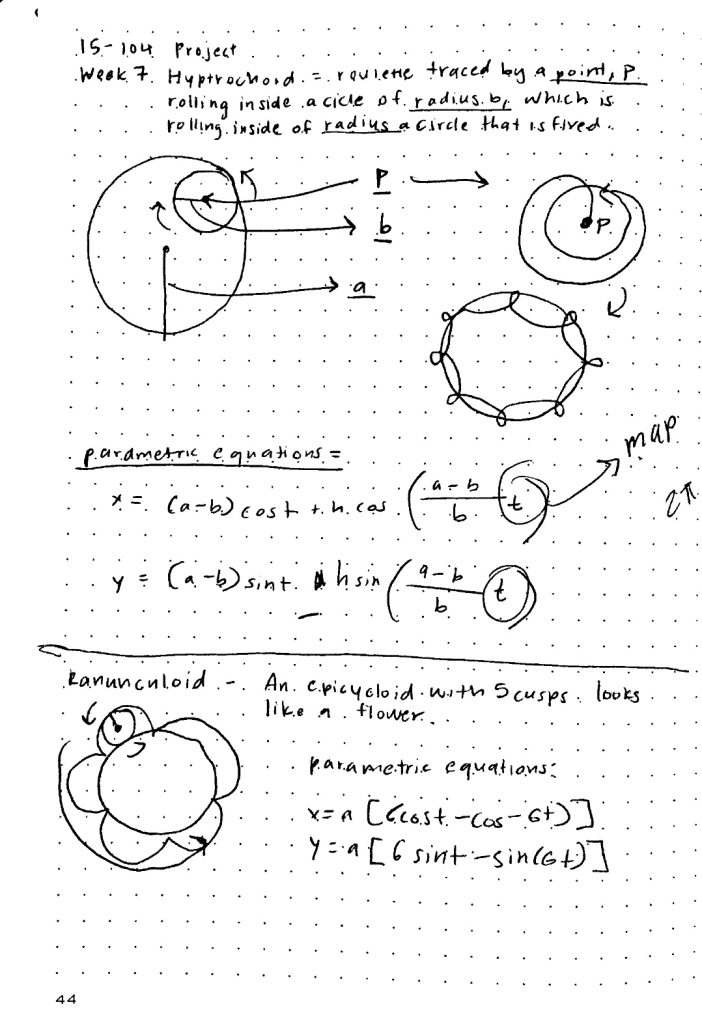
// Hypotrochoid
// https://mathworld.wolfram.com/Hypotrochoid.html
push();
noFill();
stroke('magenta');
strokeWeight(1);
translate(width/2 , height/2);
var x = constrain(mouseX, 0, width);
var y = constrain(mouseY, 0, height);
var a = map(x, 0, width, 60, 160); //radius of still circle
var b = map(y, 0, height, 1, 8); // radius b of rolling circle inside still circle
var h = constrain(a/2, 100, 100); //
beginShape();
for (var i = 0; i < nPoints; i++) {
var t = map( i, 0, nPoints, 0, TWO_PI); // tangent?
//PARAMETRIC EQUATIONS
x = (a - b) * cos(t) + (h * cos(((a-b)/b)*t));
y = (a - b) * sin(t) - (h * sin(((a-b)/b)*t));
vertex(x,y); // connected to center vertex
}
endShape();
pop();
}
//--------------------------------------------------
function ranunculoid(xsize,ysize) {
// https://mathworld.wolfram.com/Ranunculoid.html
push();
stroke('green');
strokeWeight(1);
translate(width/2 , height/2);
var x = constrain(mouseX, 0, width);
var y = constrain(mouseY, 0, height);
var a = map(mouseX, 0, width, xsize, ysize);
beginShape();
for (var i = 0; i < nPoints/10; i++) {
var t = map(i, 0, nPoints/10, 0, TWO_PI);
x = a * (( 6 * cos(t)) - cos(6*t))
y = a * (( 6 * sin(t)) - sin(6*t))
vertex(x, y);
}
endShape();
pop();
}