Looking Outwards 11

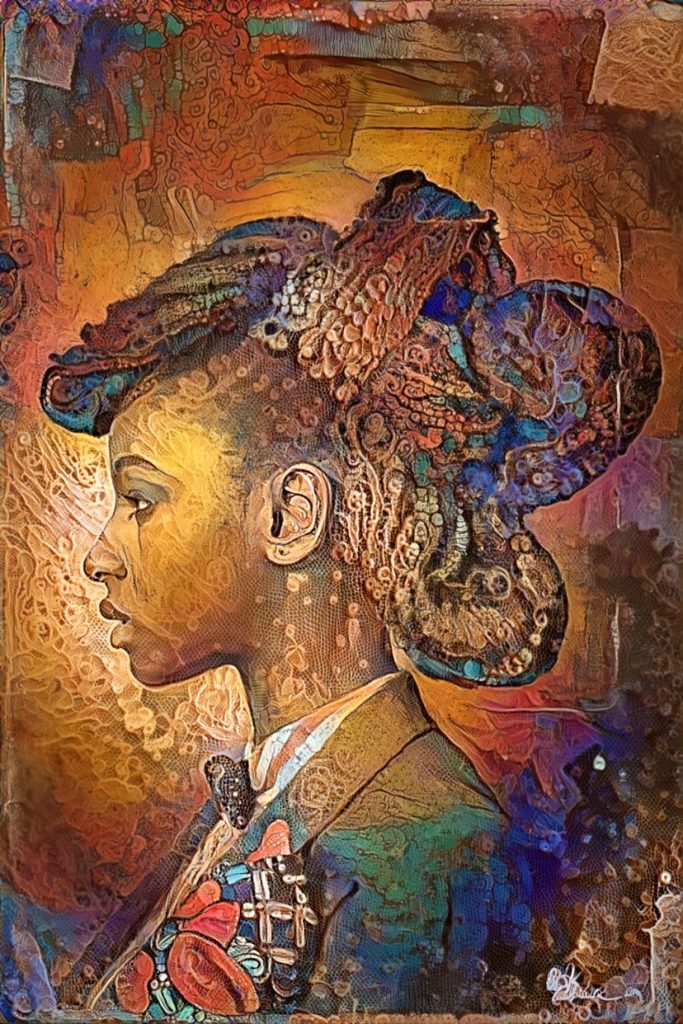
For this Week’s Looking Outwards, I read AI & Creativity: Addressing Racial Bias in ComputerGraphics. I chose this article because it aligns with a recent discussion we had in Design Cultures about design and race. In the article they talk about racial bias in computer graphic tracing back to when the technology was first developed. One example given is the glow that is added to create inclusion of lighting. When these techniques were developed they did not count for the effects it would have on darker skin. The result is that darker skin looks less realistic. Another example is in hair generation software that often ignores type 4, afro hair types. These issues with software limit creators and representation in video games, and other computer aided works. One interesting solution the article gave was to use deep machine learning to generate better images, as an example of this they shared artwork Netteice Gaskins created by such algorithms.

https://nettricegaskins.medium.com/ai-creativity-addressing-racial-bias-in-computer-graphics-f5fc0c255e7

Nettrice Gaskins. “Dandy Dream,” 2021. Created using a deep learning algorithm

Project 9 portrait

sketch
//Evette LaComb 
//Section D 
//09 project 


//the portrait must be an un-retouched photograph of a person
//that can be acessed on imgur.com 
//you can only display the portrait generated
//should not be bigger than 480 x 480
//show creativity 
//write a sentance or tow reflecting on your process and product 


let img;
var x; 
var y;

var angle = 0;
var radius = 0;
var frameCount = 0;
var circleSize = 1;

function preload() {
  img = loadImage("https://i.imgur.com/a9JqjIf.jpg");
}

function setup() {
  createCanvas(480, 480);
  img.loadPixels();
  imageMode(CENTER);
  img.resize(480, 480)
  background("grey");

  noStroke();

}

function draw() {

    //varaibles for x and y occording to spiral 

    x = radius * cos(radians(angle));
    y = radius * sin(radians(angle));

    //code for calling pixels: 


   var pix = img.get(x, y);
   var pixx = img.get(width/2, y);

   //code for the circels and fill:


    fill(pix);
    circle(x, y, circleSize);
    fill(pixx);
    circle(x, y, circleSize/2);

    //code for the spiral:

    radius += frameCount / 3000;
    angle += 8;
    frameCount += 1;
    circleSize += 0.07;
    if (frameCount > 3000) {
        noLoop();
    }

    //border to cover where circles could not be drawn:

    fill("white");
    rect(0, 0, width, 20);
    rect(0, height - 20, width, height - 20);
    rect(0, 0, 20, height);
    rect(height - 20,0,  height, width- 20);

}

//my process for this was I wanted to include a spiral effect revealing the image
//I found that translating th spiral to the center effted where my pixel colors were being grabbed from
//I changed the spiral instead to start at 0, 0
//I ended up liking this effect better because it shows how the that top corner 
//is the brightest part. The spiral created a sun ray effect that looked cool
//I then wanted something else in the circled so I made donuts with the 
//inverted color in the center. This helped to bring some color to the top corner
//so it wasnt just all white.


Looking Outwards 9

For this week’s Looking Outwards I looked at Emily Gobeille. According to her website she is an “an award-winning designer” and is cofounder of  Design I/O “a creative studio specializing in the design and development of cutting-edge, immersive, interactive installations and new forms of storytelling”. I picked her to look into her because a friend of mine had suggested it would fit my interests. I am currently in a class about designing environments and toy design was something that got me into design in the first place. 

From her personal site I was then drawn to the Design I/O site to learn more about the projects she has worked on. I was drawn to the “Funky Forest” project done in the Singapore Art Museum, simply because I liked the visuals. Learning more, this project was a visual learning tool to show children how forest ecosystems work. The interactive display was through a projected system that reacted to the children’s movements and positioning of objects. I personally was inspired by this project because of the use of projected digital graphics to create an entire immersive and interactive environment, that both looked cool and provided a fun purpose. My favorite part of the project is when the kids kind of go crazy and are sending water all over the forest. I think Gobeille’s own sense of storytelling and imagination is reflected in the projects she works on.

http://zanyparade.com/

Looking Outwards 08

https://vimeo.com/channels/eyeo2019

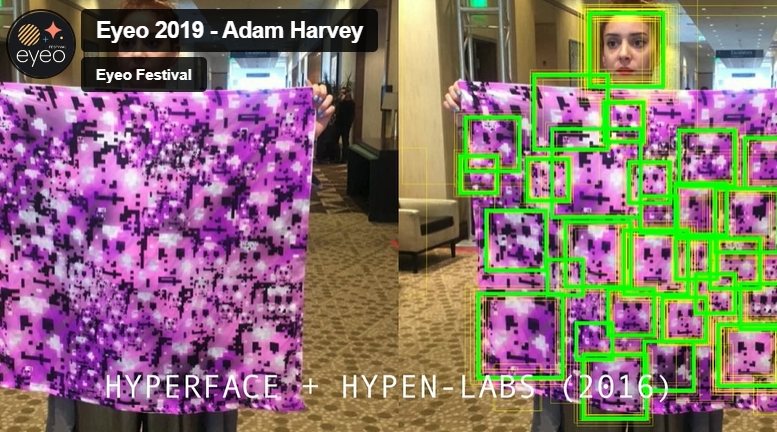
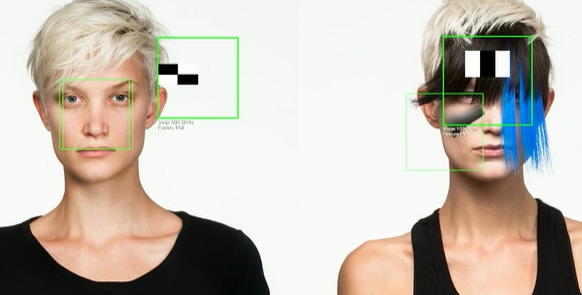
For my Looking Outwards this Week I looked at the 2019 Lecture of the eyeo Festival (The Speaker being Adam Harvey). His previous work includes CV Dazzle (camouflage from face detection) and the anti-drone Burqa (camouflage from thermal cameras). I was interested in his work because I personally find face recognition kind of creepy. Personally I don’t use it on my phone, and I was interested to learn more. Adam Harvey breaks the face recognition tools by deconstructing them, and makes art, by constructing visuals on top of faces to make them unrecognizable. I learned to admire this project more as he talked about how easy it is for someone to use visual surveillance to watch you. His project is a rebellion against military or corporate use of surveillance and their  abuse of face recognition.   

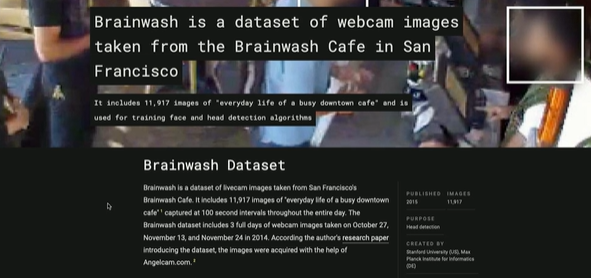
Where do people get their data sets of people’s faces to study? Are these methods ethical? 

This talk overall made me afraid for the future. I don’t want to get my face scanned and then analyzed and I’m sure other people don’t want to either. I would see surveillance through face recognition as a breach of my freedom. And if Microsoft included my face in a database I would not be exactly thrilled, even if I had just done something as simple as post to social media. 

I am inspired by this talk because of the use of art and coding to be able to fight back or find out more about a very prevalent problem that needs to gain more recognition.

07 Project

sketch
//Evette LaComb 
//section D 
//deliverable 7 project

var Cardioid= 0; // Astroid Inovulte oarametric 
var nPoints = 100; // points manipulted on the shape 


function setup() {
    frameRate(5);
    createCanvas(400, 400);
    background(220);
}

function draw() {
    background("lightBLue")
    // if mouse is above or below the monster backgrounf red:
    if (dist(width/2, mouseY, width/2, height/2) > 100) {
        background("red");
    } 
    //Draw the astroid monster
    fill("white"); 
    draw_cardioid(width/2, 150);
    }

    function draw_cardioid(x, y) {
        // transformations for esthetics
        push();
        translate(x, y);
        rotate(radians(90));
        // set variables
        var x;
        var y;
        //set esthetics
        stroke("red");
        fill("blue");
        //draw monster occording to the cardioid equations 
        beginShape();
    for (var i = 0; i < nPoints; i++) {
        var manipulate = mouseX/20;
        var t = map(i, 0, nPoints, 0, TWO_PI);
        var a = mouseX/8 +50;
        var p = random(mouseY/350, .5);
        var q = random(mouseY/350, .5);


        x = a *(1+ cos(t)) *(cos(t) * 1.5 * p);
        y = a *(1+ cos(t)) *(sin(t)* 1.5 *q);
        vertex(x, y);
        } 
        endShape(CLOSE);
        pop();
     
    }

Looking Outwards 07

For this week’s Looking Outwards, I looked at the works of Stephanie Posavec. I was intrigued by her works simply by the color visuals I saw when first opening up her website. Her goals are set around visualizing and communicating data in new ways. The project of hers I chose to focus on was Data Murmurations: Points in flight. This project visualized data samples, but connected them back to the people who actually donated samples. The title murmuration comes from a group of birds in the sky following a path. They converge and diverge in their journey. One thing lacking from Posavec’s description of her work is a description of the more technical tools she used to create her work. She uses sorting algorithms to sort all of her data and then visualize it, but I am not too sure about the specifics. I could assume there are some simple if statements about the data, such as if it is one thing it goes somewhere and if it is another it goes somewhere else.

Looking Outwards 06 

Randomness 

E

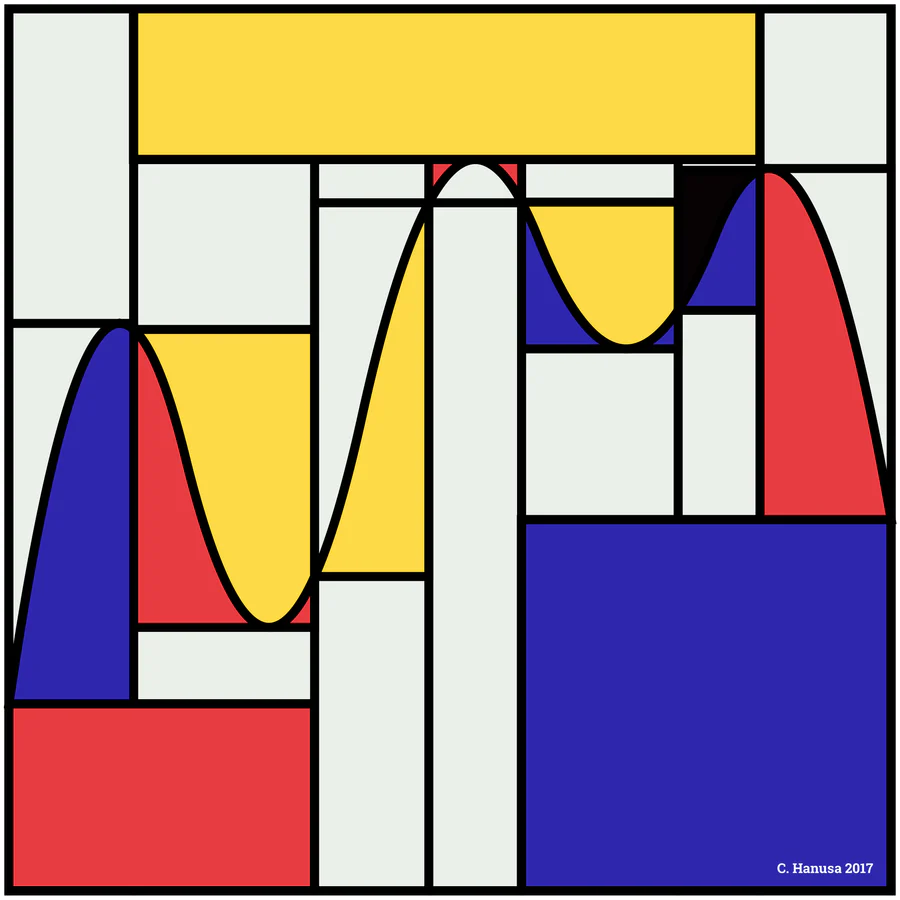
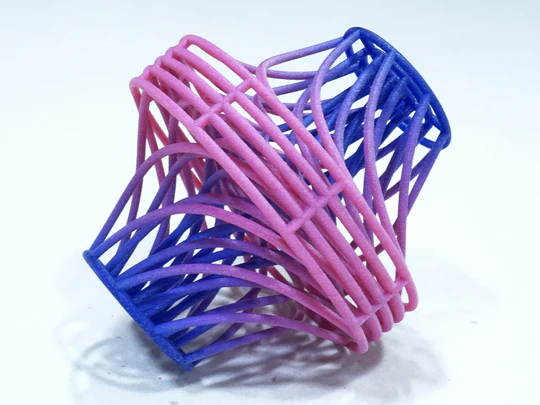
For this I look at art by Christopher Hanusa. Christopher Hanusa is not an artist, but a mathematician. He makes computational art using math and brings it to life with 3D printing. He first makes a model himself and uses computation to make variations. These variations might not be truly random due to the set parameters, but they do occur at random intervals. Personally, I like that although these forms are technically produced with sophisticated tech, he likes fun colors, and this has become one of his signatures. He doesn’t just use randomness because he knows how, but believes it says something beautiful about the nature of life, uniqueness, and chance. Although each is generated with random factors, he goes through many different variations and chooses his favorites. This interaction became an important fingerprint of the artist’s likes and esthetic ideas. I am very curious to know  if his other non-chosen models are just as  “perfect”. 

https://gallery1064.com/collections/christopher-hanusa-solo-show

Project 06

This is my duck clock

the amount of ducks corresponds to the 24 hours and they spin once a minute and blink once a second

sketch
//Evette LaComb 
//elacomb@andrew.cmu.edu
// Section D 
// Project 06 - Duck Clock 

    //Concept: grid of 5 x 5, 24 ducks, every hour a new duck swims onto screen. 
    //each duck rotates once a minute.
    //need a function to draw the ducks
    //need a loop for the ducks- where do they enter from, where do they go each hour
    //need a transformation to roate each duck around its center axis- part of function
// b for bubbles in water:
var b = [];
//angle of roatation:
var angleR = 0;
var direction = 1;
//starting array for x position of ducks; 
var stx = [0, 0, 0, 0, 0, 0, 0, 0, 0, 0, 0, 0, 0, 0, 0, 0, 0, 0, 0, 0, 0, 0, 0, 0];
//starting array for y position of ducks;
var sty = [200, 280, 200, 120, 280, 200, 120, 120, 280, 200, 120, 360, 40, 280, 40, 200, 360, 40, 280, 360, 360, 120, 40, 360];
//end position array for position of ducks;
var endx = [200, 120, 280, 200, 200, 120, 280, 120, 280, 40, 360, 200, 280, 40, 360, 360, 120, 200, 360, 40, 280, 40, 120, 360];
var speed = 1;

function setup() {
    createCanvas(400, 400);
    // object and Array for water texture: 
    for (i = 0; i < 1000; i ++) {
        b[i] = new Object();
        b[i].c = random(255);
        b[i].x = random(5, width-5);
        b[i].y = random(5, height-5);
        //speed that water moves: 
        b[i].dx = random(-0.1, 0.1);
        b[i].dy = random(-0.1, 0.1);
    }  
    frameRate(60);
}

function draw() {
    background("lightblue");
    var h = hour();
    //loops to create water texture
    for (i = 0; i <= 24; i ++) {
        bubble(b[i]);
        update_bubble(b[i]);
    }
    //loops t ocreate ducks corresponding to arrays 
    for (i = 0; i <= hour() - 1; i ++){
        duck(stx[i], sty[i]);
        stx[i] += speed;
        if(stx[i] >= endx[i]){ stx[i] = endx[i]};
    }
    //beach details:
    push();
    rotate(radians(-45));
    fill(255, 255, 255, 60);
    ellipse(0, 0, 320, 150);
    fill(200, 190, 160)
    ellipse(0, 0, 300, 130)
    pop();
    stroke(0);
    strokeWeight(2);
    //text('Current hour:\n' + h, 5, 50);
}


function duck(stx, sty){
//duck stuff: 
    //draw duck at coordinate x, y
    push();
    translate(stx, sty);
    //rotate the duck; 
    rotate(radians(angleR));
    angleR += 0.007;
    //cosmetics for duck:
    noStroke();
    fill("lightBlue");
    ellipse(0, 0, 80, 70);
    fill(230);
    ellipse(0, 0, 70, 60);
    fill(230);
    triangle(10, 30, 10, -30, 45, 0)
    fill("orange");
    ellipse(-25, 0, 30);
    fill("white");
    //stuff to make ducks blink according to seconds 
    ellipse(-10, 0, 40);
    var s = second();
    if (s % 2 == 0){
        fill("black");
    }else{
        fill("white");
    }
    ellipse(-15, 17, 5);
    ellipse(-15, -17, 5);
    pop();

}

function bubble(b){
//cosmetics of water texture:
    noFill();
    strokeWeight(10);
    stroke(255, 255, 255, 20)
    ellipse(b.x, b.y, 70, 70);
}

function update_bubble(b){
//tecnical stuff for water texture:
    //water movement:
    b.x += b.dx;
    b.y += b.dy;
    //if reach edge of screen change direction: 
    if ( b.x >= width || b.x < 0){
        b.dx = -b.dx;
    }

    if (b.y >= height || b.y < 0){
        b.dy = -b.dy;
    }
}

Looking Outwards-05 

Computer Graphics 

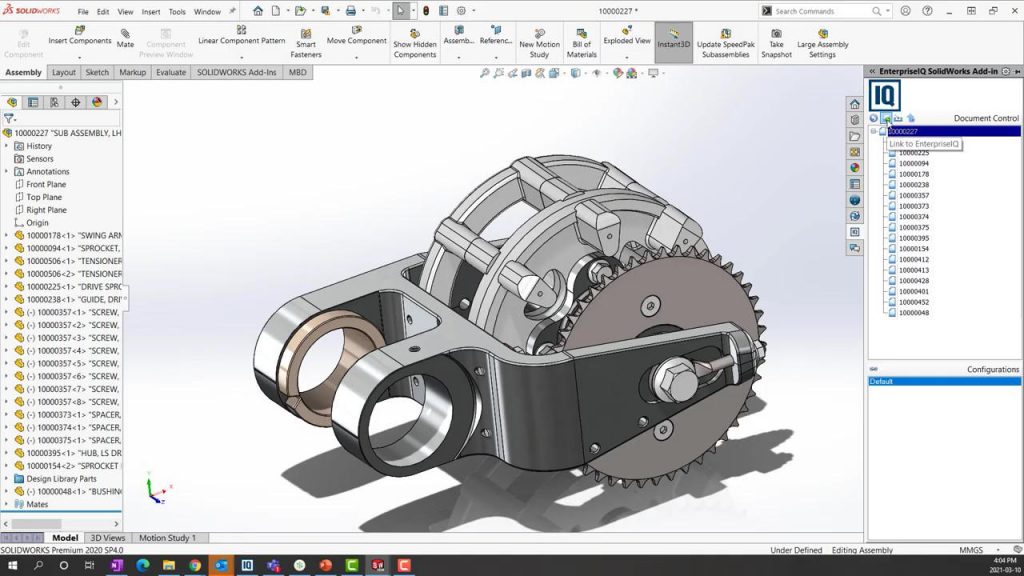
When I think about 3D computer graphics, as a designer I immediately think about Solidworks.

Solidworks is a CAD program that can be used to digitally design three dimensional things, and then render those things and produce drawings that may be helpful to the user.  

It’s hard to imagine this heavy complex program in terms of what we are doing in class, but I would assume there are a lot of simple math functions that need to be done to make the program work. I guess you could simplify Solidworks into an interactive visual processor. 

What I like most about Solidworks is its practicality and exactness. It is a very powerful tool that is fun to explore as a user. It also does a lot of math and measurements that might be difficult to impossible to do all by hand.

Wallpaper Project

sketch
//Evette LaComb 
//Section D 

var sect = 100; // section size 

function setup() {
    createCanvas(600, 600);
}

function draw() {
    background(225, 200, 165);
    for (var y = -50; y < height +60; y += 100){
        for (var x = 0; x < width +60; x += 100){
        flower(x, y);
        }
    }
    noLoop();
}


function flower(x, y){
    push();
    translate(x, y);

// boarder details 
    fill(110, 40, 10); //brown  
    noStroke();
    rect(0, 0, 7, sect);
    rect(sect -7, 0, 7, sect);
    noStroke();
    arc(100, 25, 25, 30, radians(90), radians(270), OPEN);
    strokeWeight(2);
    stroke(190, 80, 10); // orange 
    line (15, 0, 15, sect);
    strokeWeight(3);
    line (10, 0, 10, sect); 
    stroke(110, 40, 10); //brown 
    line(50, 90, 50, 150);

//vines 
    noStroke();
    noFill();
    strokeWeight(5);
    stroke(30, 70, 35); // dark green 
    arc(50, 0, 50, 50, radians(90), radians(180), OPEN);
    arc(50, 50, 50, 50, radians(270), radians(90), OPEN);
    arc(50, 100, 50, 50, radians(180), radians(360), OPEN);
    strokeWeight(4);
    arc(50, 100, 50, 25, radians(180), radians(25), OPEN);
    strokeWeight(2);
    arc(50, 100, 47, 37, radians(180), radians(360), OPEN);

//center dimond detail 
    push();
    fill(30, 70, 35); // dark green 
    translate(50, 50);
    rotate(radians(45));
    rectMode(CENTER);
    rect(0, 0, 27, 27);
    pop();
    fill(190, 80, 10); // orange 
    ellipse(50, 50, 27, 27);
    fill(225, 200, 165);
    ellipse(50, 50, 19, 19);

    pop();

}