Project 04: Diagonal Sine Curve

sketch

//Name: Hari Vardhan Sampath
//Section: E
// Diagonal Sine Curves

var numLines = 45; //number of strings drawn

function setup() {
    createCanvas(400, 300);
    background(0);

    // red strings
    line(0, 0, 10, 150);
    line(50, 200, 150, 150);

    dx1 = (10-0)/numLines;
    dy1 = (150-0)/numLines;
    dx2 = (150-50)/numLines;
    dy2 = (150-200)/numLines;

    // yellow strings
    line(250, 100, 150, 150);
    line(400, 300, 390, 150);

    dx3 = (150-250)/numLines;
    dy3 = (150-100)/numLines;
    dx4 = (390-400)/numLines;
    dy4 = (150-300)/numLines;

    // purple strings
    line(150, 250, 150, 150);
    line(400, 300, 250, 290);

    dx5 = (150-150)/numLines;
    dy5 = (150-250)/numLines;
    dx6 = (250-400)/numLines;
    dy6 = (290-300)/numLines;

    // blue strings
    line(100, 10, 0, 0);
    line(150, 150, 150, 50);

    dx7 = (0-100)/numLines;
    dy7 = (0-10)/numLines;
    dx8 = (150-150)/numLines;
    dy8 = (50-150)/numLines;
}

function draw() {
    // red strings
    var x1 = 0;
    var y1 = 0;
    var x2 = 50;
    var y2 = 200;
    for (var i = 0; i <= numLines; i += 1) {
        stroke(192, 57, 43);
        line(x1, y1, x2, y2);
        x1 += dx1;
        y1 += dy1;
        x2 += dx2;
        y2 += dy2;
    }
    // yellow strings
    var x3 = 250;
    var y3 = 100;
    var x4 = 400;
    var y4 = 300;
    for (var i = 0; i <= numLines; i += 1) {
        stroke(244, 208, 63);
        line(x3, y3, x4, y4);
        x3 += dx3;
        y3 += dy3;
        x4 += dx4;
        y4 += dy4;
    }
    // purple strings
    var x5 = 150;
    var y5 = 250;
    var x6 = 400;
    var y6 = 300;
    for (var i = 0; i <= numLines; i += 1) {
        stroke('purple');
        line(x5, y5, x6, y6);
        x5 += dx5;
        y5 += dy5;
        x6 += dx6;
        y6 += dy6;
    }
    var x7 = 100;
    var y7 = 10;
    var x8 = 150;
    var y8 = 150;
    for (var i = 0; i <= numLines; i += 1) {
        stroke(84, 153, 199);
        line(x7, y7, x8, y8);
        x7 += dx7;
        y7 += dy7;
        x8 += dx8;
        y8 += dy8;
    }

    noLoop();
}

In this project, I tried to explore the continuity of string art to form a sine curve, starting from the top left corner of the canvas until the diagonal bottom.

LO 04: VOLUME by SOFTlab, NY 2017

Volume, as described by the author is an interactive cube of responsive mirrors that redirect light and sound responsive to the surrounding movement. The installation commissioned by HP consists of a square grid of 100 mirrored panels with individually addressable LED lights sandwiched along the vertical sides. These panels are mounted on posts with rotating motors. The installation comes to life when the panels rotate and align to human movement, where the human becomes the attractor point for the mirrors to align and face. The sound transmission is also controlled tracing the attractor point and the light in turn react to the sound produced by the panels. This interconnected network of reactive movement and sound fills the atmosphere around the installation. To trace the human motion, array of depth camera is used and identify them as points. Much like the mouseX and mouseY used to locate the mouse pointer. The position tracking uses 6 Kinetic V2 cameras to identify blobs and depth image is retrieved using KineticPV2 library.

Volume UI from SOFTlab on Vimeo.

LO 03: Reverberating Across the Divide by Madeline Gannon

This project revolves around usage of real time context scanning as data input and converting it to physical objects through chronomorphologic modeling. The most interesting part is the integration of real time scanning, computational generative modelling, and rapid prototyping tools to realize the design.  The complexity of the object can be controlled using parameters in the computational modelling software which in turn provides control over the local as well as global model.

The final form reverberates the sensitivity between the context, computer generated model as well as the fabricated physical object, true to the title.  

Reverberating Across the Divide: Digital Design Meets Physical Context from Madeline Gannon on Vimeo.

Project 2: Variable Face

sketch

//Name: Hari Vardhan Sampath
//Section: E

var x = 80;
var y = 160;
var eyeSize = 50;
var faceWidth = 200;
var faceHeight = 300;
var backgroundColor = 180
var chinWidth = 15
var mouthHeight1 = 20
var mouthHeight2 = 20 
var noseHeight = 100

function setup() {
    createCanvas(480, 640);
}

function draw() {
    background(backgroundColor);

    // outline of face
    fill(210,180,140);
    beginShape();
    curveVertex(x*2, y);
    curveVertex(x*2, y);
    curveVertex(x, y*2);
    curveVertex(x*2 + chinWidth, y*3 + x/2);
    curveVertex(x*4 - chinWidth, y*3 + x/2);
    curveVertex(x*5, y*2);
    curveVertex(x*4, y);
    curveVertex(x*2, y);
    curveVertex(x*2, y);
    endShape();

    // mouth
    noFill();
    beginShape();
    vertex(x*2 + 30, y*3);
    bezierVertex(x*2 + 60, y*3 + mouthHeight1, 
        x*4 - 60, y*3 + mouthHeight2, x*4 - 30, y*3);
    endShape();

    // eyes
    fill(255,248,220);
    ellipse(x*2 + 10, y*2, eyeSize, eyeSize+5);
    ellipse(x*4 - 10, y*2, eyeSize, eyeSize+5);
    fill(0,0,0);
    ellipse(x*2 + 10, y*2, eyeSize/2, eyeSize/2);
    ellipse(x*4 - 10, y*2, eyeSize/2, eyeSize/2);

    // hair 
    fill(5,5,0);
    beginShape();
    curveVertex(x*2, y + x);
    curveVertex(x*2, y + x);
    curveVertex(x, y*2);
    curveVertex(x, y*2 - x);
    curveVertex(x*2, y - 15);
    curveVertex(x*4, y - 15);
    curveVertex(x*5, y*2 - 25);
    curveVertex(x*2, y + x);
    curveVertex(x*2, y + x)
    endShape();

    // nose
    fill(210,180,140);
    beginShape();
    curveVertex(x*3 - 30, y*2 + noseHeight - 20);
    curveVertex(x*3 - 30, y*2 + noseHeight - 20);
    curveVertex(x*3 - 30, y*2 + noseHeight - 10);
    curveVertex(x*3 - 15, y*2 + noseHeight - 15);
    curveVertex(x*3, y*2 + noseHeight);
    curveVertex(x*3 + 15, y*2 + noseHeight - 15);
    curveVertex(x*3 + 30, y*2 + noseHeight - 10);
    curveVertex(x*3 + 30, y*2 + noseHeight - 20);
    curveVertex(x*3 + 30, y*2 + noseHeight - 20);
    endShape();

}

function mousePressed() {
    // when the user clicks, these variables are reassigned
    // to random values within specified ranges. For example,
    // 'backgroundColor' gets a random value between 160 and 200.
    x = random(75, 95);
    y = random(150, 170);
    eyeSize = random(30, 70);
    backgroundColor = random(160, 200);
    chinWidth = random(0, 25);
    mouthHeight1 = random(-30, 40);
    noseHeight = randon(90, 110);
}

LO 02: Memo Akten – Circa 2018/2019

Memo Akten is a computational artist whose work revolve around converting data into speculative videos through generative design. One of his projects titled Cicra is a video essay that revolves around interconnectedness of algorithms and human existence in this world. Most of the generative artists work with video and sound to produce an atmosphere. The most I admire about Akten’s work is the storytelling along with the stitched snippets of videos which are algorithmically generated, which emphasizes the human-machine relationship.

Memo Akten is a computational artist whose work revolve around converting data into speculative video through generative design. One of his projects titled Cicra is a video essay that revolves around interconnections of algorithms and human existence in this world. Most of the generative artists work with video and sound to produce an atmosphere. The most I admire about Akten’s work is the storytelling along with the stitched snippets of videos which are algorithmically generated, which emphasizes the human-machine relationship.

A selection of (camera friendly) work in 4 minutes with voice-over (as of 2020) from Memo Akten on Vimeo.

Project 1: My Self Portrait

sketch
//name: Hari Vardhan Sampath
//classSection: E

function setup() {
    createCanvas(500, 500);
    background(0);
}

function draw() {
    
    fill(212, 38, 40);
    ellipse(250, 150, 160, 200);
    fill(150, 38, 40);
    ellipse(250, 160, 300, 100); //hat

    fill(251, 209, 1);
    ellipse(250, 250, 150, 200); //faceOutline

    strokeWeight(7);
    ellipse(220, 225, 50, 50);
    ellipse(280, 225, 50, 50);
    line(260, 220, 240, 220); //glasses
    
    strokeWeight(10);
    point(220, 220);
    strokeWeight(10);
    point(280, 220); //eyes
    
    strokeWeight(5);
    fill(255, 255, 255);
    arc(250, 300, 75, 30, 220, 330, CHORD)  //mouth

    strokeWeight(5);
    arc(250, 260, 5, 15, 200, 330) //nose

    noLoop();
}

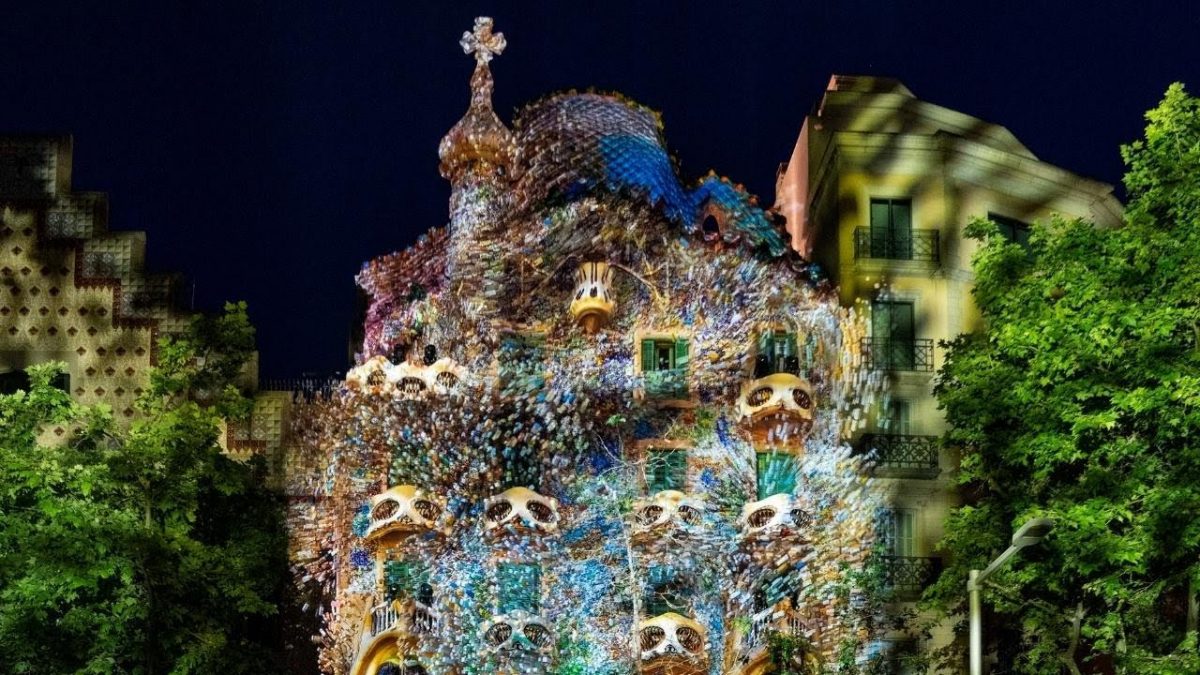
LO 01: Living Architecture: Casa Batlló

Refik Anadol’s ‘Living Architecture: Casa Batlló’
For a long time, works of Refik Anadol has inspired me and makes one think beyond the world of reality. The specific project developed by him named – Living Architecture: Casa Batlló, uses data collected from the environment around Casa Batlló, an architectural masterpiece designed by Antonio Gaudi in Barcelona, Spain. Usually, immersive art is projected to the walls within a building, but in this case the artwork I projected on the exterior, bringing life to the built environment. The artwork itself uses machine learning and Artificial intelligence to replicate the city’s mood by real-time data gathering such as climate or local festival.

In one of Refik’s projects named – Machine Hallucinations: Moma, he uses StyleGAN2 ADA to capture the machine’s hallucinations of modern art in multidimensional space. Looking forward towards the future, such techniques and technologies can provide advanced design synthesis in the field of architecture.

Links:
https://www.designboom.com/art/dynamic-nft-gaudi-casa-batllo-refik-anadol-christies-05-12-2022/
https://www.moma.org/magazine/articles/658
https://github.com/NVlabs/stylegan2-ada