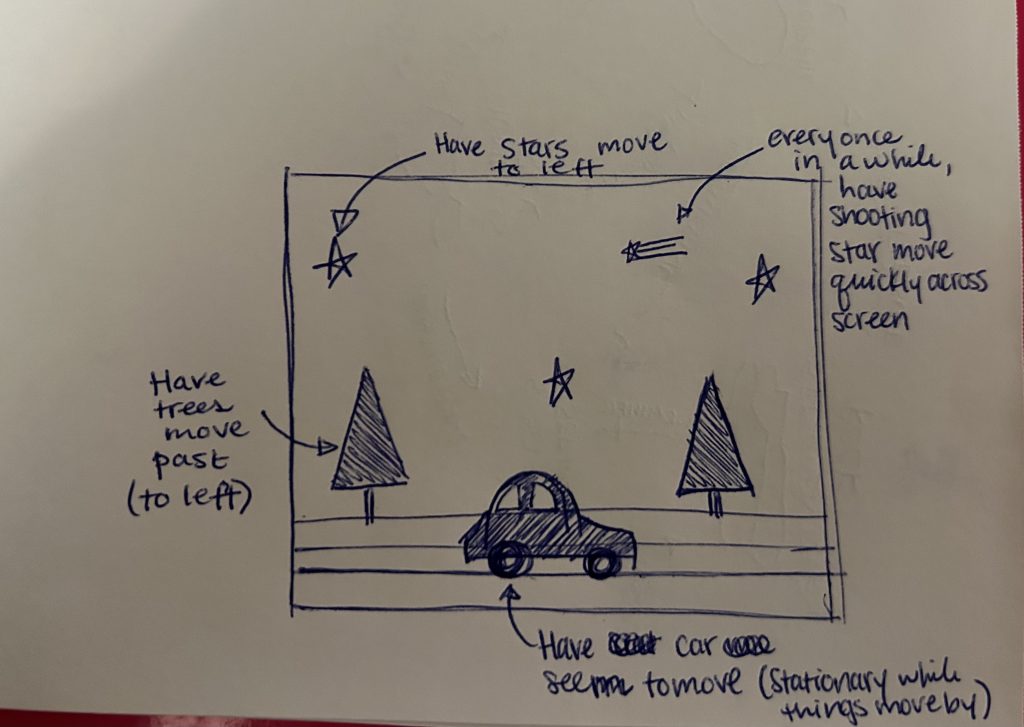
It was fun to figure out how to create a whole landscape without having to define absolutely everything and making it more interesting with randomness. I added a shooting star with a very small creation probability to create a little surprise within the landscape every once in a while.
// Rachel Legg / rlegg / Section C

//have trees and stars move by
//every once in a while, a surprising shooting star
//car in the middle (moving past trees)

var stars = [];
var trees = [];
var shootingStars = [];

var car;

function preload(){
    car = loadImage("https://i.imgur.com/C7SXV3W.png");
}

function setup() {
    createCanvas(450, 300);
    frameRate(10);

    //initial stars and trees
    for(var i = 0; i < 6; i++){
        var sx = random(width);
        stars[i] = makeStar(sx);
    }
    for(var i = 0; i < 10; i++){
        var sx = random(width);
        trees[i] = makeTree(sx);
    }
    //random shooting star
    for(var i = 0; i < 1; i++){
        var sx = random(width);
        shootingStars[i] = makeShootingStar(sx);
    }

}

function draw() {
    //sky - dark blue
    background(10, 52, 99);
    //ground
    fill("darkgreen");
    noStroke();
    rect(0, 240, 500, 75);
    //road
    fill("gray");
    rect(0, 260, 495, 10)

    updateAndDisplayStar();
    removeStarOutOfView();
    addNewStar();

    updateAndDisplayShootingStars();
    removeShootingStarOutOfView();
    addNewShootingStars();

    updateAndDisplayTree();
    removeTreeOutOfView();
    addNewTree();

    //car stays stationary as scenery moves by
    //drew out car in illustrator & uploaded to imgur
    image(car, width/2 - 60, 207, 165, 65);

}

//stars object
function makeStar(starLocationX){
    var star = {x : starLocationX,
                y : random(0, 170),
                starScale : random(0.1, 0.5),
                speed : -1,
                move : moveStar,
                display : displayStar}
        return star;
}

function displayStar(){
    push();
    translate(this.x, this.y);
    fill(255);
    noStroke();
    scale(this.starScale);
    beginShape();
    vertex(50, 18);
    vertex(61, 37);
    vertex(83, 43);
    vertex(69, 60);
    vertex(71, 82);
    vertex(50, 73);
    vertex(29, 82);
    vertex(31, 60);
    vertex(17, 43);
    vertex(39, 37);
    endShape();
    pop();
}

//update star positions and display
function updateAndDisplayStar(){
    for(var i = 0; i < stars.length; i++){
        stars[i].move();
        stars[i].display();
    }
}

function addNewStar(){
    var newStarProbability = 0.01;
    if (random(0, 1) < newStarProbability){
        stars.push(makeStar(width));
    }
}

function removeStarOutOfView (){
    //if star goes off left edge, remove from array
    var starsToKeep = [];
    for (var i = 0; i < stars.length; i++){
        if (stars[i].x + 50 > 0) {
            starsToKeep.push(stars[i]);
        }
    }
    //stars left
    stars = starsToKeep;
}

function moveStar(){
    this.x += this.speed;
}


//trees object
function makeTree(treeLocationX){
    var tree = {xt : treeLocationX,
                yt : 240,
                treeScale : random(0.1, 0.5),
                treeColor : color(0, random(75, 255), 0),
                speedT : -3,
                moveT : moveTree,
                displayT : displayTree}
    return tree;
}

function displayTree(){
    push();
    translate(this.xt + 60, this.yt); //add 60 so transitions onto screen
    fill(255);
    noStroke();
    scale(this.treeScale);

    //tree!
    noStroke();
    fill("brown");
    rect(0, 0, 10, -50);
    rect(1, 0, -10, -50);
    fill(this.treeColor);
    triangle(-60, -50, 60, -50, 0, -400);

    pop();
}

//update tree positions and display
function updateAndDisplayTree(){
    for(var i = 0; i < trees.length; i++){
        trees[i].moveT();
        trees[i].displayT();
    }
}

function addNewTree(){
    var newTreeProbability = 0.04;
    if (random(0, 1) < newTreeProbability){
        trees.push(makeTree(width));
    }
}

function removeTreeOutOfView (){
    //if star goes off left edge, remove from array
    var treesToKeep = [];
    for (var i = 0; i < trees.length; i++){
        if (trees[i].xt + 100 > 0) {
            treesToKeep.push(trees[i]);
        }
    }
    //trees left
    trees = treesToKeep;
}

function moveTree(){
    this.xt += this.speedT;
}


//shooting star object
function makeShootingStar(locationX){
    var shootingStar = {xs : locationX,
                ys : random(75, 125),
                shootingStarScale : random(0.1, 0.3),
                speedS : -8,
                moveS : moveShootingStar,
                displayS : displayShootingStar}
    return shootingStar;
}

function displayShootingStar(){
    push();
    translate(this.xs + 60, this.ys); //add 60 so transitions onto screen
    fill("yellow");
    noStroke();
    scale(this.shootingStarScale);

    //shooting star
    beginShape();
    vertex(50, 18);
    vertex(61, 37);
    vertex(83, 43);
    vertex(69, 60);
    vertex(71, 82);
    vertex(50, 73);
    vertex(29, 82);
    vertex(31, 60);
    vertex(17, 43);
    vertex(39, 37);
    endShape();

    stroke("yellow");
    strokeWeight(2);
    line(60, 37, 100, 37);
    line(60, 47, 110, 47);
    line(60, 57, 120, 57);

    pop();
}

//update tree positions and display
function updateAndDisplayShootingStars(){
    for(var i = 0; i < shootingStars.length; i++){
        shootingStars[i].moveS();
        shootingStars[i].displayS();
    }
}

function addNewShootingStars(){
    var newShootingStarsProbability = 0.008;
    if (random(0, 1) < newShootingStarsProbability){
        shootingStars.push(makeShootingStar(width));
    }
}

function removeShootingStarOutOfView (){
    //if star goes off left edge, remove from array
    var shootingStarsToKeep = [];
    for (var i = 0; i < shootingStars.length; i++){
        if (shootingStars[i].xs + 100 > 0) {
            shootingStarsToKeep.push(shootingStars[i]);
        }
    }
    //trees left
    shootingStars = shootingStarsToKeep;
}

function moveShootingStar(){
    this.xs += this.speedS;
}
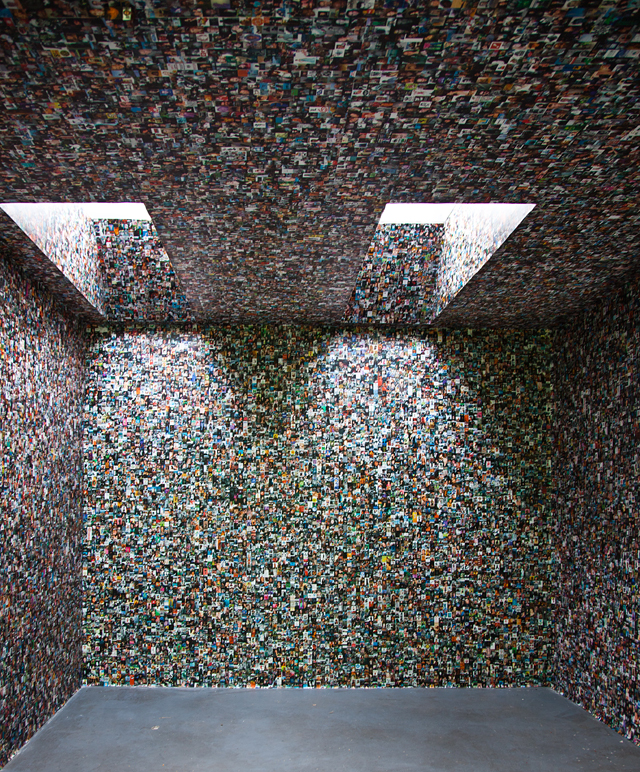
The article “6 Art Projects Prying thre Lid Off Online Privacy” discusses the blurring of private versus public on the internet. We don’t realize how much of our data and information is shared without us even knowing. We use digital applications and services that are “free”, when in reality, data is the currency of social media. Who actually reads the fine print and understands what they are agreeing to? Many artists have explored this space in connection to identity, privacy, and data collection. One of the art pieces shared in this article was “fbFaces” by Joern Roeder and Jonathan Pirnay. Roeder and Pirnay used a crawler to search and find public profiles and collect images, facebook IDs, and names. They then pixelated these images, reflecting that they are no longer people, but a whole data network of information that people no longer have control over. This work fosters awareness of how data can be used and what this mean for privacy and identity.
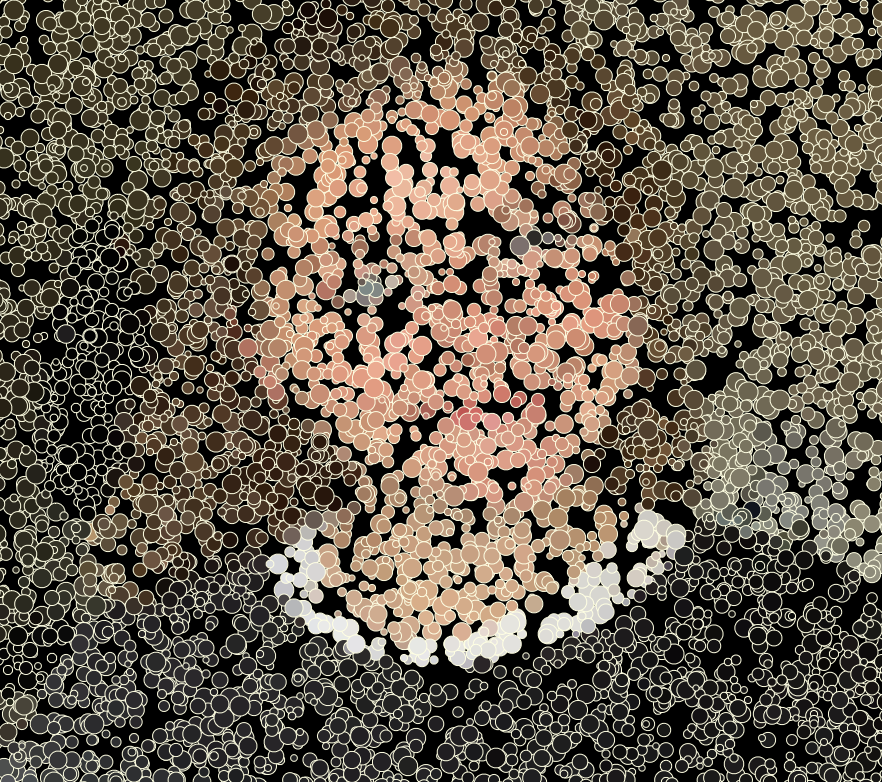
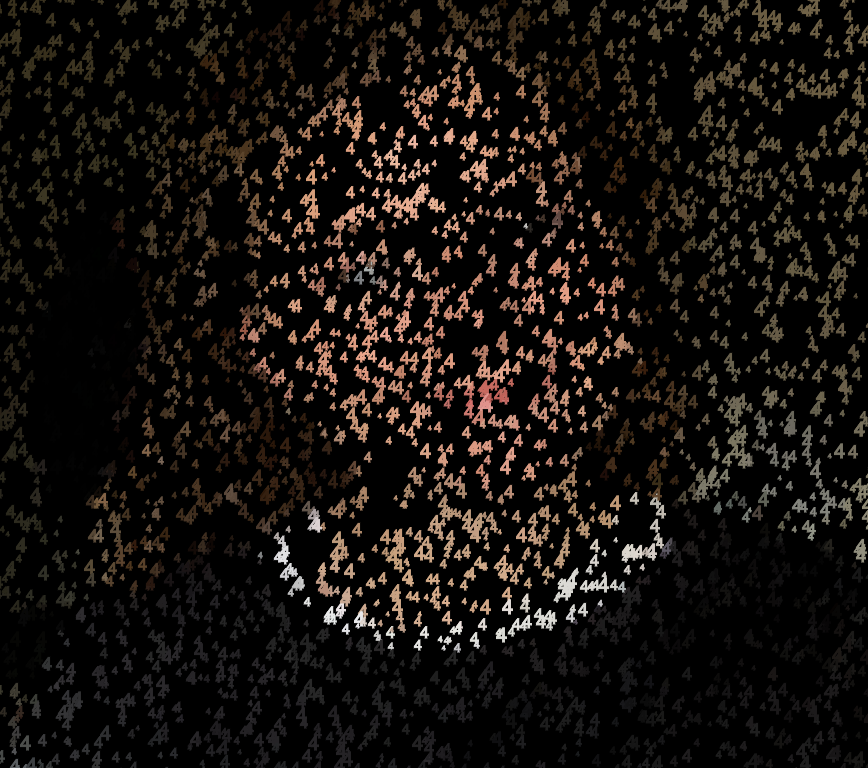
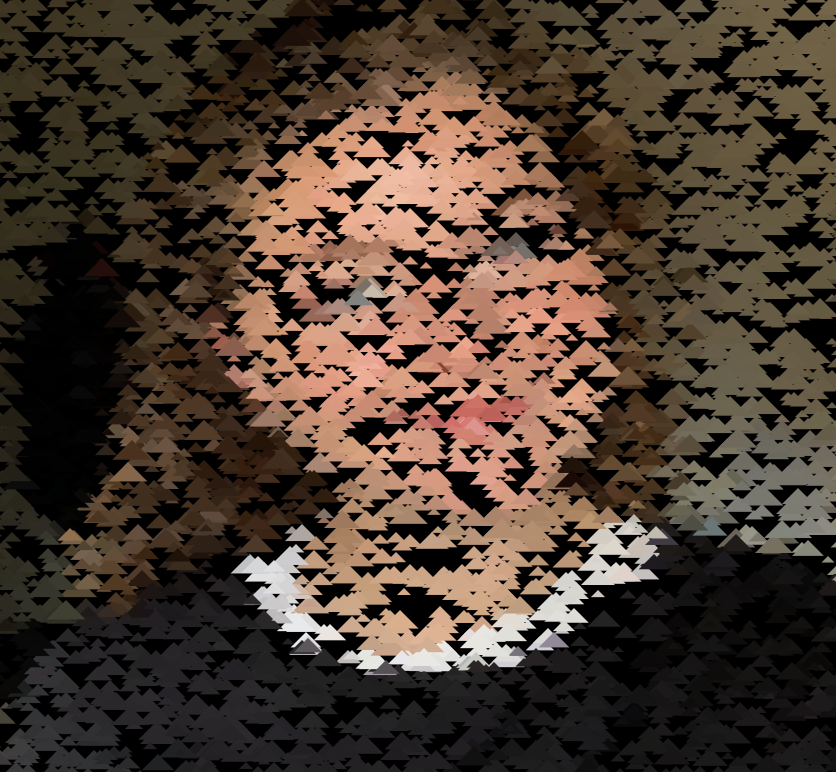
This was pretty fun to think of different ways to create a portrait. Going off the pointillism idea, I tried to think of different shapes that could be used and experiment. I decided to use mousePressed() to restart with new shapes. I feel they all came out pretty interesting and all the shapes relate to each other differently.
Circles4sTriangles
//Rachel Legg / rlegg / Section C

var img;
var option = 1;

//load image
function preload(){
    //photo of me
    img = loadImage("https://i.imgur.com/wtr45Lt.jpg");
}

function setup() {
    createCanvas(450, 400);
    background(0);
    img.resize(width, height);
    img.loadPixels();
    //fast frame rate
    frameRate(500);
}

function draw() {

    //have random x & y for portrait
    var x = floor(random(0, 450));
    var y = floor(random(0, 400));
    //use color from pixel
    var color = img.get(x, y);
    //smaller shapes leads to more detail
    var s = random(3, 10);

    // #4 is used for each pixel
    if (option == 1){
        //have shape pop as pixels
        fill(color);
        //outline of light-colored stroke
        stroke("lightyellow");
        strokeWeight(.5);
        stroke(color);
        textSize(s);
        text("4", x, y);

    //switch 4 to circle option w/ mousePressed
    } else if (option == 2){
        //have shape pop as pixels
        fill(color);
        //outline of light-colored stroke
        stroke("lightyellow");
        strokeWeight(.5);
        circle(x, y, s);

    //switch circle to triangle option w/ mousePressed
    } else if (option == 3){
        //have shape pop as pixels
        fill(color);
        noStroke();
        strokeWeight(.5);
        triangle(x, y, x - s, y + s, x + s, y + s);
    }

}

function mousePressed(){
    option++;
    if(option > 3){
        option = 1;
    }
    background(0);
}
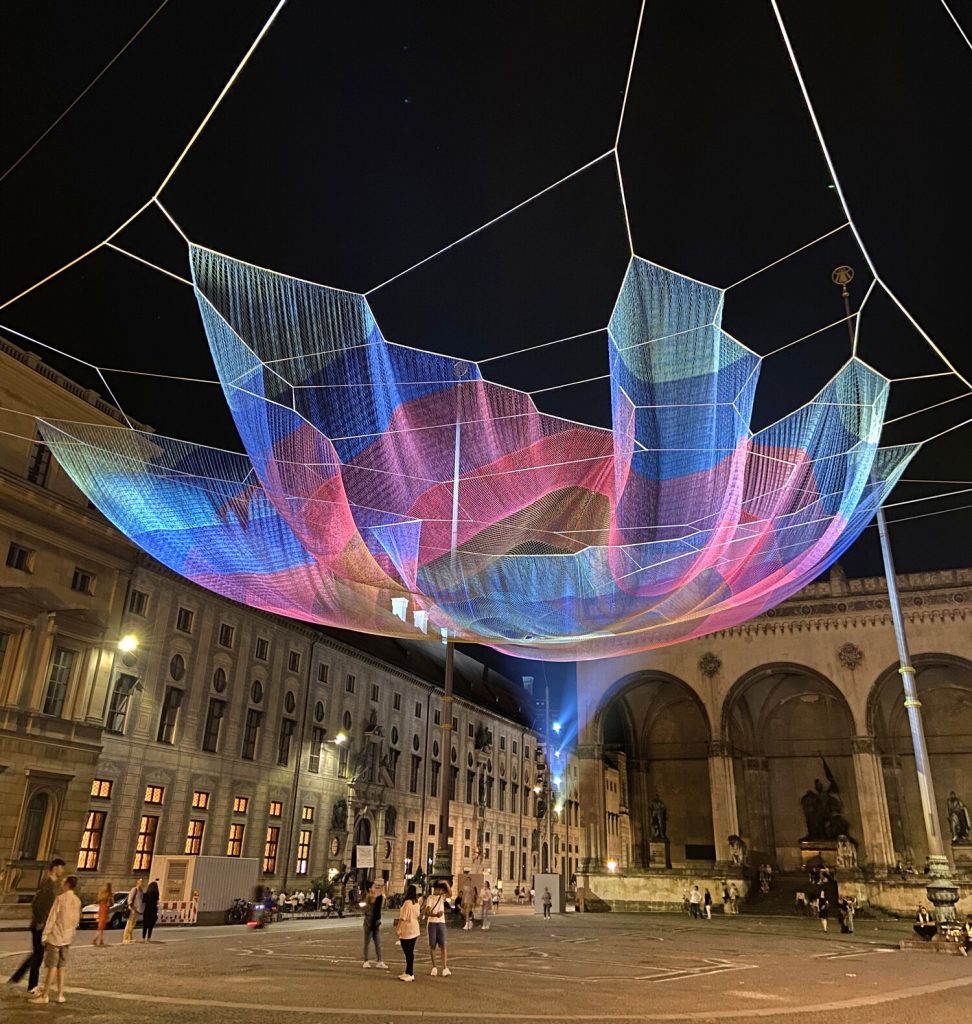
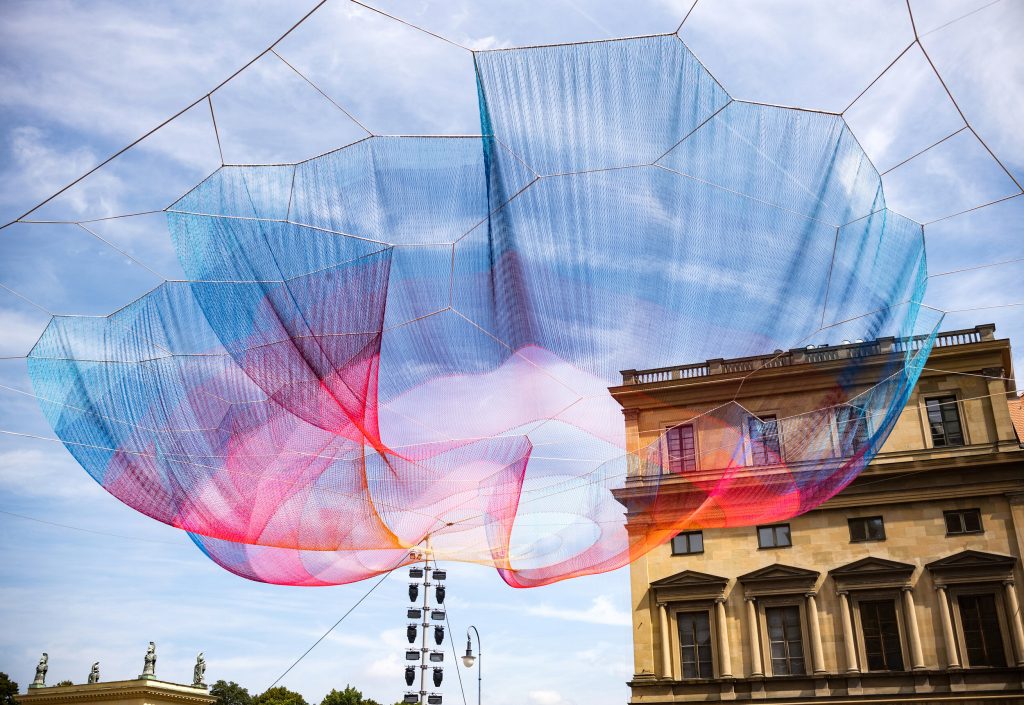
Earthtime 1.26 at nightEarthtime 1.26 during the day
Janet Echelman creates artwork that brings together sculpture, architecture, urban design, engineering, computer science, and material science. She scales her sculptures to buildings and calls viewers to reflects on their experience and the relationships between our world’s many scales. She combines ancient craft with computer science to achieve her style. Earthtime 1.26 Munich invites viewers to consider the interconnectedness to each other and our planet, and become more aware of our sensory experience. One of many sculptures, this installation has been installed in 15 cities around the world. This physical form was first digitally modeled based on data collected that describes an earthquake in Chile in 2010 that created ripple effects and led to the earth’s daily rotation speeding up. Earth’s days shortened by 1.26 seconds. Made up of fibers, the installation hangs from buildings and is illuminated by many lights. This sculpture has over 361,728 knots! I really admire how interdisciplinary Echelman’s work is, along with the beautiful, colorful aesthetic. Her work completely transforms spaces and changes your perspective on your relationship to the rest of the world.
Refik Anadol is a Turkish media artist based in LA that creates huge environmental art pieces driven by data. He operates Refik Anadol Studio and RAS LAB which both focus on “discovering and developing trailblazing approaches to data narratives and artificial intelligence”. He has a background in fine art. As an aspiring environmental and experience designer, I really loved being able to see how his work embodies the environments that they are in and connected to. A lot of his pieces are public art which adds another fun layer of defining space and giving people a new experience. He is able to take both architecture and open space and embed more meaning using data. For example, he created an installation in Boston that took data of the ocean breeze to visualize the connection of the city to the sea. Some of his other work utilizes invisible signals like LTE and bluetooth within spaces to create data visualizations and again visualize parts of those spaces that otherwise wouldn’t be seen or recognized. That is so cool! Another amazing project he shared was called “Archive Dreaming” in which archives turned into a data driven, visual experience. The computer almost becomes a living thing that processes your request and shares history in a new, beautiful way. Upon watching Anadol’s presentation, his imagery and videos in general were very successful in capturing your attention, but I also enjoyed how he integrated humor and light-heartedness into his talk, especially when talking about his past and moving forward with his work in cutting edge technology.
I connected mouseX and mouseY to the mapping of t to visualize the continuous movement of the curves and the larger shapes they create. It is interesting as you can watch it wind itself, giving a Spirograph effect. I then connected mouseX to a of the ranunculoid which affects the scaling from left to right. It is interesting how both x and y on the canvas determines the complexity of the shapes created. I also had fun experimenting with the different ways the shapes could be shown and decided to have the hypocycloid made of small squares.
// Rachel Legg / rlegg / Section C

//# of point of each shape
var nPoints = 150;

function setup() {
    createCanvas(480, 480);
    frameRate(10);
}

function draw() {
    //draw the ranunculoid & astroid curve
    background(0, 38, 38);    //dark green-blue
    fill(255);
    push();
    translate(width/2, height/2);
    fill(121, 33, 250);        //purple
    drawRanunculoid();
    noFill();
    drawHypocycloid();
    scale(1/12);
    fill(105, 20, 235);        //darker purple
    drawRanunculoid();
    pop();

}

function drawRanunculoid() {
    //Ranunculoid : https://mathworld.wolfram.com/Ranunculoid.html

    var x;
    var y;

    var a = 30;

    stroke(149, 198, 35);      //green
    strokeWeight(1);
    beginShape();
    for(var i = 0; i < nPoints; i++) {
        //map points to mouseX & mouseY for continuous flow
        var t = map(i, 0, nPoints, mouseX, mouseY);
        a += mouseX / 500;                    //scale when mouseX changes

        //adjust to 7 to increase petals to 6
        x = (a * (7 * cos(t) - cos(7 * t)));
        y = (a * (7 * sin(t) - sin(7 * t)));
        vertex(x, y);                           //vertex gets spinograph effect
        //line(x - 5, y - 5, 10, 10);           //visually different. shows lines to center

    }
    endShape(CLOSE);
}

function drawHypocycloid() {
    //https://mathworld.wolfram.com/Hypocycloid.html

    var x;
    var y;


    var a = 110;
    var b = 30;

    noFill();
    stroke(212, 223, 158);     //light green
    strokeWeight(1);
    for(var i = 0; i < nPoints; i++){
        //map points to mouseX & mouseY for continuous change
        var t = map(i, 0, nPoints, mouseX, mouseY);

        x = ((a - b) * cos(t)) - (b * cos(t * ((a - b) / b)));
        y = ((a - b) * sin(t)) - (b * sin(t * ((a - b) / b)));
        //rectangle shapes to show patterns
        rect(x - 5, y - 5, 10, 10);
    }
}
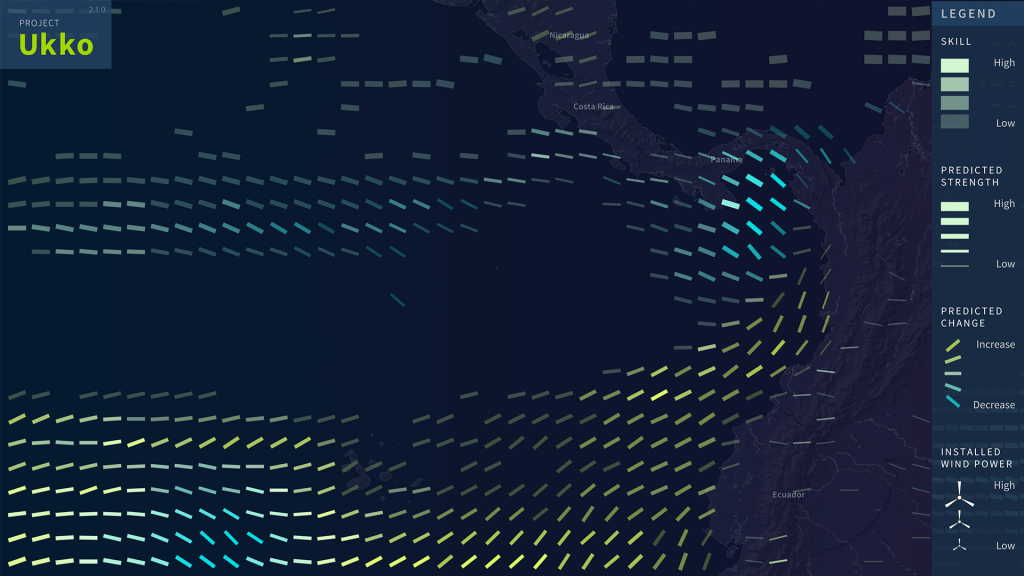
Project Ukko visualizes wind patterns and helps predict future patterns, creating a tool for clean wind energy industry and the fight against climate change.
Project Ukko visualizes and helps predict future wind patterns which can be helpful in clean energy endeavors in the wind farm industry. Moritz Stefaner, a designer and researcher who focuses on data visualization, encoded prediction skills into visuals in Project Ukko to make this data accessible to others. Opacity represents precision accuracy, wind strength connects to line thickness, and trends of wind speed change with line tilt and color. The color, visual language, and design is really well done and very user-centered, making it easy for anyone to begin understanding and deciphering patterns. I appreciate that this gives experts a practical tool, along with sharing new techniques into how to share data. This browser allows people to interact and find out how the wind will change over the next few months. I really admire this project because it makes information more accessible to people, along with considering how code can be used in the fight against climate change.
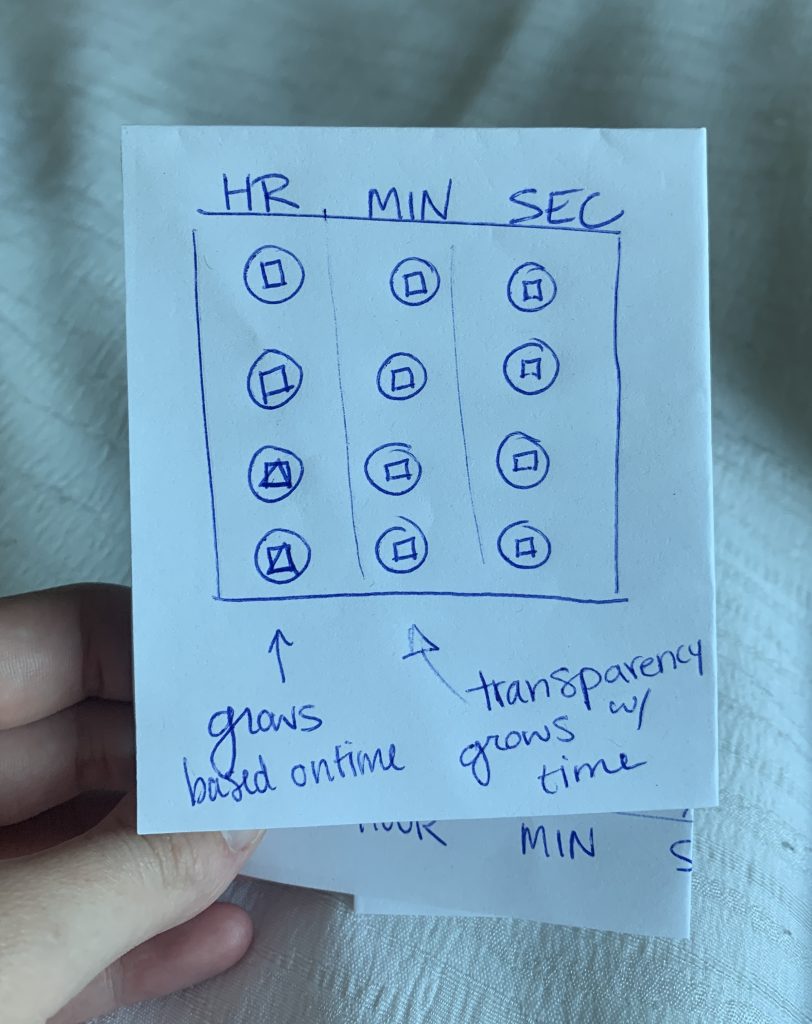
For my abstract clock, I was having a creative block and had trouble approaching what to make. I thought since most of my other projects have been pretty literal, I would make this one more abstract with a focus on shapes and how they can change based on hours, minutes, and seconds. I was thinking about how time is focused around growing, until it restarts and how that concept could be reflected into my clock. I decided to have “bubbles” that represent hours, minutes, and seconds organized in columns. I wanted these bubbles to slowly grow based on each of the timings. I also made it so the bubble slowly goes from transparent to opaque as seconds, minutes, and hours increase. Originally, I was thinking I wanted a shape inside the bubbles that would turn based on the time, but decided on a line to draw a better connection to a clock. I gave each bubble a line in the center that rotates based on the timing.
//Rachel Legg / rlegg / section C

var col;

function setup() {
    createCanvas(480, 480);
}

function draw() {
    //background color changes every hour
    background(0);
    frameRate(15);

    //variables for time
    var sec = second();
    var min = minute();
    var hr = hour();

    strokeWeight(2);

    //Have Bubbles expand with each increment
    //line on each bubble to mimic a clock based on hr, min, sec
    //Hr Row
    for(col = 0; col <= 3/4 * height; col += 120){
        //have hr be yellow
        fill(255, 255, 0, 30 + hr);                  //have opacity grow with time
        stroke(255, 255, 0);
        ellipse(width/6, height/8 + col, 2 * hr);
        //have line in center that moves with change in hr
        push();
        translate(width/6, height/8 + col);
        rotate(radians(-90 + (hr * 15)));                     // 360/24 = 15
        line(0, 0, 10, 10);
        pop();
    }


    //Min Row
    for(col = 0; col <= 3/4 * height; col += 120){
        //have min be pink
        fill(255, 0, 255, 30 + min);                 //have opacity grow with time
        stroke(255, 0, 255);
        ellipse(width/2, height/8 + col, 2 * min);
        //have line in center that moves with change in min
        push();
        translate(width/2, height/8 + col);
        rotate(radians(-90 + (min * 6)));                    // 360/60 = 6
        line(0, 0, 10, 10);
        pop();
    }

    //Sec Row
    for(col = 0; col <= 3/4 * height; col += 120){
        //have sec be blue
        fill(0, 255, 255, 30 + sec);                 //have opacity grow with time
        stroke(0, 255, 255);
        ellipse(5/6 * width, height/8 + col, 2 * sec);
        //have line in center that moves with change in sec
        push();
        translate(5/6 * width, height/8 + col);
        rotate(radians(-90 + (sec * 6)));                   // 360/60 = 6
        line(0, 0, 10, 10);
        pop();
    }

}
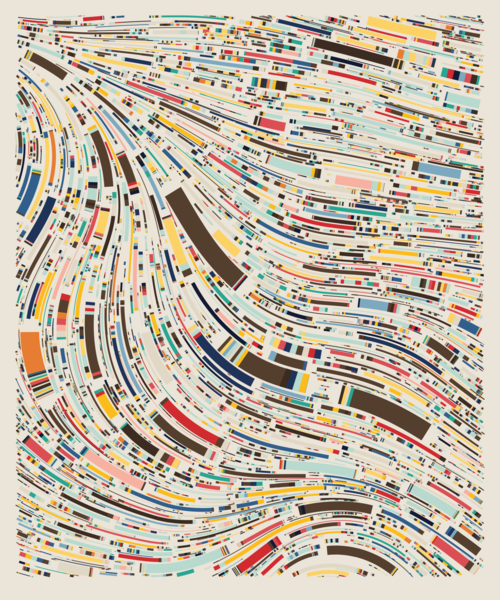
Tyler Hobbs is a visual artist who develops and works with algorithms and plotters. Hobbs’ style represents the stiff structure of a computer and the messy chaos of nature, striking an interesting balance in his work. He created “Fidenza” which is a generative algorithm that creates random, generative art. He describes the algorithm as “highly flexible”, and it continuously produces interesting results. It was so fun to scroll through all the artwork produced by the same algorithm as they all go very different directions, yet hold similar underlying charcteristics. “Fidenza” is a flow field algorithm that creates random, organic curves. With these curves, Hobbs shares that there is variety in scale, turbulence, stroke style, shape segments, sharp edges, sprials, collision, margins, and color which leads to infite possibilties of “Fidenza”. In color palettes alone, there are 14 possible color palettes that each have different probabilities for the colors being used.
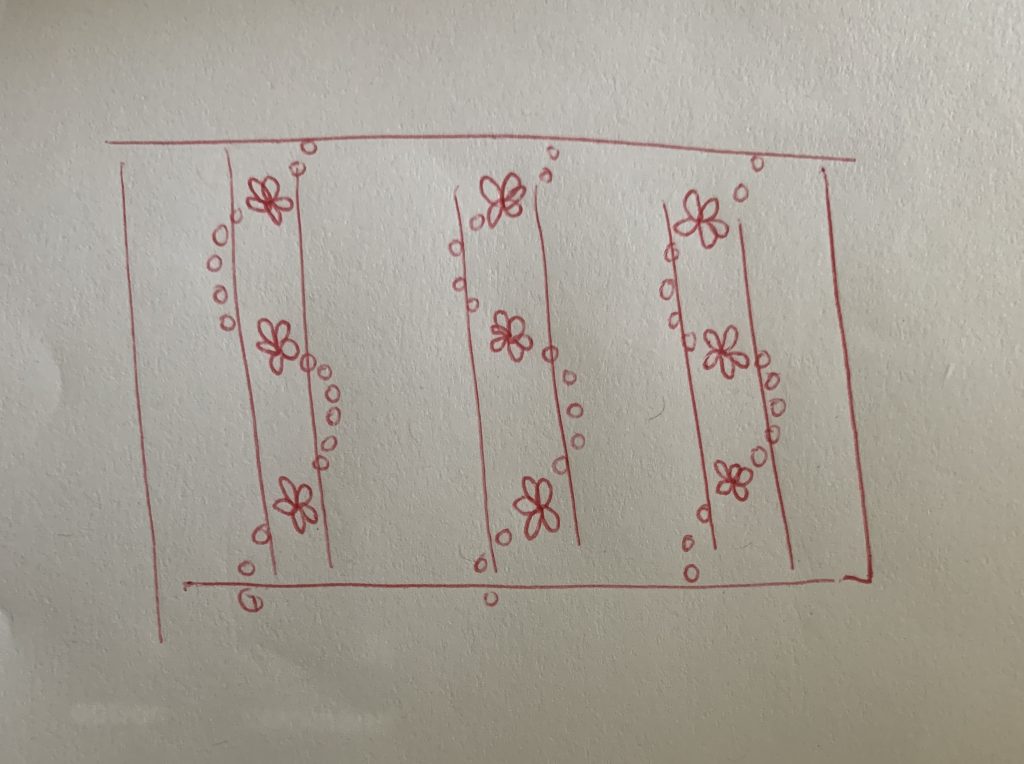
For making my wallpaper, I first drew the sketch below where I wanted there to be a striped background, flowers, and a curving dotted line behind the flowers that would connect them vertically. Once I achieved this, I adjusted some things like making the flowers have more layers and, instead of one stripe behind each flower column, I decided I liked many stripes better.
![[OLD SEMESTER] 15-104 • Introduction to Computing for Creative Practice](https://courses.ideate.cmu.edu/15-104/f2022/wp-content/uploads/2023/09/stop-banner.png)