var sonia;
var smallPoint, largePoint;
function preload() {
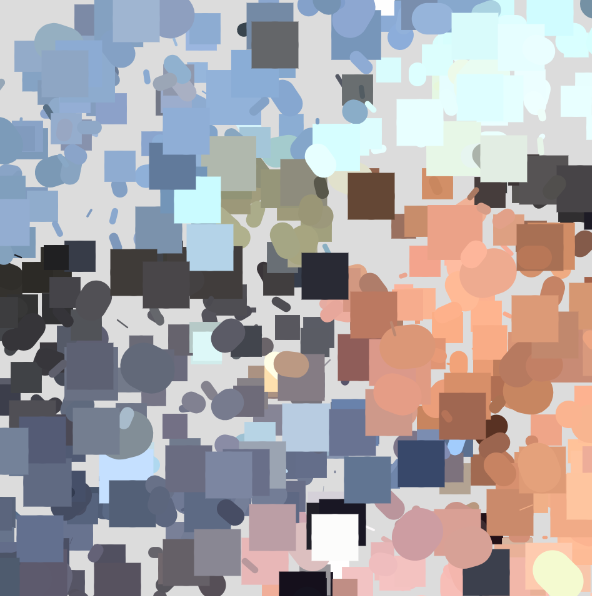
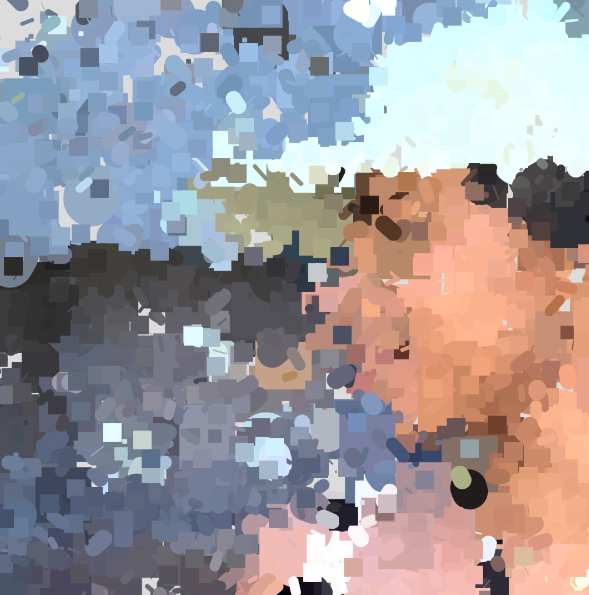
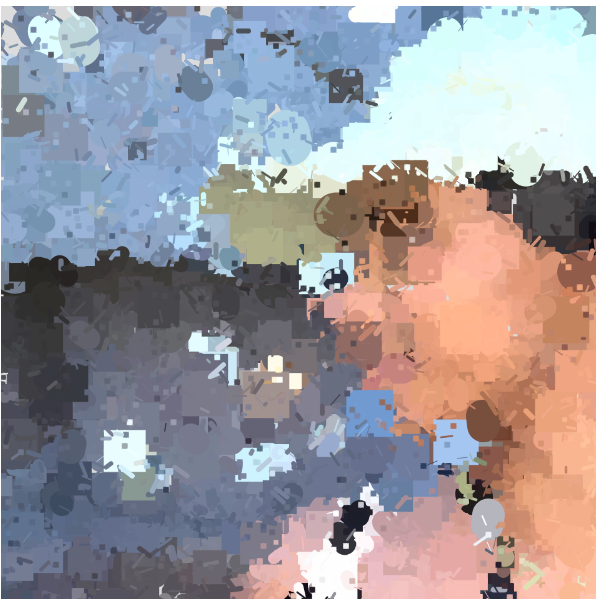
sonia = loadImage("https://i.imgur.com/3h0u1wQ.jpeg");
}
function setup() {
createCanvas(480, 480);
//creating variables for the smallPoint size and the largePoint size
smallPoint = 4;
largePoint = 20;
noStroke();
background(220);
rectMode(CENTER)
}
function draw() {
//created 6 x and y variables to hold different sizes of widths and heights based on the corresponding variable
var x1 = floor(random(sonia.width));
var y1 = floor(random(sonia.height));
//-10 and +10 so that it would always draw a shorter line, so when I used get, it would get a color closer to the point.
var x2 = floor(random(x1 - 10, x1 + 10));
var y2 = floor(random(y1 -10, y1 + 10));
var x = floor(random(sonia.width));
var y = floor(random(sonia.height));
var lineLength = ((y2 - y1) / (x2 - x1)) / 10;
createMultipleLines(x1,y1, x2,y2);
createMultipleRectangles(x,y);
createMultiplePoints(x,y);
}
function createMultipleLines(x1, y1, x2, y2) {
var pointillize = map(mouseX, 0, width, smallPoint, largePoint);
//gets color
var pix = sonia.get(x1,y1);
var pix1 = sonia.get(x2,y2);
stroke(pix);
//random strokeWeight
strokeWeight(random(0.1, pointillize));
line(x1,y1,x2,y2);
}
function createMultipleRectangles(x,y) {
//creates multiple rectangles using same method
var pointillize = map(mouseX, 0, width, smallPoint, largePoint);
print(sonia.width);
print(sonia.height)
var pix = sonia.get(x,y);
fill(pix);
noStroke();
rect(x,y, pointillize, pointillize);
}
function createMultiplePoints(x,y) {
//creates multiple circular points using same method.
var pointillize = map(mouseX, 0, width, smallPoint, largePoint);
print(sonia.width);
print(sonia.height)
var pix = sonia.get(x,y);
fill(pix);
noStroke();
ellipse(x,y, pointillize, pointillize);
}
// function createTinyLines(x1,y1,x2,y2, lineLength) {
// var pointillize = map(mouseX, 0, width, smallPoint, largePoint);
// for (var i = 0; i< lineLength; i ++) {
// var pix = sonia.get(x1,y1);
// var pix1 = sonia.get(x2,y2);
// stroke(pix);
// line(x1,y1,x2,y2);
// var slopeY = y2 - y1;
// var slopeX = x2 - x1;
// x1 = x2;
// y1 = y2;
// x2 += slopeX;
// y2 += slopeY;
// }
// }
// function createOneLine(x1,y1,x2,y2, lineLength) {
// //var pointillize = map(mouseX, 0, width, smallPoint, largePoint);
// var pix = sonia.get(x1,y1);
// var pix1 = sonia.get(x2,y2);
// stroke(pix);
// for (var i = 0; i< 20; i ++) {
// line(x1,y1,x2,y2);
// var slopeY = y2 - y1;
// var slopeX = x2 - x1;
// x1 == x2;
// y1 == y2;
// x2 += slopeX;
// y2 += slopeY;
// }
// }
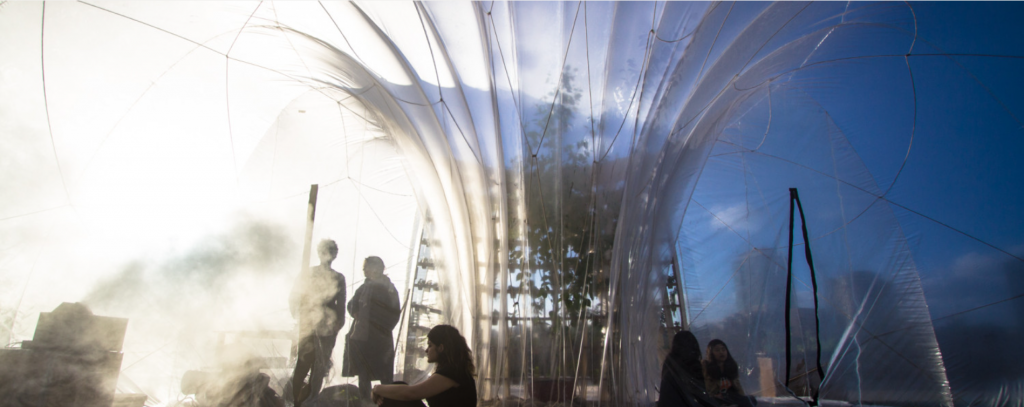
The Horticultural Spa is a spa for plants and people. It is part greenhouse and part “pneumatic bubble”. The purpose it to create a place for people to breathe and connect. I chose Rachel Wingfield as she has experience with large-scale architecture which is something I am also interested in. In this space, she transforms this public garden in order to tell her story about water scarcity and how innovative technologies can start to be redeveloped to reduce consumption. Meditative practices are also used in the spa and certain soundtracks generate music as well. I like how she tries to merge biological and technological futures through her work especially at an urban scale.
Deray Mckesson and Samuel Sinyangwe start their talk talking about police violence. Before Twitter, no one was really aware of the police violence in America, and even if they were aware, there was lack of information as to where the police violence was happening as well as how the police were targeting certain individuals. These graphs and collective information wasn’t available to the public and when Twitter came out, certain protesters including Deray Mckesson and Samuel Sinyangwe started to use this to this platform to their advantage and answer these questions using “crowd – sourced” data. They start talking about how there is a strategy to convince people there’s a crisis is different than the strategy to solve the crisis. There is also a difference between being awoke and staying awoke. They called that the Prepared to Win. I admire their awareness on the issue and how they continue trying to fight for what they believe in. Their short quotes begin to help me understand the issue at a small scale but begin to understand what they are really trying to say.
For this project, if you move your mouse left and right it changes the size of the left and right petals. If you move your mouse up and down it changes the size of the rose curve and the top and bottom inner petals.
//num of lines(rose) & size for bifoliate
var nPoints = 100;


function setup() {
    createCanvas(400, 400);
    frameRate(50);
    background(220);
}

function draw() {
    background(0);

    push();
    //moves origin to center of canvas
    translate(width/2, height/2);
    //inner petals
    draw4BifoliateCurve();
    //outer curves
    drawRoseCurve();
    pop();
}

//creating one singular bifoliate curve
function drawBifoliateCurve() {
    var x;
    var y;
    var r;

    //conforming a (which controls the size of the bifoliate) to mouseX
    var a = constrain(mouseX - 200, -100, 100);
    //opaque purple
    fill(200, 162, 230, 100);
    noStroke();
    beginShape();
    for (var i = 0; i < nPoints; i++) {
            //remap i from 0 to 2PI to create theta
            var t = map(i, 0, nPoints, 0, TWO_PI);
            //bifoliate equation
            r = ((8*cos(t) * (sin(t)**2))/(3 + cos(4*t))) * (a);
            print("Value" + a);

            x = r * cos(t);
            y = r * sin(t);
            vertex(x,y);
    }
    endShape(CLOSE);

}

//creating one bifoliate curve in y-direction
function drawmouseYbifoliateCurve() {
    var x;
    var y;
    var r;

    var a = constrain(mouseY-200, -120, 120);

    fill(200, 162, 200, 100);
    noStroke();
    beginShape();
    for (var i = 0; i < nPoints; i++) {
            //remap i from 0 to 2PI to create theta
            var t = map(i, 0, nPoints, 0, TWO_PI);
            //bifoliate equation
            r = ((8*cos(t) * (sin(t)**2))/(3 + cos(4*t))) * (a);
            //print("Value" + a);

            //change from polar to x and y
            x = r * cos(t);
            y = r * sin(t);
            vertex(x,y);
    }
    endShape(CLOSE);

}

//creating 4 Curves (Outer/Inner Petals)
function draw4BifoliateCurve() {
    push();
    //2 Petals (Top and Bottom)
    rotate(PI/5);
    drawmouseYbifoliateCurve();
    rotate(PI)
    drawmouseYbifoliateCurve();
    pop();
    //2 Petals (Left and Right)
    drawBifoliateCurve();
    push();
    rotate(PI);
    drawBifoliateCurve();
    pop();
}

//draws rose curve
function drawRoseCurve() {
    var x;
    var y;
    var r;
    var a = 1500;
    //mouse Y controls how many lines
    var n = constrain(mouseY/20, 0, 400/20);

    stroke(255, 255, 255, 150);
    strokeWeight(0.5);
    noFill();
    beginShape();
    for (var i = 0; i < nPoints; i++) {
            //remap i from 0 to 2PI to create theta
            var t = map(i, 0, nPoints, 0, TWO_PI);

            //rose equation
            r = a*sin(n*t);

            //change from polar to x and y
            x = r * cos(t);
            y = r * sin(t);
            vertex(x,y);
    }
    endShape();

}
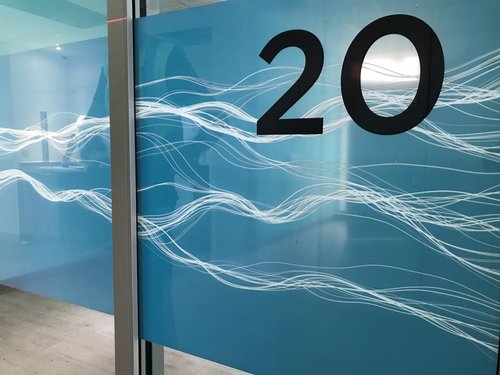
Stefanie Posavec created art at the Papworth Hospital, which was an Inpatients Ward. She was commissioned to create artwork that considered the human body and was human-scaled. Most importantly, she wanted it to be calming to patients who had just come out of surgery. I admire her work as she chose to show important computational information through understanding of the heartbeat, breath and lungs, and the blood and blood vessels that connect the two. Then, by incorporating “calming” nature she focused on aesthetics which showed waveforms (which is shown in ocean waves and heartbeats), branching (which is shown in the lungs and trees) etc. This ended up fulfilling the needs of both the patients and the staff as if offered patient privacy as well as a clear line – of-sight for nurses and staff. It was also really cool how she mapped data to concept showing how “medical data relevant to either the heart, lungs, or blood” was used as a ‘seed’ for that floor’s specific artwork.
John Cage had this exhibition in Cambridge. He was known for his different kinds of music and his 1952 composition in which his music was so random. He also used randomness in his hard and it determined his entire exhibition from which stones were chosen to what would be painted around the stones. He also used computer generated coordinates to determine the heights and positions of the pictures while also using a random process to add and remove different pieces during the exhibition as well!
This is important because it starts talking about how certain artists can afford to give up control so he uses computation as a way to make “no mistakes”. Everything has a purpose even if its randomness.
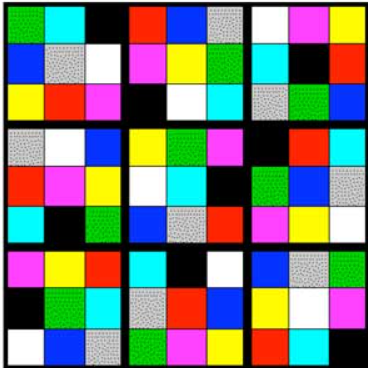
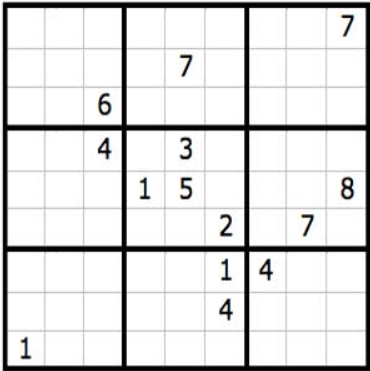
Sometimes randomization also came from solutions. This stained glass window was actually created as a solution to a Sudoku puzzle. So, broken down by row and column, it’s solutions defined the color and types of the stained window.
For this project, the inner circle represents every second, the outer circle shows the seconds turning to minutes, the different colored rays of the “sun” show the different minutes, and the pink background shows the number of hours in the day!
function setup() {
    createCanvas(350, 350);
    background(173, 216, 230);
}

function draw() {
    background(173, 216, 230);
    hoursBackground();
    minutesCircle();
    secondsCircle();
}

function hoursBackground() { //creates pink rectangles every hour
    push();
    for(var i = 0; i < hour(); i++) {
        strokeWeight(0.1);
        fill(243, 196, 207);
        rect(0,0, width/24, height);
        translate(width/24,0);
    }
    pop();
}

function minutesCircle() { //every minute, a new ray appears coming out of the inner circle
    push();
    strokeWeight(11);
    translate(width/2, height/2);
    for (var i = 0; i < minute(); i ++) {
        angleMode(DEGREES);
        if(i % 2 == 0) { //if i mod 2 is 0, then a short yellow line is drawn
            stroke(253, 253, 150, 200);
            line(0,0, 0, -100);
            rotate(6);
        }else{ // else a long orange line is drawn
            stroke(255, 179, 71, 200);
            line(0,0, 0, -125);
            rotate(6);
        }
    }
    pop();
}

function secondsCircle() {
        fill(173, 216, 230); //creates inner blue circle
        strokeWeight(0.1);
        circle(width/2, height/2, 40);

        strokeWeight(10); //creates outer white circle that counts 60 seconds in a minute
        stroke(255);
        noFill();
        arc(width/2, height/2, 250, 250, 270, 270 + second()*6);

        strokeWeight(1); // creates inner circle that visually shows every second
        fill(255);
        arc(width/2, height/2, 30, 30, 270, 270 + millis()*0.36);
}
function setup() {
    createCanvas(400, 390);
    background(0);
}

function draw() {
    rotateGrid(-50,0); //rotate's final grid
}

function drawTriangleOne(x,y) { //draws Triangle 1
    strokeWeight(0.1);
    fill(150); //Triangle 1
    triangle(x, y, x + 50, y, x + 25, y + (sqrt(1875))/2);
    fill(80)
    triangle(x + 50, y, x + 25, y + sqrt(1875), x + 25, y + (sqrt(1875))/2);
    fill(230)
    triangle(0, 0, x + 25, y + (sqrt(1875))/2, x + 25, y + sqrt(1875));
}

function drawTriangleTwo(x,y) { //draws Triangle 2
    fill(200); //Triangle 2
    triangle(x + 50, y, x + 25, y + (sqrt(1875)), x + 50, y + (sqrt(1875))/2);
    fill(150);
    triangle(x + 50, y, x + 50, y + (sqrt(1875))/2, x + 75, y + sqrt(1875));
    fill(80);
    triangle(x + 25, y + (sqrt(1875)), x + 50, y + (sqrt(1875))/2, x + 75, y + sqrt(1875));
}

function drawFlipTriangleOne(x,y) { //Draws Triangle 3
    push();
    translate(-25, sqrt(1875));
    drawTriangleTwo(x,y);
    pop();
}

function drawFlipTriangleTwo(x,y) { //Draws Triangle 4
    push();
    translate(25, sqrt(1875));
    drawTriangleOne(x,y);
    pop();
}

function drawSingleRowTriangles(x,y) { //Draws First Row of Triangles
    for (var i = 0; i < 8; i++) {
        drawTriangleOne(x,y);
        drawTriangleTwo(x,y);
        translate(50,0);
    }

}

function drawFourStartingTriangles(x,y) { //Groups First Four Starting Triangles
    for (var i = 0; i < 9; i++) {
        drawTriangleOne(x,y);
        drawTriangleTwo(x,y);
        drawFlipTriangleOne(x,y);
        drawFlipTriangleTwo(x,y);
    }
}

function drawTwoRowTriangles(x,y) { //Draws First 2 Rows of Triangles
    push();
    for (var i = 0; i < 11; i++) {
        drawFourStartingTriangles(x,y);
        translate(50,0);
    }
    drawTriangleOne(x,y);
    drawFlipTriangleOne(x,y);
    pop();
}

function drawTriangleGrid(x,y) { //Uses for loops to create entire Triangle Grid
    push();
    for (var i = 0; i < 6; i++) {
        drawTwoRowTriangles(x,y);
        translate(0, 2*sqrt(1875));
    }
    drawSingleRowTriangles(x,y);
    drawTriangleOne(x,y);
    drawTriangleTwo(x,y);
    pop();
}

function rotateGrid(x,y) {
    angleMode(DEGREES);
    rotate(30);
    translate(0,-200);
    drawTriangleGrid(x,y);
}
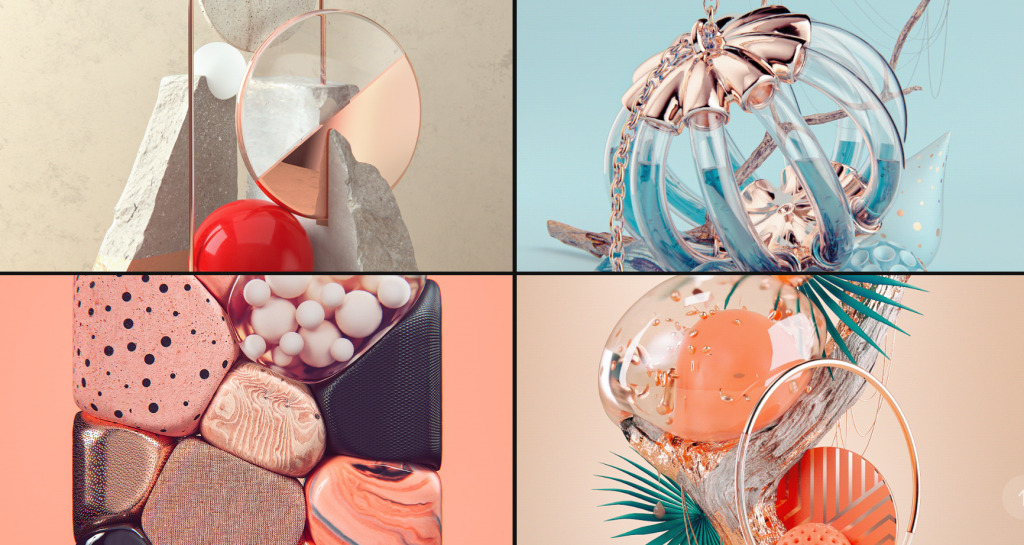
Roman Bratschi is the owner and creative director of his 3D designs made in Switzerland. He is also an experienced animation director, and has experienced his career as a graphic designer. His work is inspired by natural shapes, forms, and patterns. His techniques are expert in exposing their natural simplicity in the final piece. One thing I enjoy about his work is how all of his work reminds me of MacBook Wallpaper. Also, I love how organic some of his work is. Some of them resemble fruits and other vegetables, but they all have the same theme.
Sole is an artificial sun by Quiet Ensemble. The purpose of this project is to create a 360 degree video – mapping to simulate the movement of the sun around the inside of a space. Their project used the space of the Salone degli Incanti in Trieste.
Using artificial shadows and lights, the user is able to experience an unreal simulation of a space at any real or unreal context showing imaginary as well as possible paths, “broadening our horizons”. I like the combination between light and technology in order to make a replication of possibilities or non-possibilities.
![[OLD SEMESTER] 15-104 • Introduction to Computing for Creative Practice](https://courses.ideate.cmu.edu/15-104/f2022/wp-content/uploads/2023/09/stop-banner.png)