Cool Cloud by Team Peter: Final Documentation
The Intro to Physical Computing final project is to build a device that will help an older friend in way that is unique and specific to them; for us that person was Peter. As he lives in the penthouse of his apartment, the wind gusts on his balcony are really strong. This has caused him to have to tie down all the furniture out there as well as make sure that it is safe enough to go out there. When he babysits his granddaughter, she isn’t allowed on the balcony because it may be unsafe for her. Because of this, we decided to build him a personalized display of the wind speeds on his balcony. For more information about our meeting with him, check more on our process wordpress, and read on to learn more about our final work.
What We Built
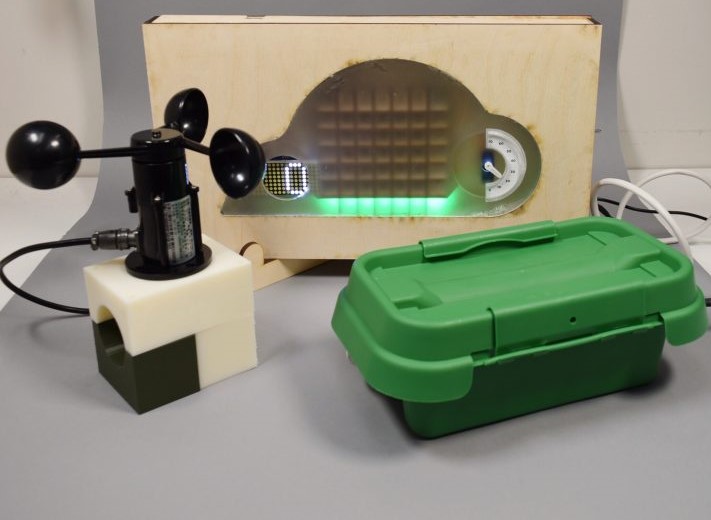
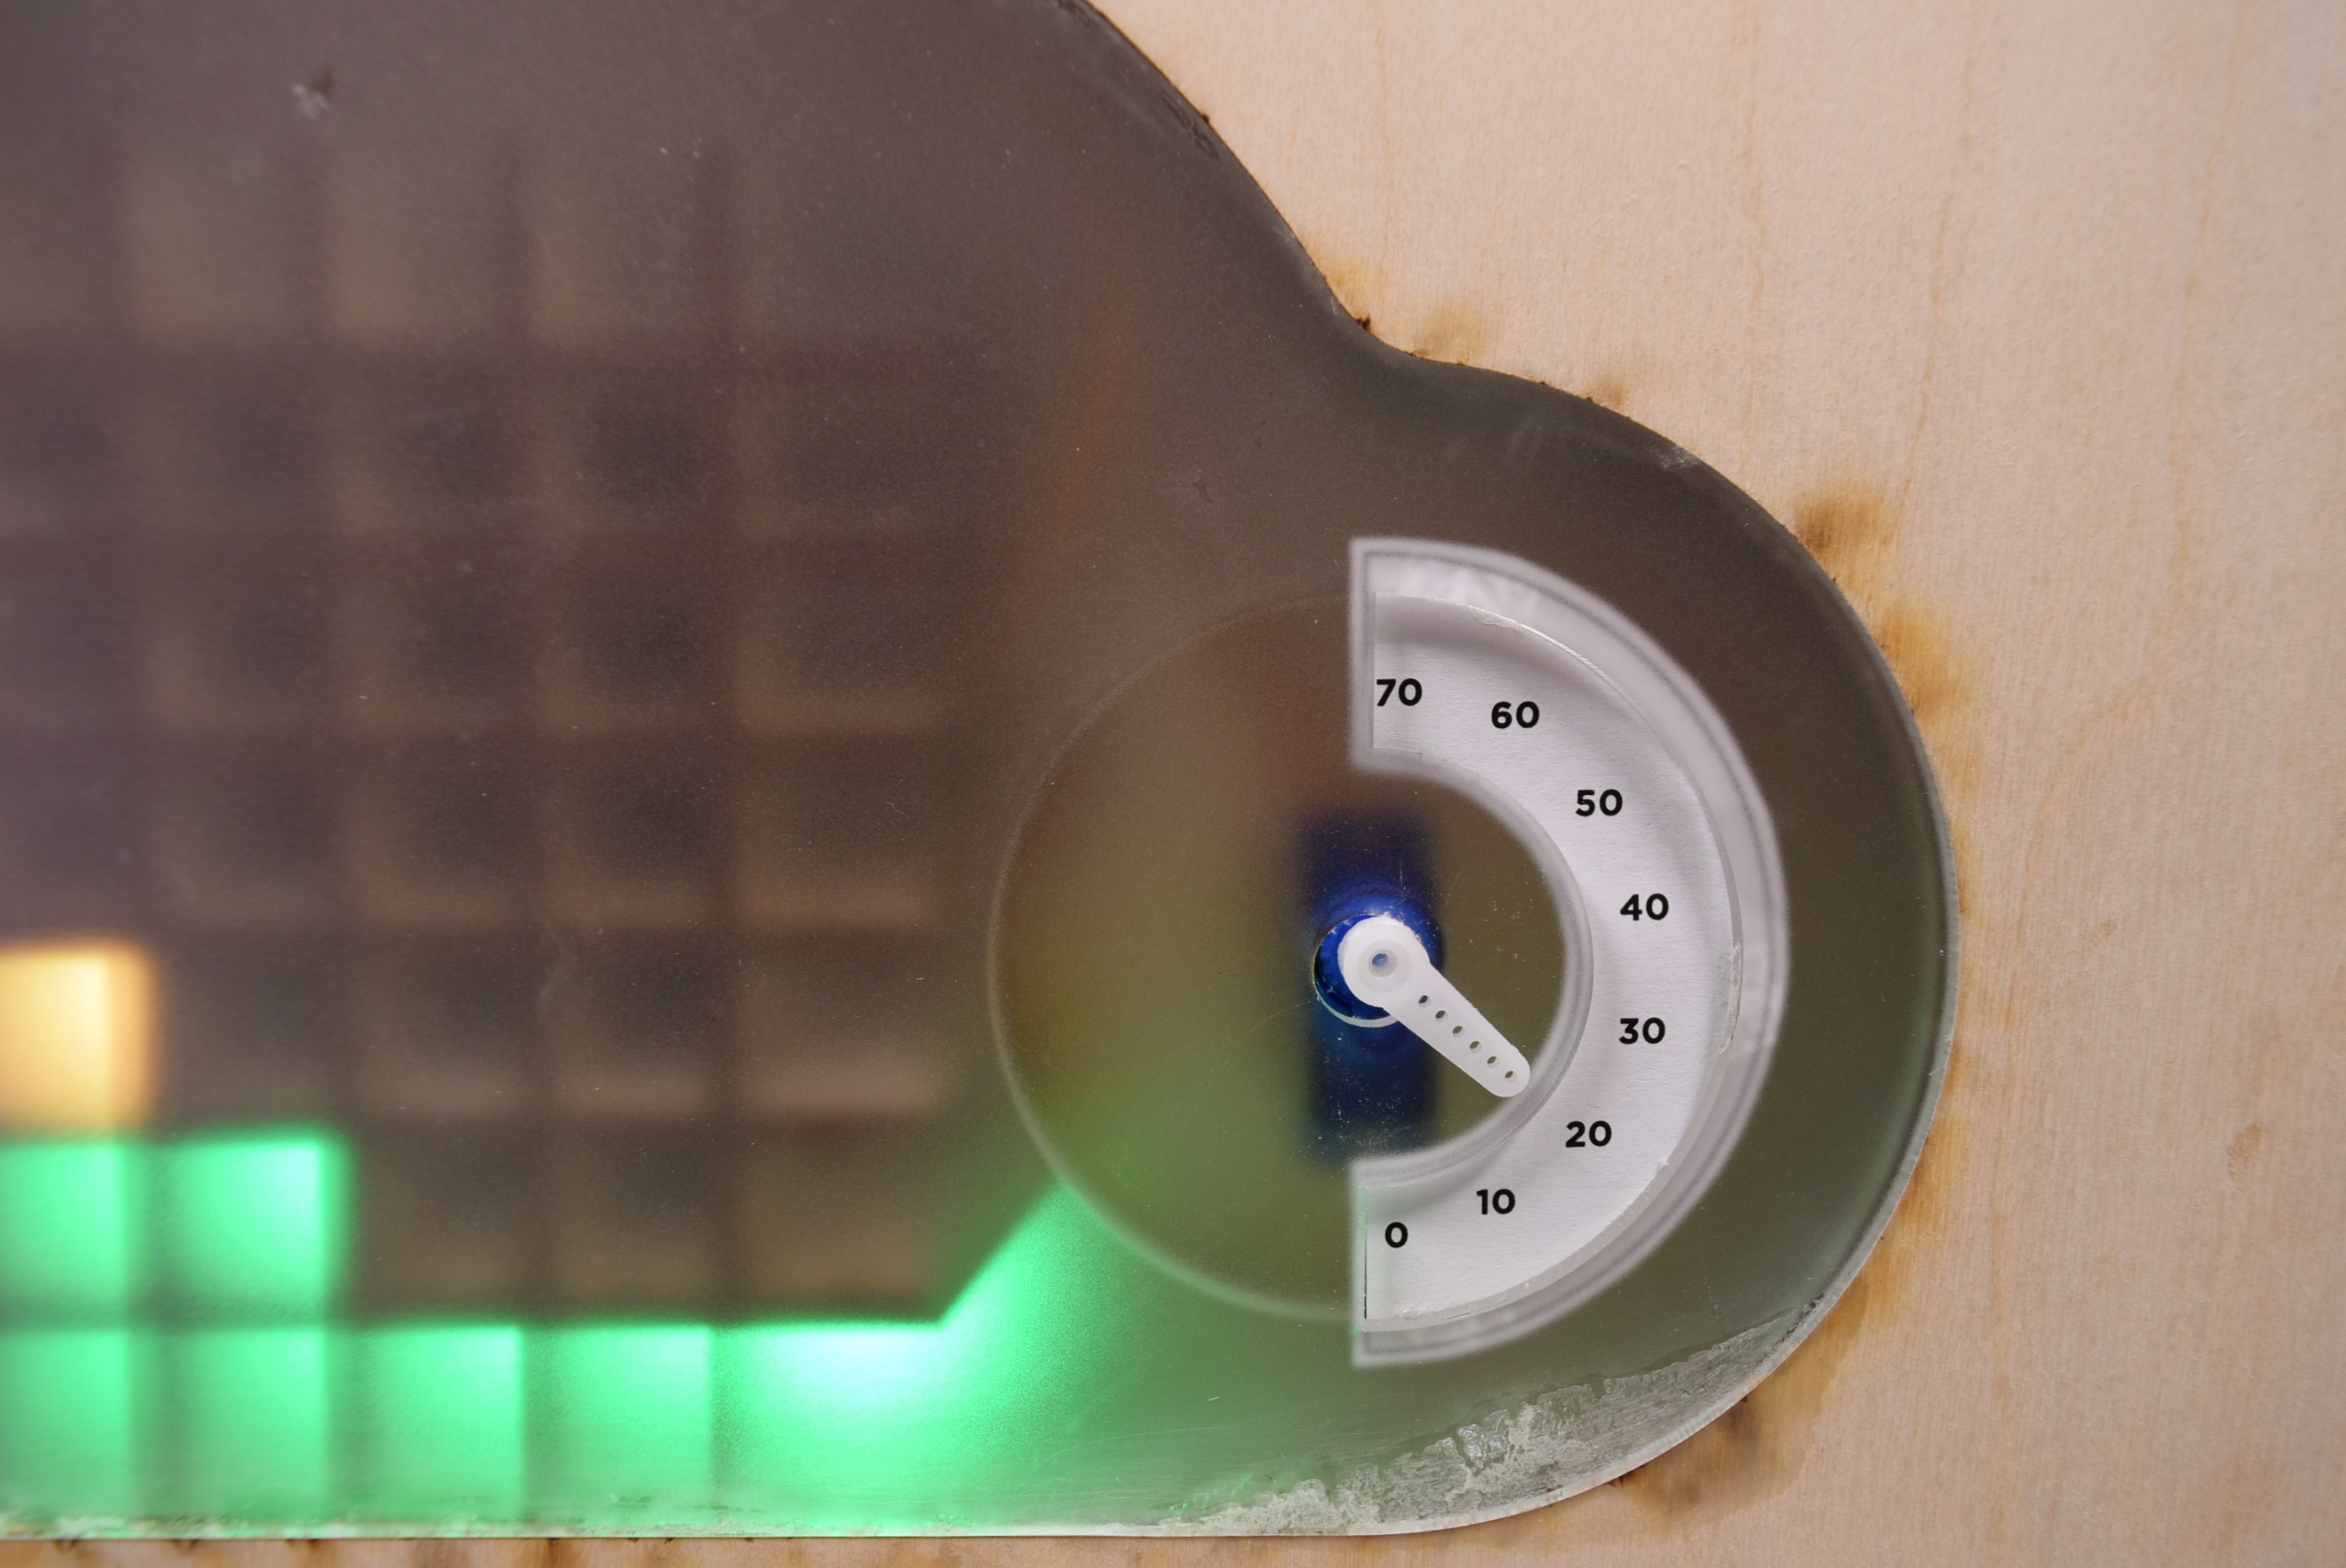
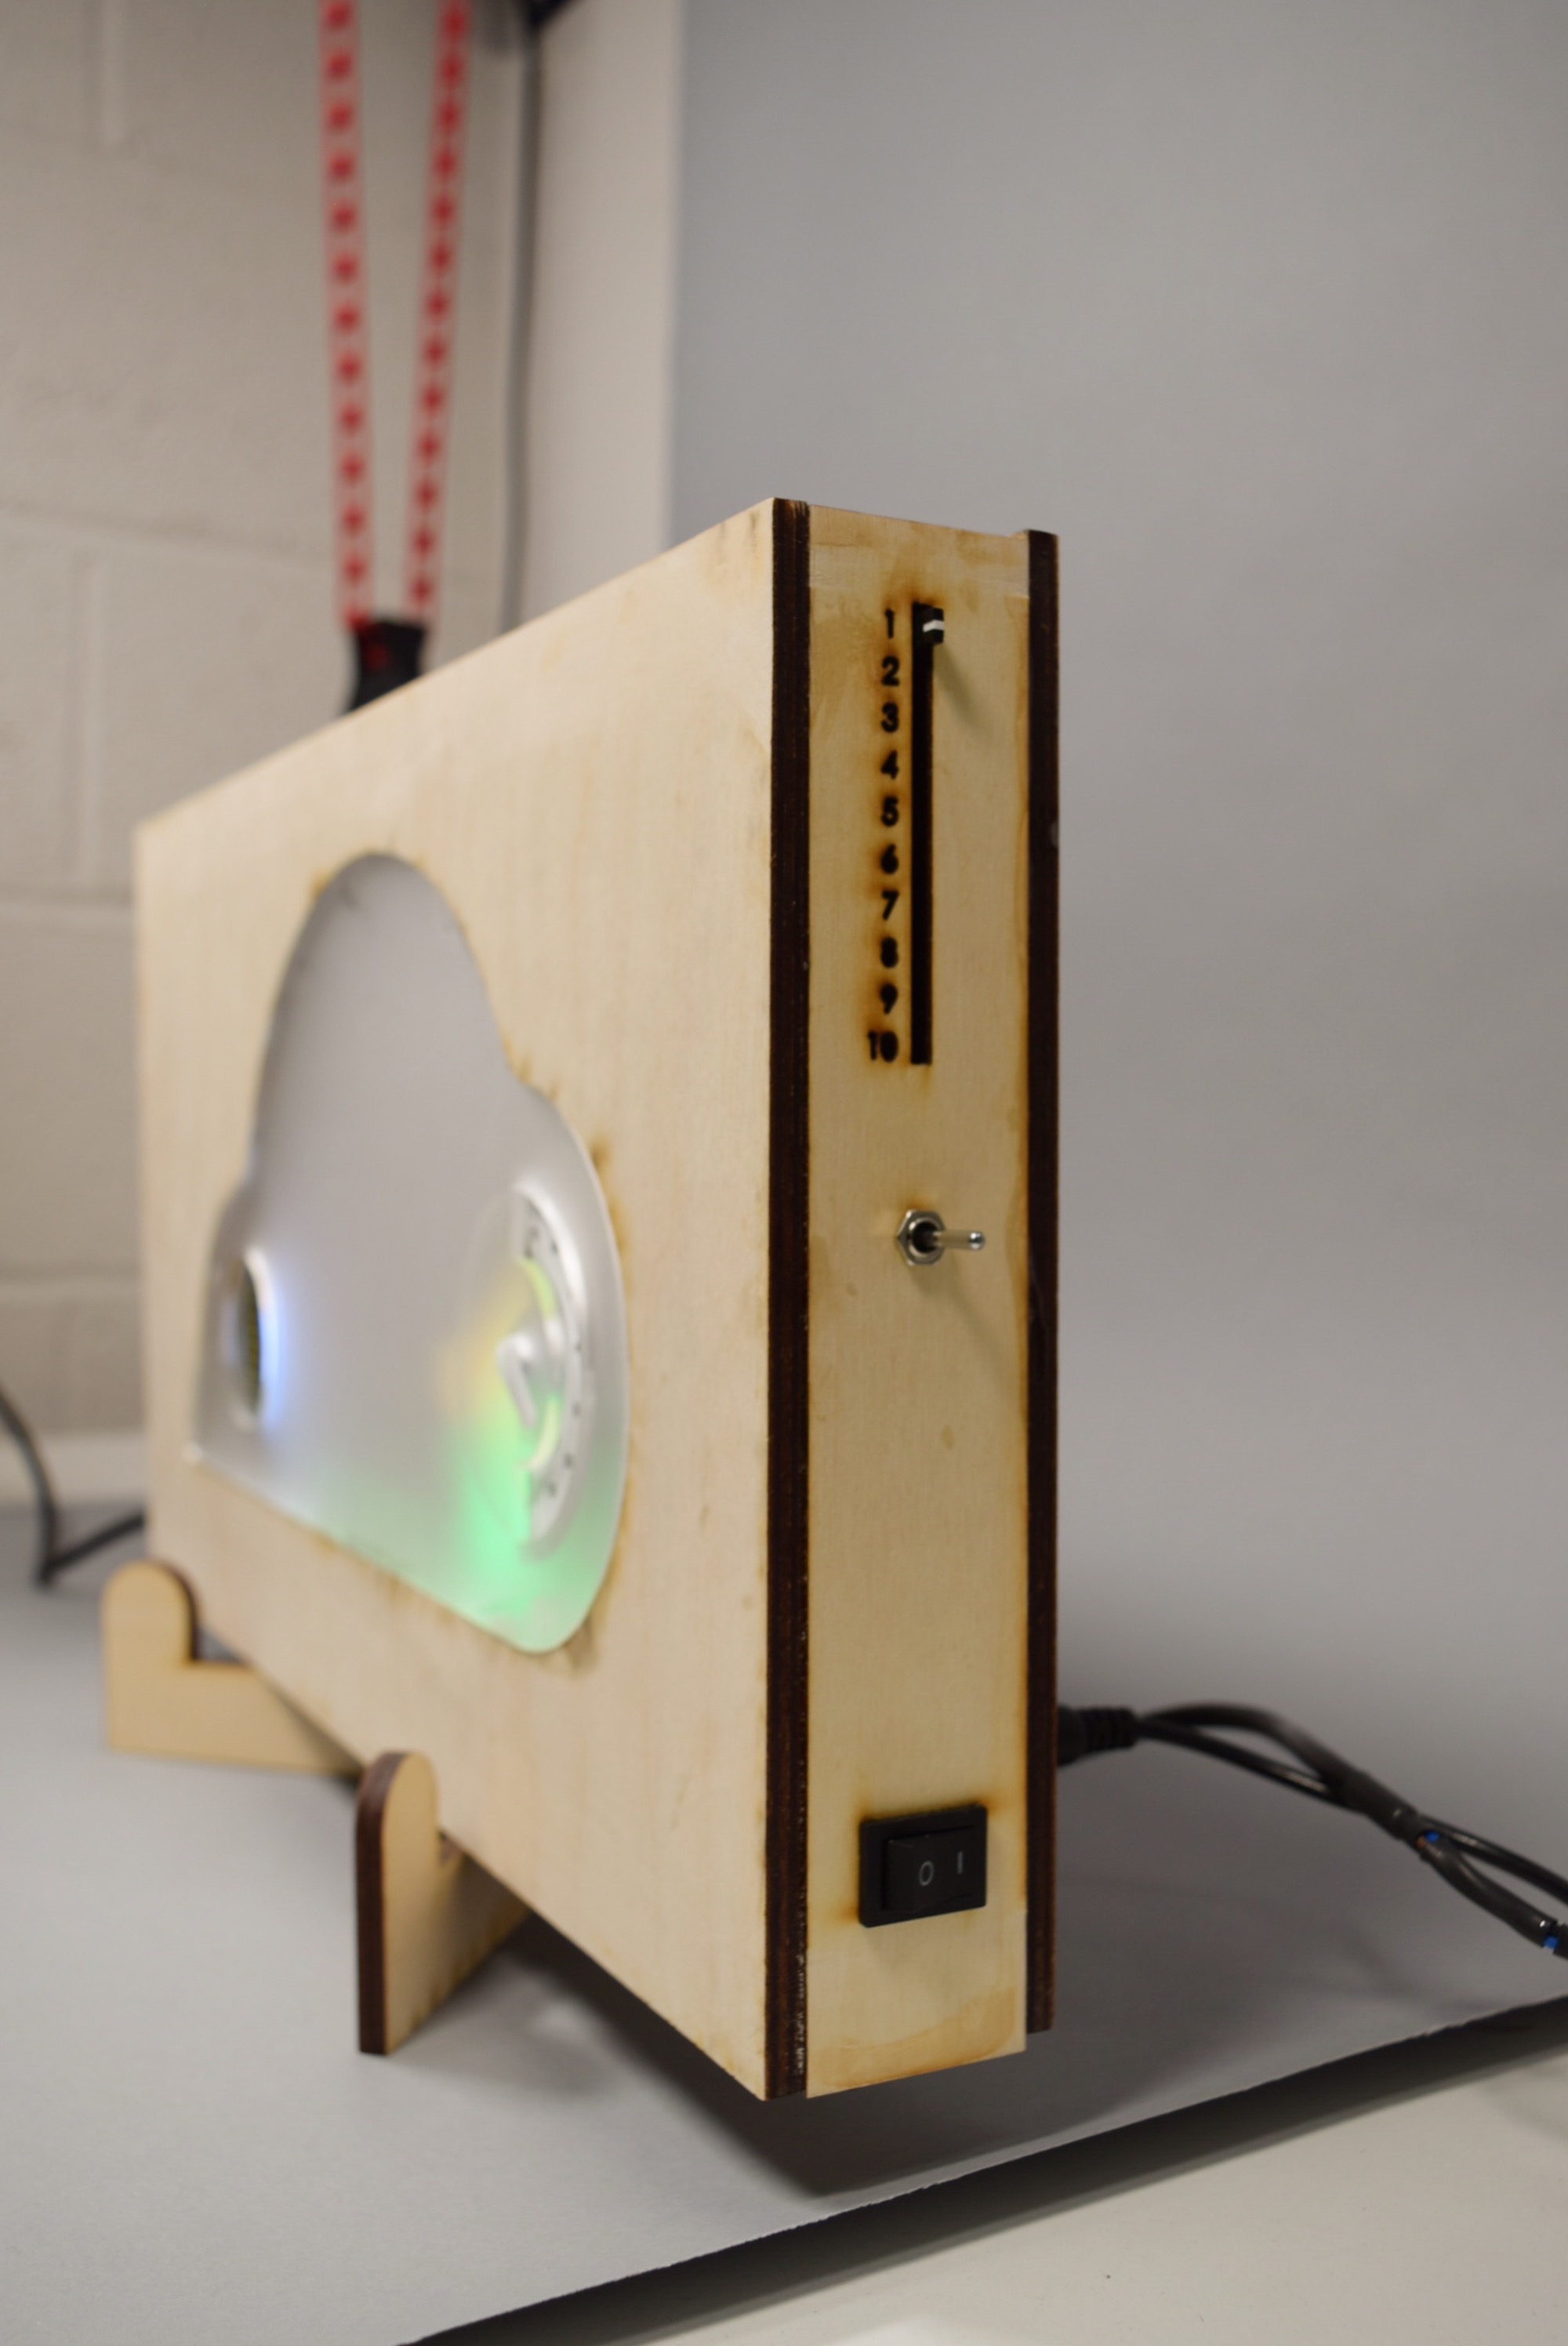
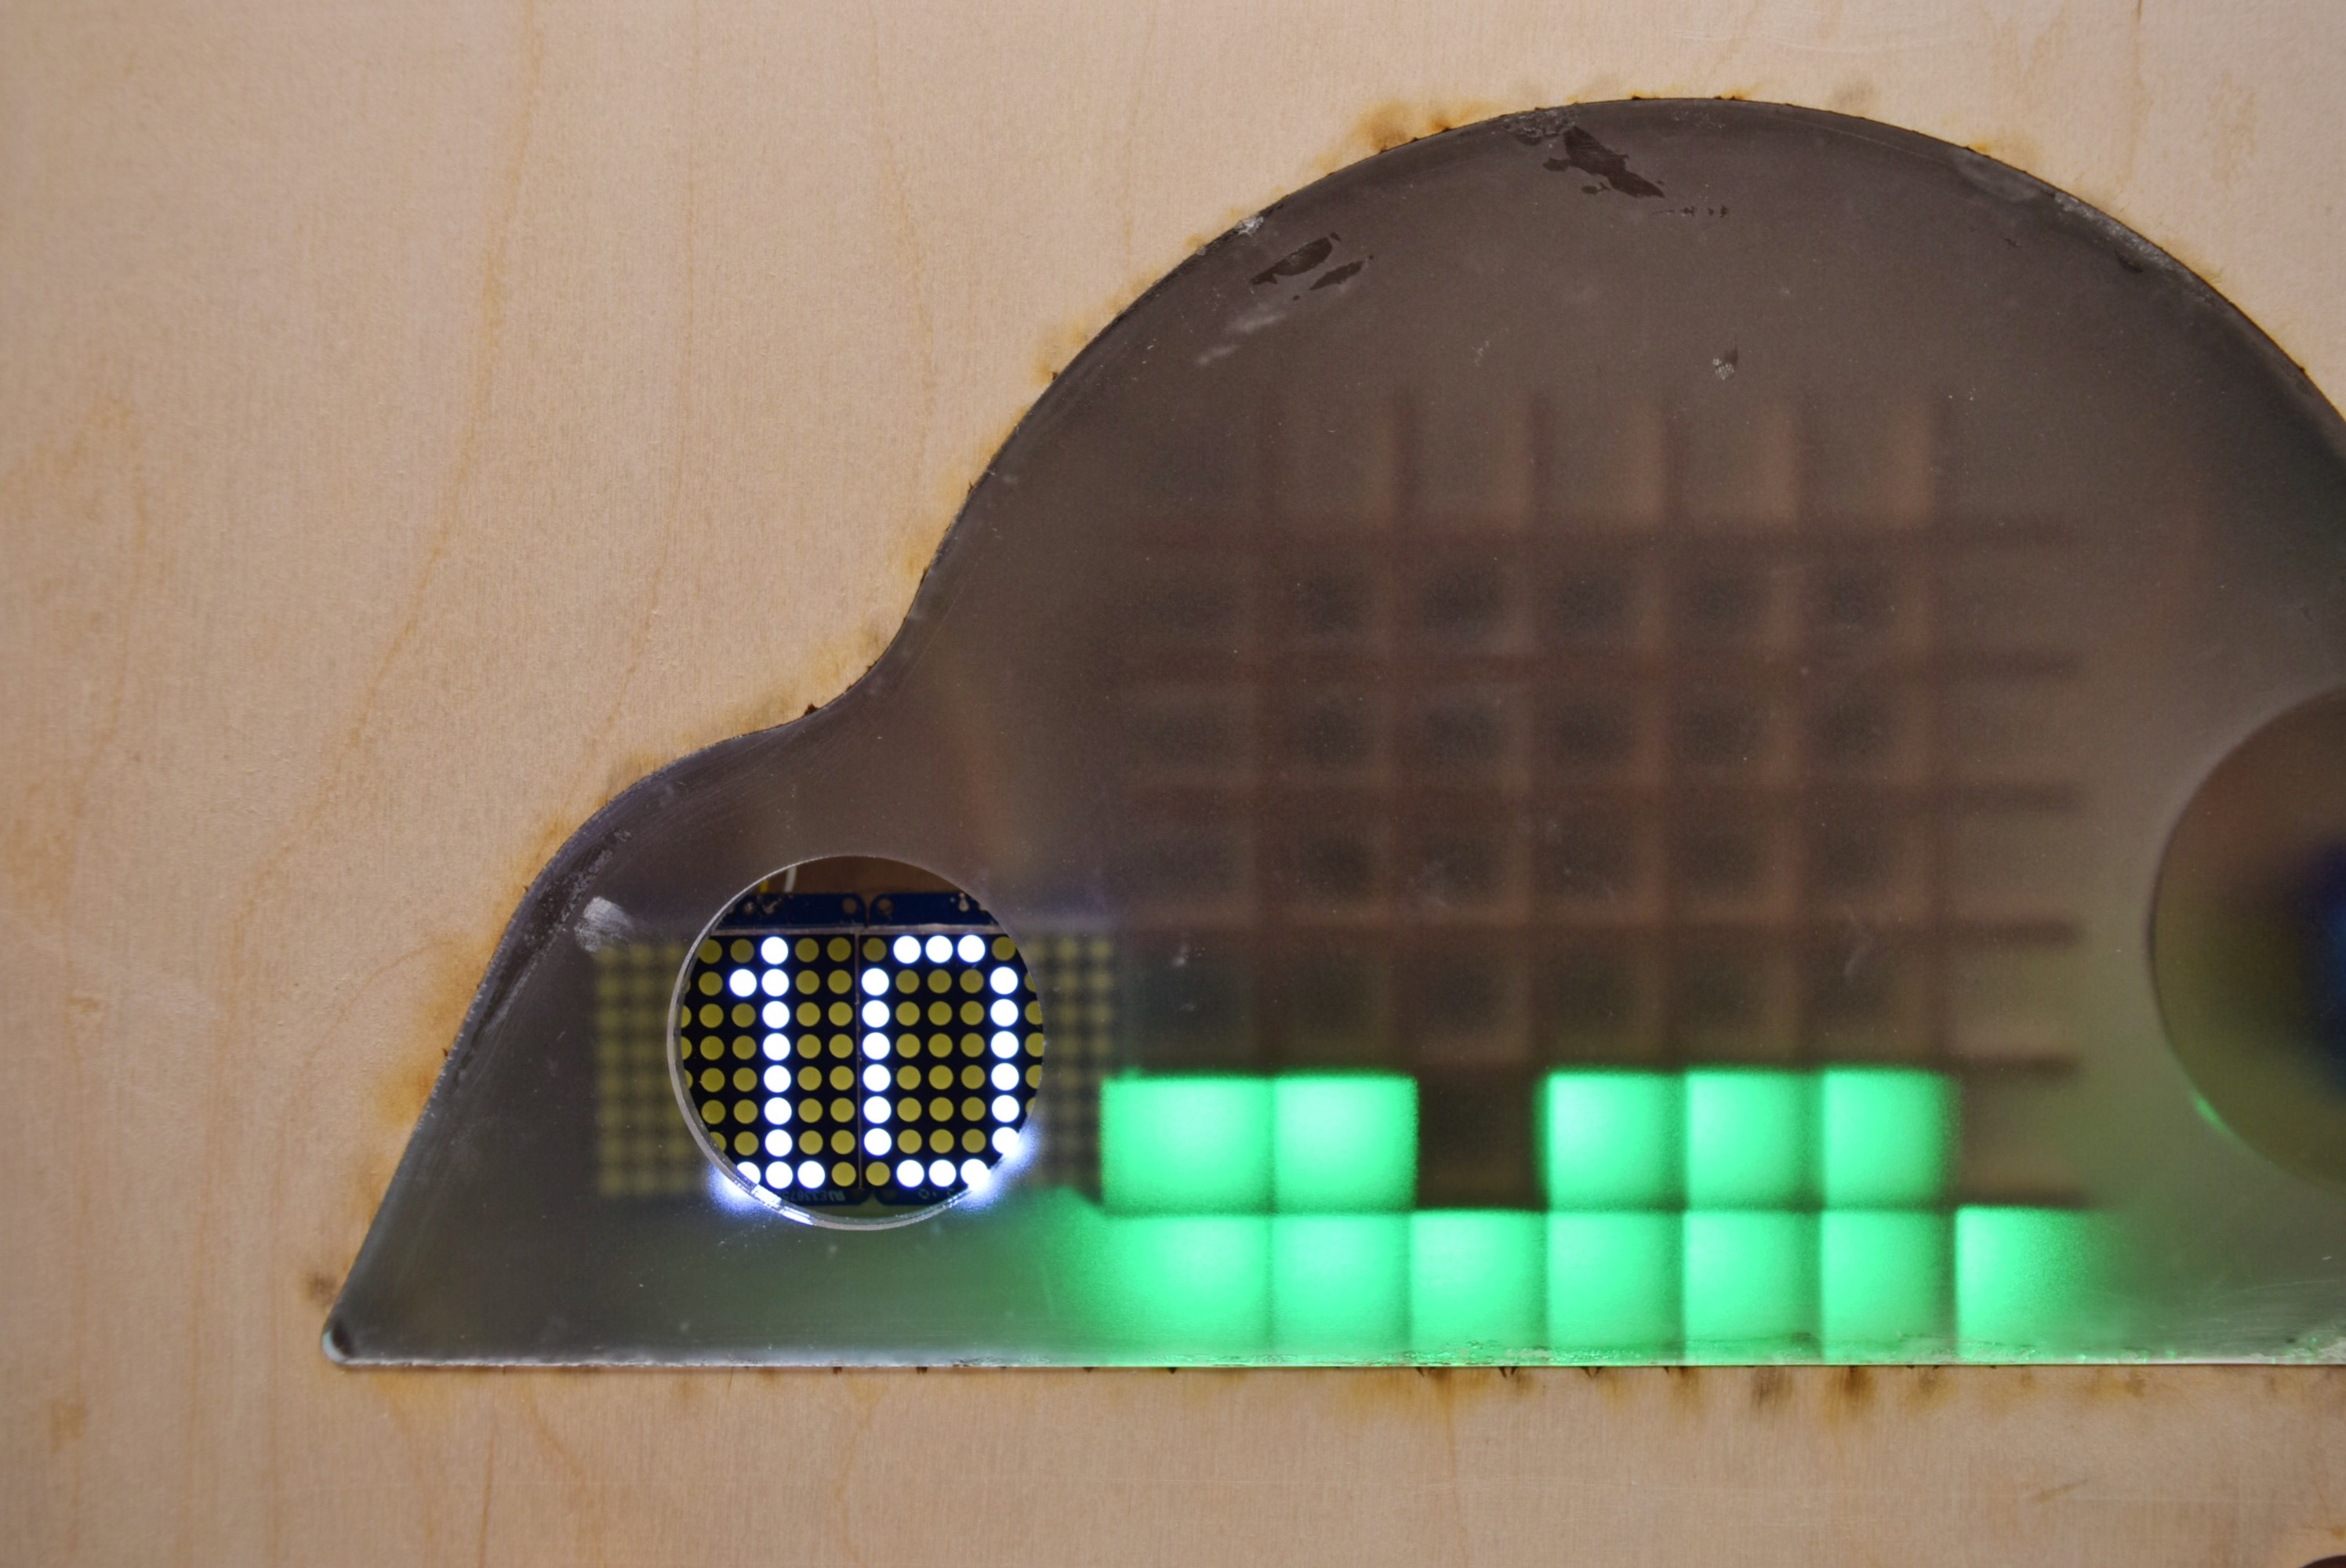
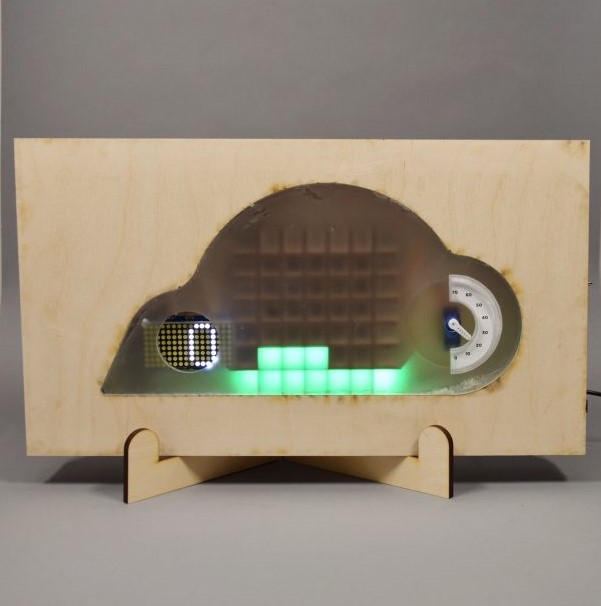
Our project measures the speed of the wind on his balcony and then displays this information in three different ways. The max speed is shown with a speedometer, the current speed is shown on a digital display, and the max wind speeds of the past 7-70 minutes are shown in a bar/line graph based on the setting Peter sets it as. This is all housed on a stand in a compact wooden box with a cloud and the 3 displays on the front with the switches on the right side panel.
Detail 1
Detail 2
Detail 3 Numbers
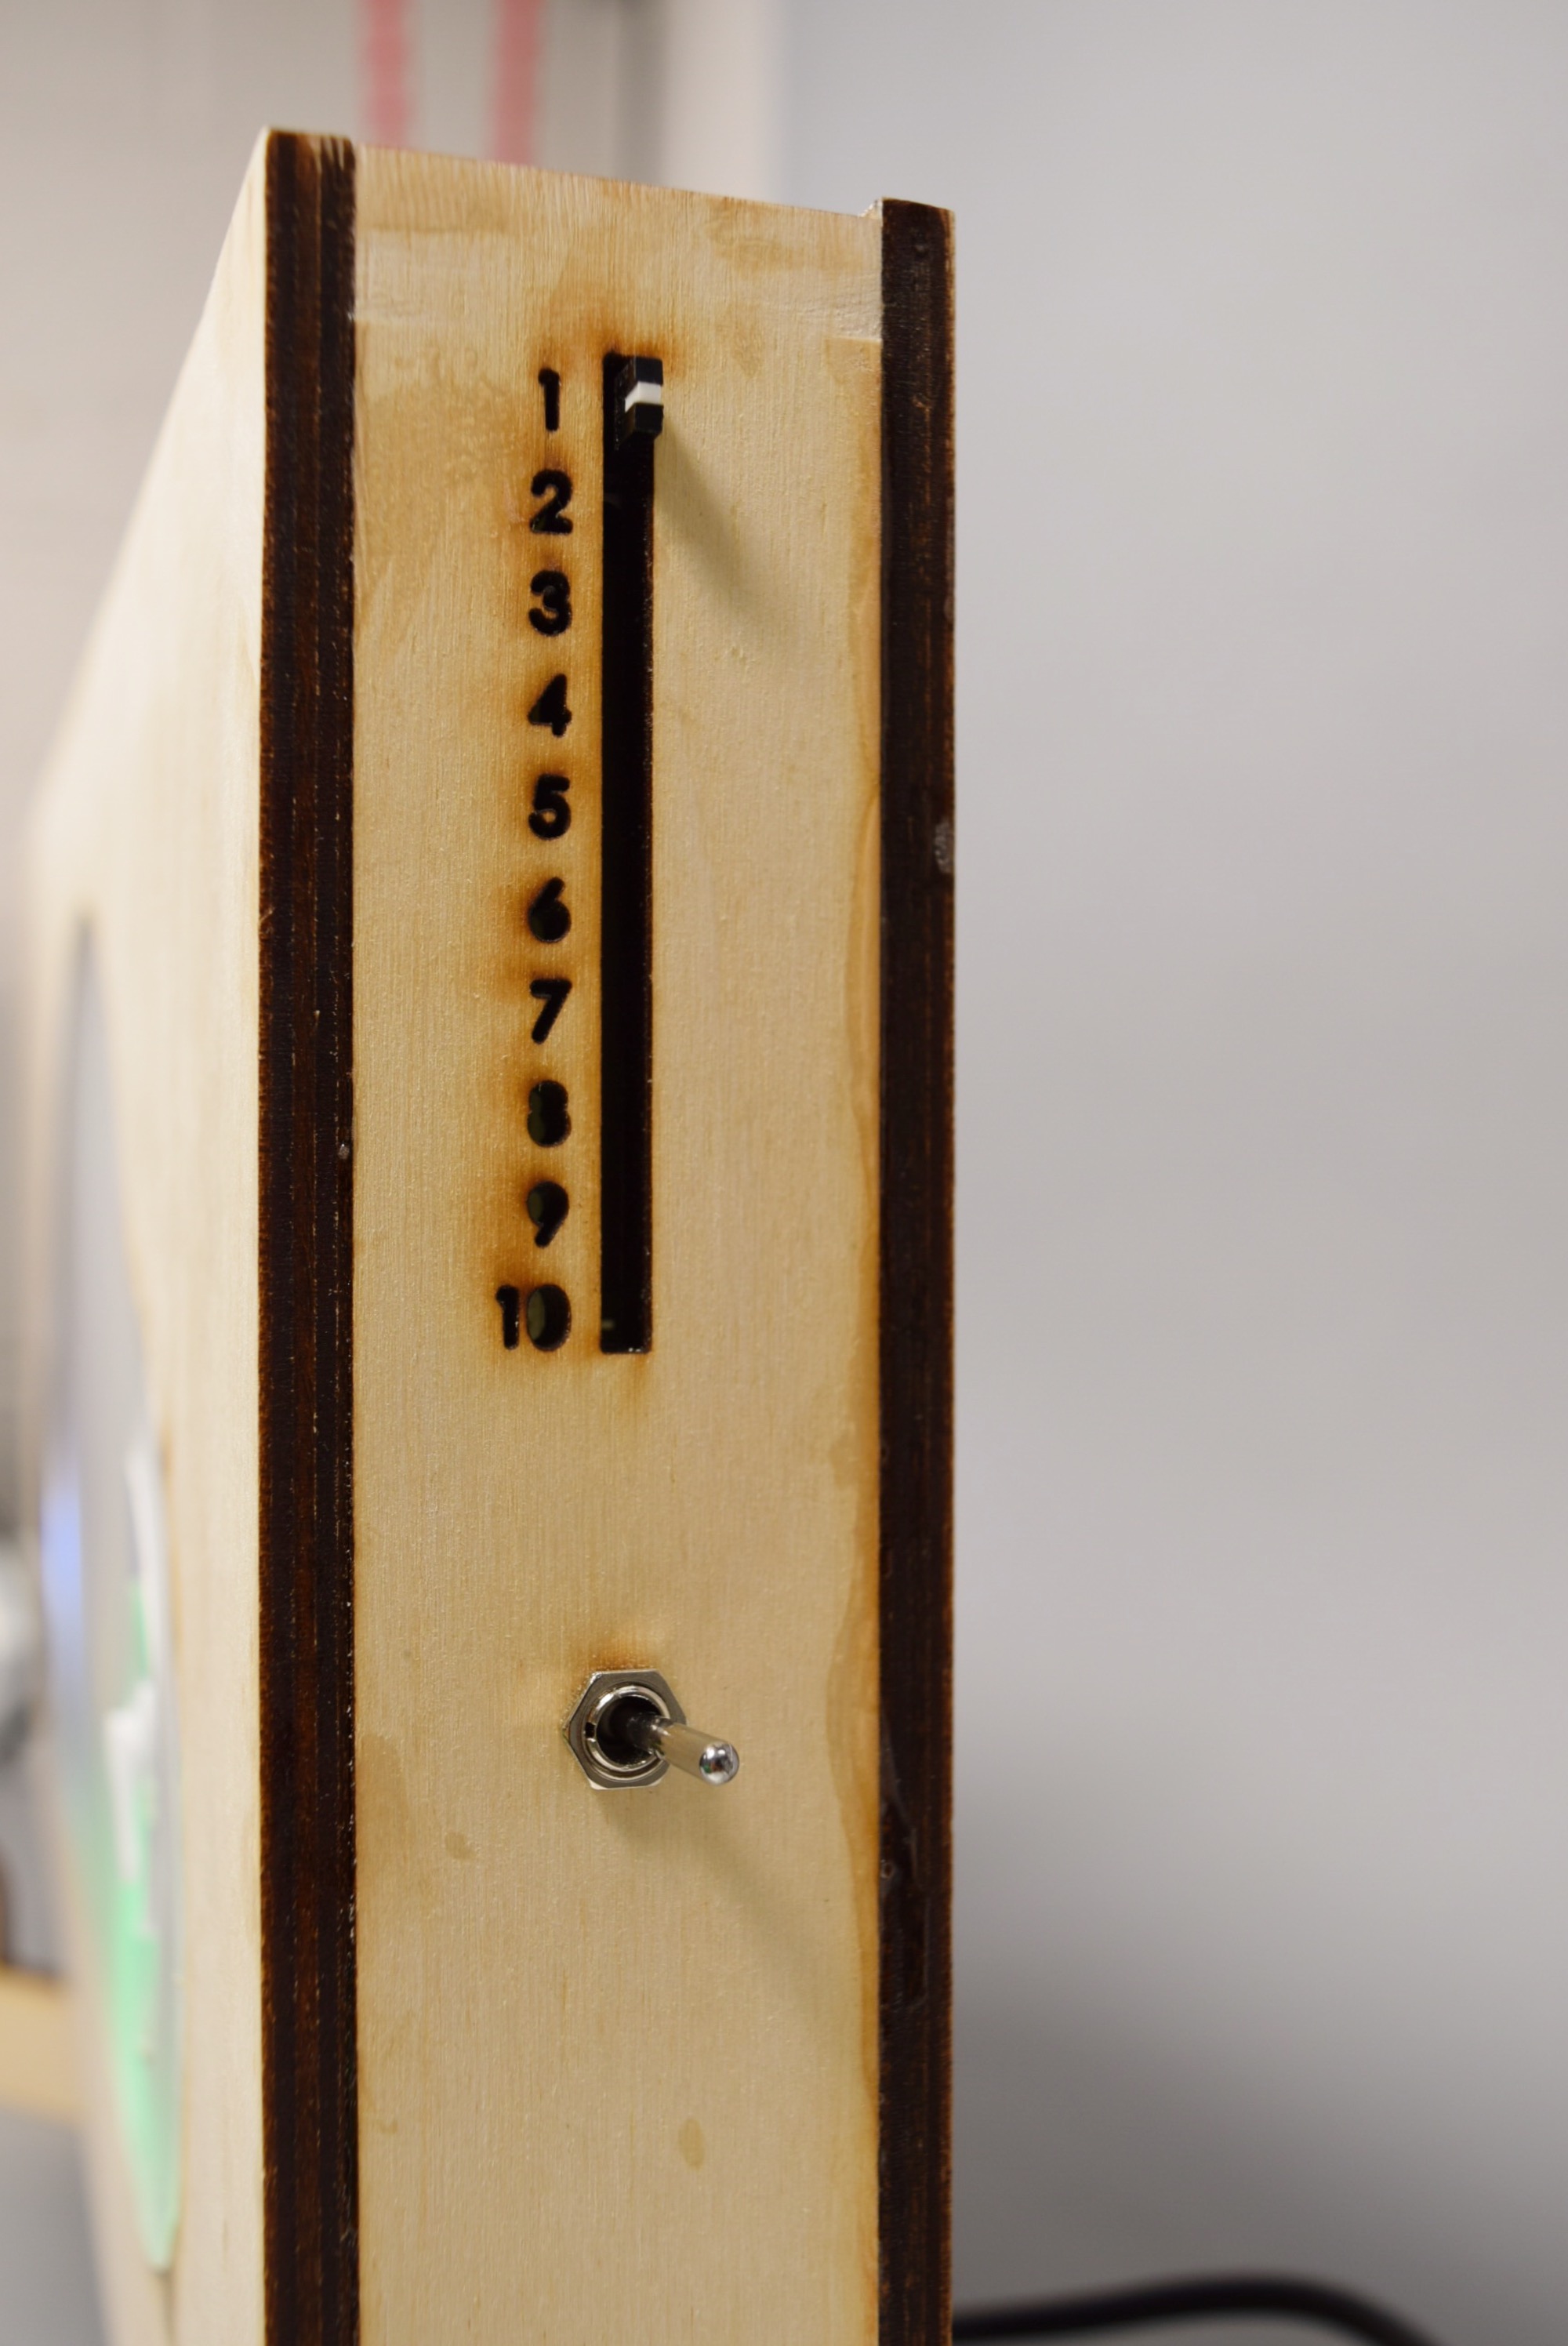
Detail 4 Side
After a windy day, Peter arrives home wondering just how fast it was so high up, so he heads over to Cool Cloud to see the max speed and the history throughout the last hour or so. He’s not surprised that it was 72+mph, but is happy that his suspicions were confirmed that it truly did get that fast on his balcony.
On a nice summer day, Peter wants to have a barbeque on his balcony. However, the news said that there would be mild winds, which might have meant anything up so high in the past. Now though, he knows what the wind is like on such days because of our Cool Cloud. He now knows that it will be perfectly safe and can now better plan future events outside based off what the weather says and the past speeds on such days. He can also finally let his granddaughter see the amazing view his apartment offers without fear of the wind.
How We Got Here
We started off by picking an off-the-shelf sensor that could detect wind speed. The anemometer we chose was a highly durable and weatherproof model that could measure up to 72 mph winds, which seemed ideal for our purposes.
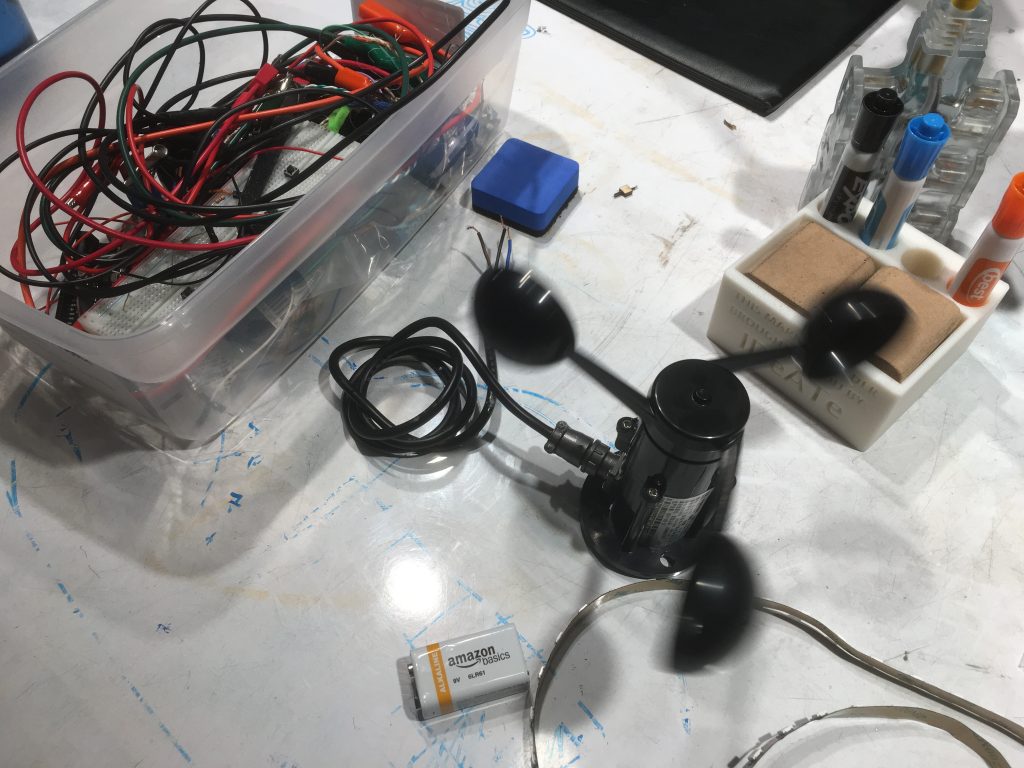
The anemometer
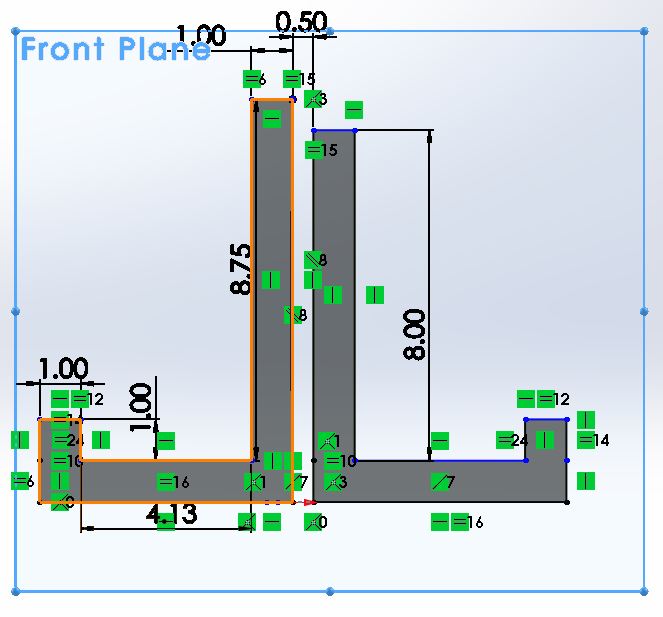
Next, we started prototyping the indoor portion, figuring out what kind of visualizations we would have and how we would package them. We wanted to focus on the aesthetics of the indoor module, as that would set this project apart from a generic weather sensor.
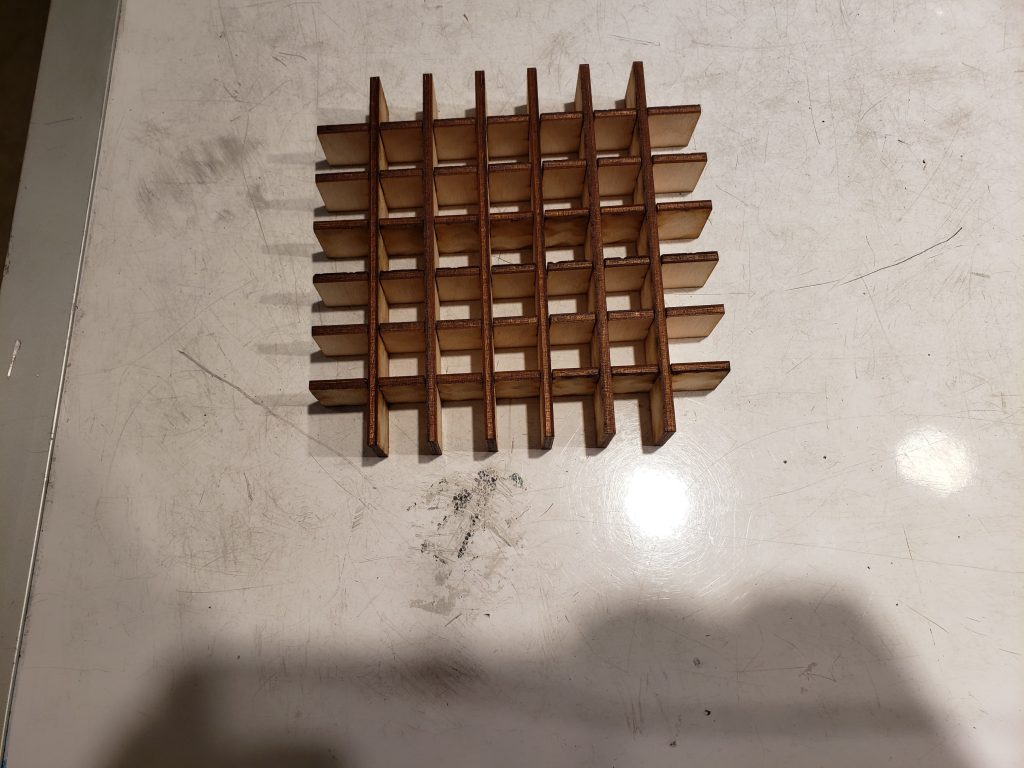
Lasercut wooden grid for the LED bar graph
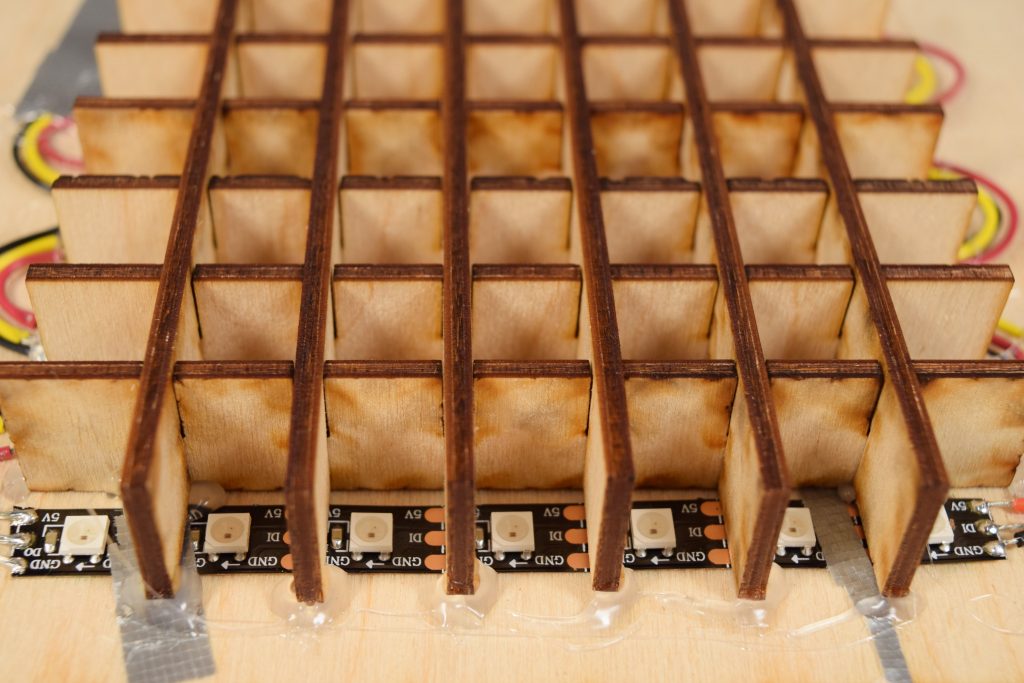
Detail shot of prototype LED strip
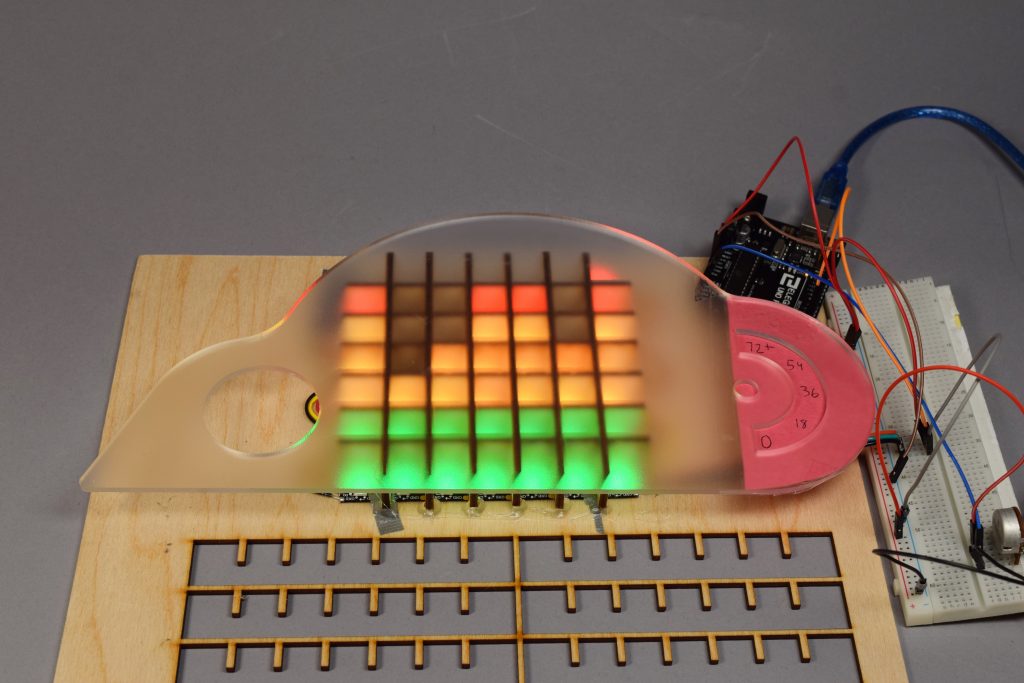
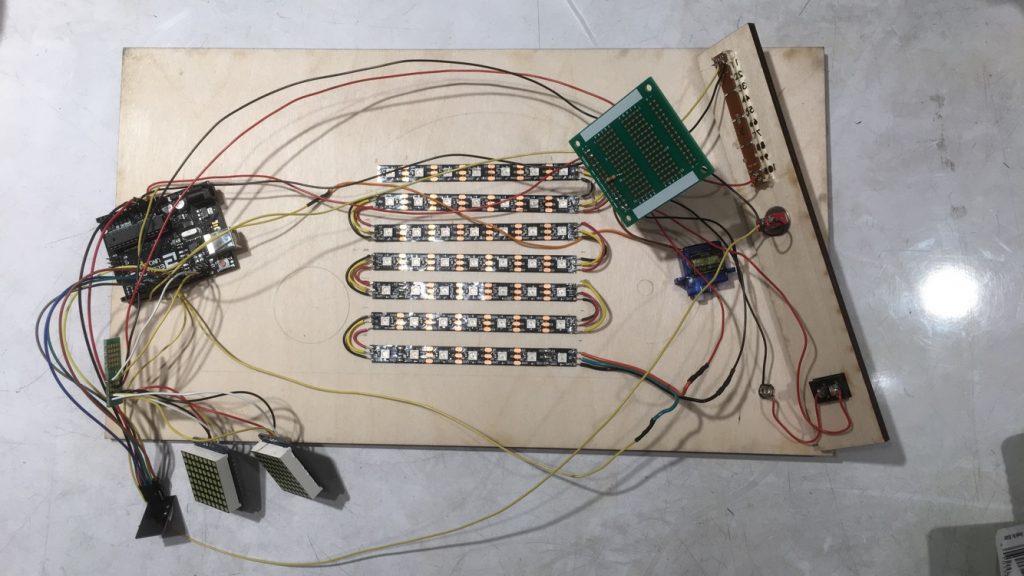
Functional prototype with a potentiometer dummy input
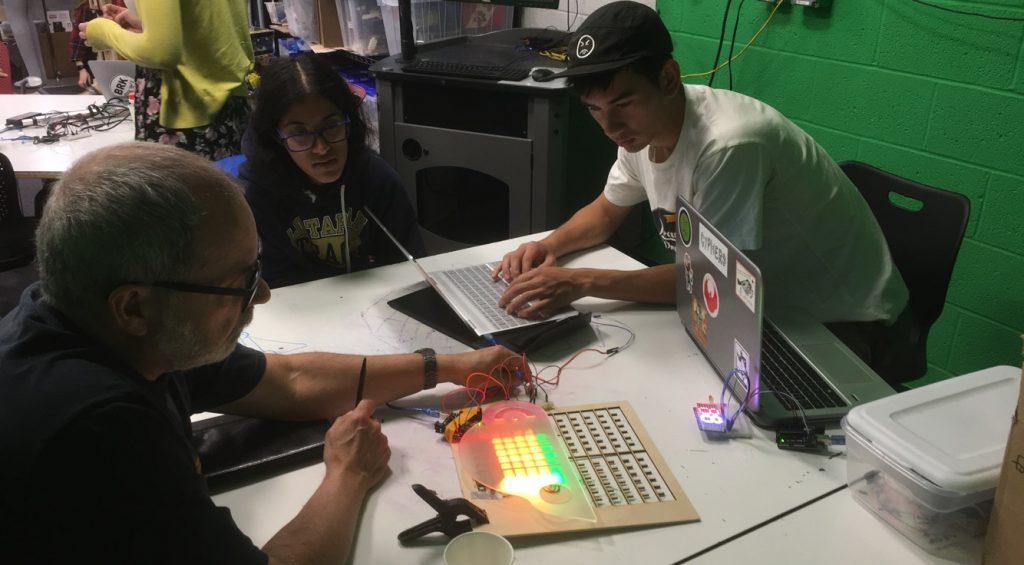
Showing our prototype to Peter
The biggest challenges at this point were all design choices. The scope of the project was pretty wide open, and we had to decide how we were going to present the information to Peter in a useful and appealing way. We spent a lot of time sketching, CADing, and prototyping different approaches.
For the final version, our challenges were to package everything nicely in a box and to weatherproof the outdoor module. This meant figuring out a secure way to mount the anemometer to Peter’s railing as well as building an enclosure that could keep the electronics from getting wet.
To secure the anemometer, we designed a 3-part clamping system that could bolt together on a T-joint of Peter’s railing.
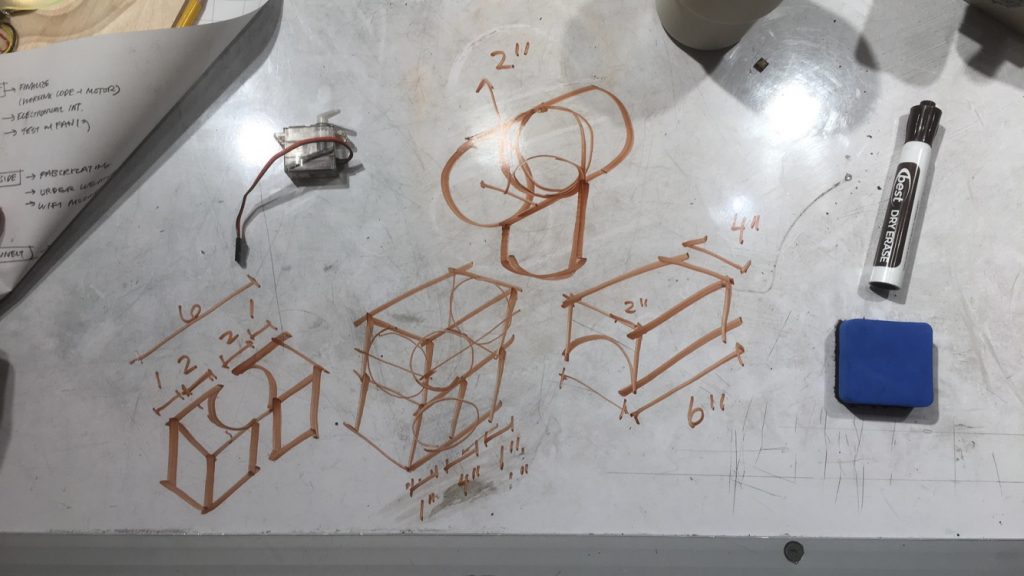
Brainstorming a clamping system
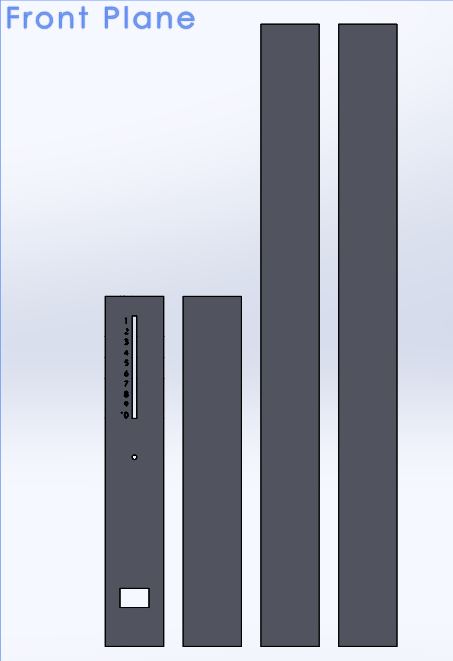
Making the side panels
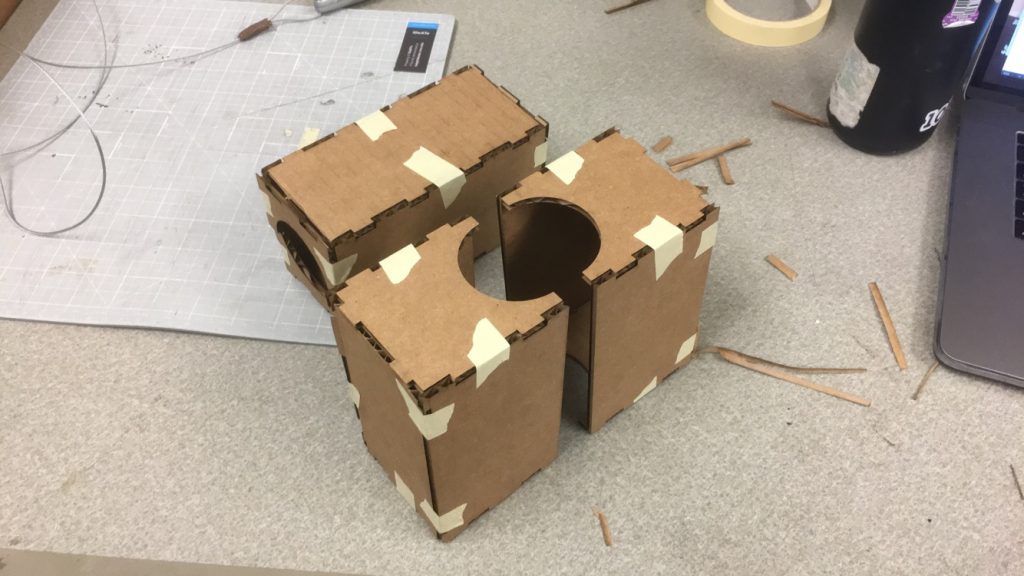
Clamp prototype
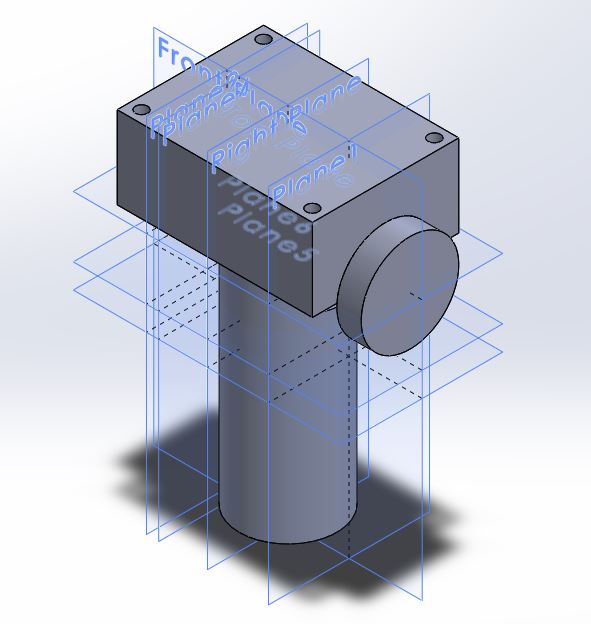
Creating the mounting box to be 3D printed
We 3D printed a final version of the clamping pieces. For the indoor portion, we still had to build our box and solder all of our electronics.
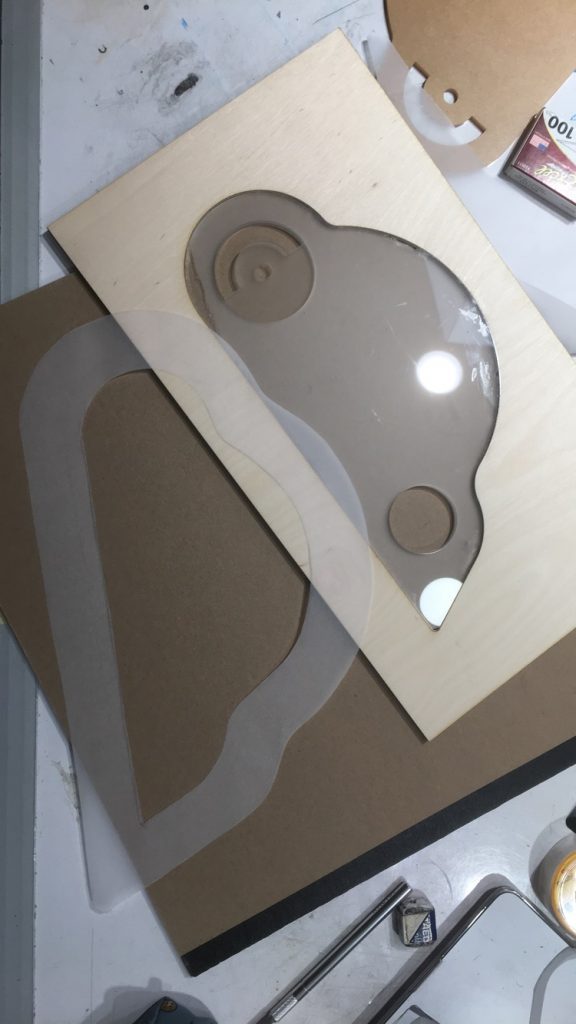
Lasercut pieces for the enclosure
Making the stand
Back panel with some soldered components
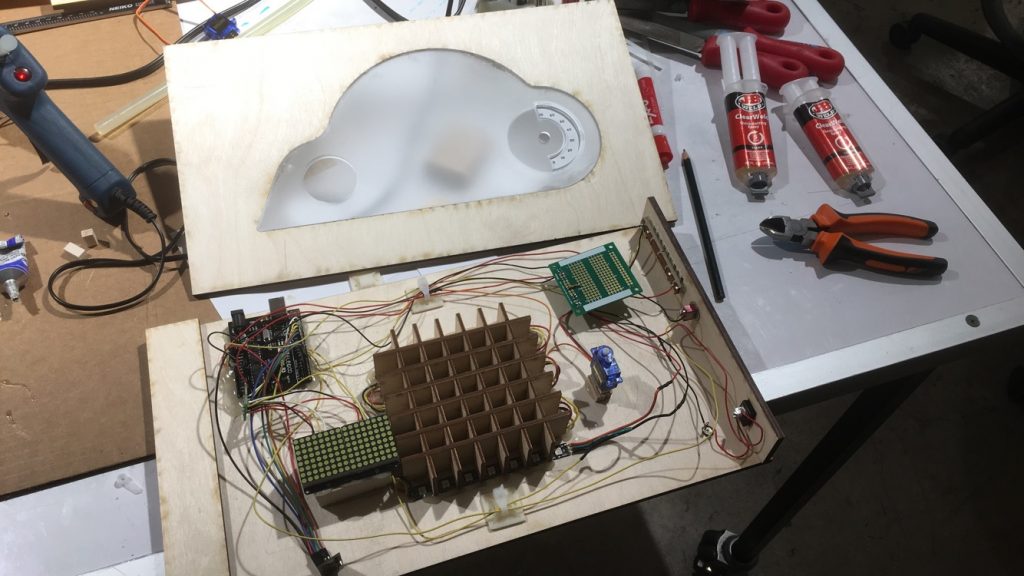
All components soldered and mounted
The toughest part of the final was the small last-minute adjustments we had to make to get everything to work smoothly. For instance, we had to cut some of our lasercut pieces to size because they were off by a little bit. We also added a hole to be able to access the Arduino’s USB port. It also took us a few tries to make the standoffs that the servo and LED matrices are mounted to. Technically, none of the components in this project were that challenging to use, and we were confident we could achieve full functionality. Integrating everything seamlessly and mechanically fabricating the whole thing was challenging.
Conclusions and Lessons Learned
The crit made us feel pretty good about our project as most people said it was pretty cool and worked well. One question we got was as to why our graph read from left to right with the left being the most recent instead of the other way around. This is interesting because we thought this was most logical as you read a book from left to right. It was brought up that in most bar graphs the most recent information is on the right and even for a book, the most recent information is technically on the right. This is a pretty sound argument that we never thought of and would have been a pretty quick fix if we chose to do so. One criticism we received from the written feedback is that our indoor component could have looked better, more specifically as two people pointed out that it may have looked better if we used “a different material than wood” because “you can see the burn marks.” We liked the contrast the wood provided with the frosted acrylic and thought it would have a nice aesthetic on a table or wall; however, we could have chosen another material like a different color acrylic that would have had contrast without burn marks. Another concern was that “it will not survive PGH winter.” This is a concern that we also have about our outdoor component, but the anemometer is said to be able to take the weather and the screws should be able to hold up. One feature that Peter mentioned would have been nice is if he could plug his computer in and see the history of it over its entire time running or if data could have also been transmitted to his phone. These sound like pretty interesting features, that we may have been able to include had we been informed of the desire earlier as well as if we had more time on the project. Other than that Peter was happy with our cloud display and really liked that we decided to include the toggle switch for him to go between a bar and line graph.
This was a really refreshing and fulfilling experience because we got to build something that we know will be used and is helpful to someone other than ourselves or simply to meet an assigned task. It was surprising how long it took us to figure out that this project is what Peter clearly wanted from the very beginning. Talking to Peter throughout the designing and building process was also a lot more seamless than originally anticipated. We do however think it would also be a good idea to ask if there were any additional features that he wanted us to include while making the final product (after the prototype meeting). This way we could discuss with him the feasibility of such things and maybe incorporate an aspect of it. Overall we are really happy with how our project turned out in that it worked exactly as we meant it too.
While we are happy with our project, there are still some things that we would have done differently if we were making it again. Hinging the back of the box so that it can be opened back up in case something somehow went wrong with the wiring last second is something to keep in mind for all our future projects and would have been very helpful for our peace of mind. Additionally, it would be a good idea to test everything together earlier in case there wasn’t as simple of a fix as we found and it were to take longer to figure it out.
Technical Details
- <span class="com">/*
- * Cool Cloud
- *
- * Alton Olson, Vicky Zhou, Seema Kamath
- *
- * This is the transmitter that lives outside and sends
- * wind data to the receiver indoors.
- *
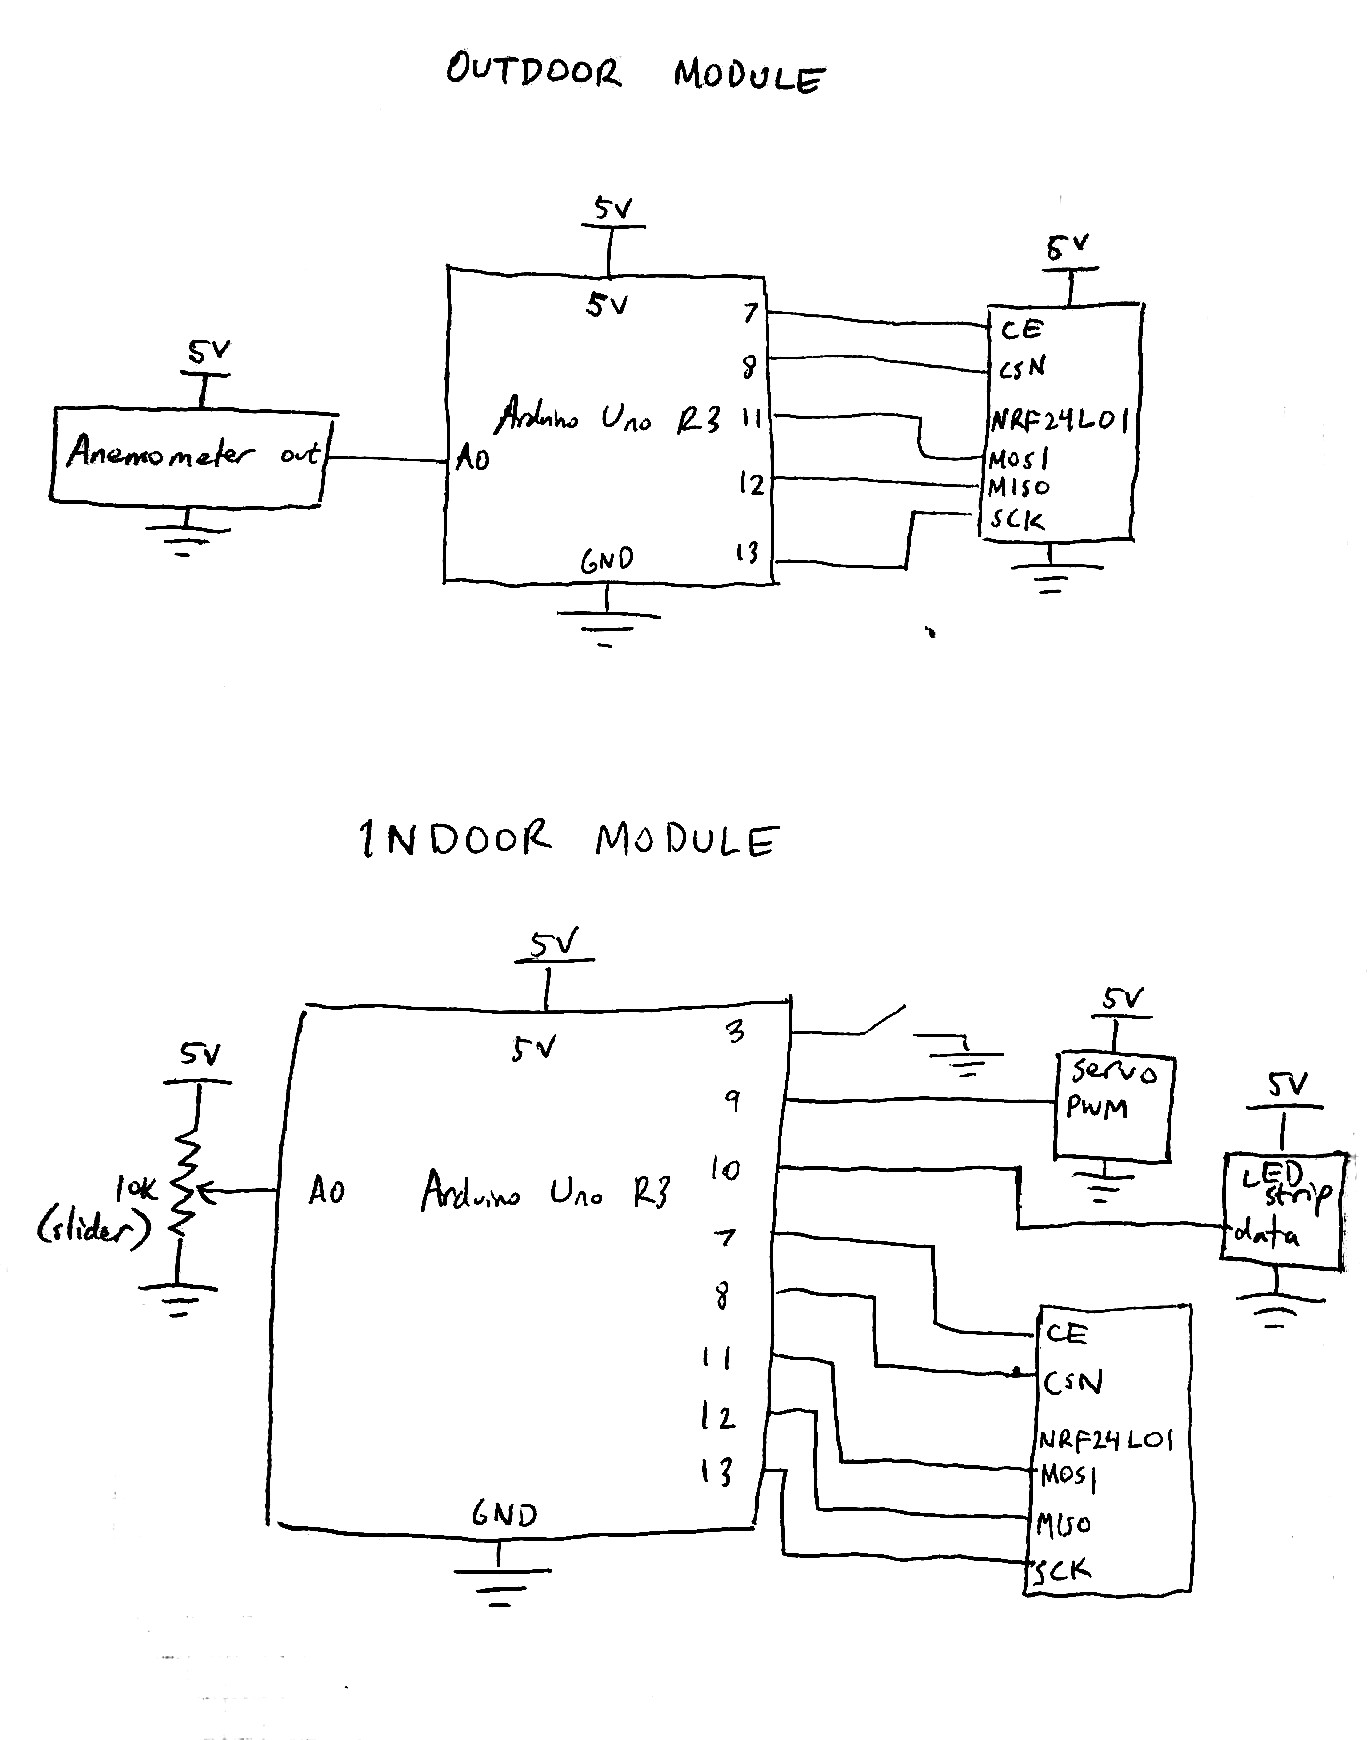
- * Pins:
- * A0 - anemometer output
- * 7 - radio CE
- * 8 - radio CSN
- */</span><span class="pln">
- </span><span class="com">#include</span><span class="pln"> </span><span class="str"><SPI.h></span><span class="pln">
- </span><span class="com">#include</span><span class="pln"> </span><span class="str"><nRF24L01.h></span><span class="pln">
- </span><span class="com">#include</span><span class="pln"> </span><span class="str"><RF24.h></span><span class="pln">
- RF24 radio</span><span class="pun">(</span><span class="lit">7</span><span class="pun">,</span><span class="pln"> </span><span class="lit">8</span><span class="pun">);</span><span class="pln"> </span><span class="com">// CE, CSN</span><span class="pln">
- </span><span class="kwd">const</span><span class="pln"> </span><span class="kwd">byte</span><span class="pln"> address</span><span class="pun">[</span><span class="lit">6</span><span class="pun">]</span><span class="pln"> </span><span class="pun">=</span><span class="pln"> </span><span class="str">"00001"</span><span class="pun">;</span><span class="pln">
- </span><span class="kwd">void</span><span class="pln"> setup</span><span class="pun">()</span><span class="pln"> </span><span class="pun">{</span><span class="pln">
- </span><span class="com">// set up radio</span><span class="pln">
- radio</span><span class="pun">.</span><span class="kwd">begin</span><span class="pun">();</span><span class="pln">
- radio</span><span class="pun">.</span><span class="pln">openWritingPipe</span><span class="pun">(</span><span class="pln">address</span><span class="pun">);</span><span class="pln">
- radio</span><span class="pun">.</span><span class="pln">setPALevel</span><span class="pun">(</span><span class="pln">RF24_PA_HIGH</span><span class="pun">);</span><span class="pln">
- radio</span><span class="pun">.</span><span class="pln">stopListening</span><span class="pun">();</span><span class="pln">
- </span><span class="pun">}</span><span class="pln">
- </span><span class="kwd">void</span><span class="pln"> loop</span><span class="pun">()</span><span class="pln"> </span><span class="pun">{</span><span class="pln">
- </span><span class="com">// read anemometer value</span><span class="pln">
- </span><span class="kwd">int</span><span class="pln"> reading </span><span class="pun">=</span><span class="pln"> analogRead</span><span class="pun">(</span><span class="pln">A0</span><span class="pun">);</span><span class="pln">
- </span><span class="com">// send anemometer value</span><span class="pln">
- radio</span><span class="pun">.</span><span class="pln">write</span><span class="pun">(&</span><span class="pln">reading</span><span class="pun">,</span><span class="pln"> </span><span class="kwd">sizeof</span><span class="pun">(</span><span class="pln">reading</span><span class="pun">));</span><span class="pln">
- delay</span><span class="pun">(</span><span class="lit">1000</span><span class="pun">);</span><span class="pln">
- </span><span class="pun">}</span>
- <span class="com">/*
- * Cool Cloud
- *
- * Alton Olson, Vicky Zhou, Seema Kamath
- *
- * This is the receiver that lives indoors and displays
- * all the visualizations.
- *
- * Pins:
- * A0 - slider pot for adjusting graph interval
- * 3 - switch for line graph/bar graph
- * 7 - radio CE
- * 8 - radio CSN
- * 9 - servo
- * 10 - LED strip
- */</span><span class="pln">
- </span><span class="com">#include</span><span class="pln"> </span><span class="str"><PololuLedStrip.h></span><span class="pln">
- </span><span class="com">#include</span><span class="pln"> </span><span class="str"><Wire.h></span><span class="pln">
- </span><span class="com">#include</span><span class="pln"> </span><span class="str"><Adafruit_GFX.h></span><span class="pln">
- </span><span class="com">#include</span><span class="pln"> </span><span class="str">"Adafruit_LEDBackpack.h"</span><span class="pln">
- </span><span class="com">#include</span><span class="pln"> </span><span class="str"><SPI.h></span><span class="pln">
- </span><span class="com">#include</span><span class="pln"> </span><span class="str"><nRF24L01.h></span><span class="pln">
- </span><span class="com">#include</span><span class="pln"> </span><span class="str"><RF24.h></span><span class="pln">
- </span><span class="com">#include</span><span class="pln"> </span><span class="str"><Adafruit_TiCoServo.h></span><span class="pln">
- </span><span class="kwd">const</span><span class="pln"> </span><span class="kwd">int</span><span class="pln"> LED_COUNT </span><span class="pun">=</span><span class="pln"> </span><span class="lit">49</span><span class="pun">;</span><span class="pln">
- </span><span class="kwd">const</span><span class="pln"> </span><span class="kwd">int</span><span class="pln"> SERVO_PIN </span><span class="pun">=</span><span class="pln"> </span><span class="lit">9</span><span class="pun">;</span><span class="pln">
- </span><span class="kwd">const</span><span class="pln"> </span><span class="kwd">int</span><span class="pln"> LED_PIN </span><span class="pun">=</span><span class="pln"> </span><span class="lit">10</span><span class="pun">;</span><span class="pln">
- </span><span class="kwd">const</span><span class="pln"> </span><span class="kwd">int</span><span class="pln"> POT_PIN </span><span class="pun">=</span><span class="pln"> A0</span><span class="pun">;</span><span class="pln">
- </span><span class="kwd">const</span><span class="pln"> </span><span class="kwd">int</span><span class="pln"> SWITCH_PIN </span><span class="pun">=</span><span class="pln"> </span><span class="lit">3</span><span class="pun">;</span><span class="pln">
- </span><span class="kwd">const</span><span class="pln"> </span><span class="kwd">int</span><span class="pln"> RADIO_CE_PIN </span><span class="pun">=</span><span class="pln"> </span><span class="lit">7</span><span class="pun">;</span><span class="pln">
- </span><span class="kwd">const</span><span class="pln"> </span><span class="kwd">int</span><span class="pln"> RADIO_CSN_PIN </span><span class="pun">=</span><span class="pln"> </span><span class="lit">8</span><span class="pun">;</span><span class="pln">
- </span><span class="kwd">const</span><span class="pln"> </span><span class="kwd">int</span><span class="pln"> TENS_MATRIX_ADDR </span><span class="pun">=</span><span class="pln"> </span><span class="lit">0x70</span><span class="pun">;</span><span class="pln">
- </span><span class="kwd">const</span><span class="pln"> </span><span class="kwd">int</span><span class="pln"> ONES_MATRIX_ADDR </span><span class="pun">=</span><span class="pln"> </span><span class="lit">0x71</span><span class="pun">;</span><span class="pln">
- </span><span class="kwd">const</span><span class="pln"> </span><span class="kwd">int</span><span class="pln"> GRID_WIDTH </span><span class="pun">=</span><span class="pln"> </span><span class="lit">7</span><span class="pun">;</span><span class="pln">
- </span><span class="kwd">const</span><span class="pln"> </span><span class="kwd">int</span><span class="pln"> GRID_HEIGHT </span><span class="pun">=</span><span class="pln"> </span><span class="lit">7</span><span class="pun">;</span><span class="pln">
- </span><span class="kwd">const</span><span class="pln"> </span><span class="kwd">int</span><span class="pln"> DAY_MILLIS </span><span class="pun">=</span><span class="pln"> </span><span class="lit">86400000</span><span class="pun">;</span><span class="pln">
- </span><span class="com">// binary data for the 8x8 matrix images</span><span class="pln">
- </span><span class="kwd">const</span><span class="pln"> </span><span class="typ">uint64_t</span><span class="pln"> TENS_IMAGES</span><span class="pun">[]</span><span class="pln"> </span><span class="pun">=</span><span class="pln"> </span><span class="pun">{</span><span class="pln">
- </span><span class="lit">0x0000000000000000</span><span class="pun">,</span><span class="pln">
- </span><span class="lit">0x7020202020203020</span><span class="pun">,</span><span class="pln">
- </span><span class="lit">0xf810204080808870</span><span class="pun">,</span><span class="pln">
- </span><span class="lit">0x7088808060808870</span><span class="pun">,</span><span class="pln">
- </span><span class="lit">0x8080f88890a0c080</span><span class="pun">,</span><span class="pln">
- </span><span class="lit">0x70888080780808f8</span><span class="pun">,</span><span class="pln">
- </span><span class="lit">0x7088888878088870</span><span class="pun">,</span><span class="pln">
- </span><span class="lit">0x10101020408080f8</span><span class="pun">,</span><span class="pln">
- </span><span class="lit">0x7088888870888870</span><span class="pun">,</span><span class="pln">
- </span><span class="lit">0x708880f088888870</span><span class="pln">
- </span><span class="pun">};</span><span class="pln">
- </span><span class="kwd">const</span><span class="pln"> </span><span class="typ">uint64_t</span><span class="pln"> ONES_IMAGES</span><span class="pun">[]</span><span class="pln"> </span><span class="pun">=</span><span class="pln"> </span><span class="pun">{</span><span class="pln">
- </span><span class="lit">0x0e1111111111110e</span><span class="pun">,</span><span class="pln">
- </span><span class="lit">0x0e04040404040604</span><span class="pun">,</span><span class="pln">
- </span><span class="lit">0x1f0204081010110e</span><span class="pun">,</span><span class="pln">
- </span><span class="lit">0x0e1110100c10110e</span><span class="pun">,</span><span class="pln">
- </span><span class="lit">0x10101f1112141810</span><span class="pun">,</span><span class="pln">
- </span><span class="lit">0x0e1110100f01011f</span><span class="pun">,</span><span class="pln">
- </span><span class="lit">0x0e1111110f01110e</span><span class="pun">,</span><span class="pln">
- </span><span class="lit">0x020202040810101f</span><span class="pun">,</span><span class="pln">
- </span><span class="lit">0x0e1111110e11110e</span><span class="pun">,</span><span class="pln">
- </span><span class="lit">0x0e11101e1111110e</span><span class="pln">
- </span><span class="pun">};</span><span class="pln">
- </span><span class="com">// display one of the binary coded images</span><span class="pln">
- </span><span class="kwd">void</span><span class="pln"> displayImage</span><span class="pun">(</span><span class="typ">Adafruit_8x8matrix</span><span class="pln"> matrix</span><span class="pun">,</span><span class="pln"> </span><span class="typ">uint64_t</span><span class="pln"> image</span><span class="pun">)</span><span class="pln"> </span><span class="pun">{</span><span class="pln">
- matrix</span><span class="pun">.</span><span class="pln">clear</span><span class="pun">();</span><span class="pln">
- </span><span class="kwd">for</span><span class="pln"> </span><span class="pun">(</span><span class="kwd">int</span><span class="pln"> i </span><span class="pun">=</span><span class="pln"> </span><span class="lit">0</span><span class="pun">;</span><span class="pln"> i </span><span class="pun"><</span><span class="pln"> </span><span class="lit">8</span><span class="pun">;</span><span class="pln"> i</span><span class="pun">++)</span><span class="pln"> </span><span class="pun">{</span><span class="pln">
- </span><span class="kwd">byte</span><span class="pln"> row </span><span class="pun">=</span><span class="pln"> </span><span class="pun">(</span><span class="pln">image </span><span class="pun">>></span><span class="pln"> i </span><span class="pun">*</span><span class="pln"> </span><span class="lit">8</span><span class="pun">)</span><span class="pln"> </span><span class="pun">&</span><span class="pln"> </span><span class="lit">0xFF</span><span class="pun">;</span><span class="pln">
- </span><span class="kwd">for</span><span class="pln"> </span><span class="pun">(</span><span class="kwd">int</span><span class="pln"> j </span><span class="pun">=</span><span class="pln"> </span><span class="lit">0</span><span class="pun">;</span><span class="pln"> j </span><span class="pun"><</span><span class="pln"> </span><span class="lit">8</span><span class="pun">;</span><span class="pln"> j</span><span class="pun">++)</span><span class="pln"> </span><span class="pun">{</span><span class="pln">
- matrix</span><span class="pun">.</span><span class="pln">drawPixel</span><span class="pun">(</span><span class="pln">i</span><span class="pun">,</span><span class="pln"> </span><span class="lit">7</span><span class="pln"> </span><span class="pun">-</span><span class="pln"> j</span><span class="pun">,</span><span class="pln"> bitRead</span><span class="pun">(</span><span class="pln">row</span><span class="pun">,</span><span class="pln"> j</span><span class="pun">));</span><span class="pln">
- </span><span class="pun">}</span><span class="pln">
- </span><span class="pun">}</span><span class="pln">
- matrix</span><span class="pun">.</span><span class="pln">writeDisplay</span><span class="pun">();</span><span class="pln">
- </span><span class="pun">}</span><span class="pln">
- </span><span class="com">// convert from (x, y) to an LED index on the strip</span><span class="pln">
- </span><span class="kwd">int</span><span class="pln"> getLEDnum</span><span class="pun">(</span><span class="kwd">int</span><span class="pln"> x</span><span class="pun">,</span><span class="pln"> </span><span class="kwd">int</span><span class="pln"> y</span><span class="pun">)</span><span class="pln"> </span><span class="pun">{</span><span class="pln">
- </span><span class="kwd">if</span><span class="pln"> </span><span class="pun">(</span><span class="pln">y </span><span class="pun">%</span><span class="pln"> </span><span class="lit">2</span><span class="pln"> </span><span class="pun">==</span><span class="pln"> </span><span class="lit">0</span><span class="pun">)</span><span class="pln"> </span><span class="pun">{</span><span class="pln">
- </span><span class="kwd">return</span><span class="pln"> </span><span class="pun">(</span><span class="lit">6</span><span class="pln"> </span><span class="pun">-</span><span class="pln"> x</span><span class="pun">)</span><span class="pln"> </span><span class="pun">+</span><span class="pln"> </span><span class="lit">7</span><span class="pln"> </span><span class="pun">*</span><span class="pln"> y</span><span class="pun">;</span><span class="pln">
- </span><span class="pun">}</span><span class="pln">
- </span><span class="kwd">else</span><span class="pln"> </span><span class="pun">{</span><span class="pln">
- </span><span class="kwd">return</span><span class="pln"> x </span><span class="pun">+</span><span class="pln"> </span><span class="lit">7</span><span class="pln"> </span><span class="pun">*</span><span class="pln"> y</span><span class="pun">;</span><span class="pln">
- </span><span class="pun">}</span><span class="pln">
- </span><span class="pun">}</span><span class="pln">
- </span><span class="com">// convert from a speed to a bar graph height</span><span class="pln">
- </span><span class="kwd">int</span><span class="pln"> getYval</span><span class="pun">(</span><span class="kwd">int</span><span class="pln"> currentSpeed</span><span class="pun">)</span><span class="pln"> </span><span class="pun">{</span><span class="pln">
- </span><span class="kwd">if</span><span class="pln"> </span><span class="pun">(</span><span class="pln">currentSpeed </span><span class="pun"><=</span><span class="pln"> </span><span class="lit">5</span><span class="pun">)</span><span class="pln"> </span><span class="pun">{</span><span class="pln">
- </span><span class="kwd">return</span><span class="pln"> </span><span class="lit">0</span><span class="pun">;</span><span class="pln">
- </span><span class="pun">}</span><span class="pln"> </span><span class="kwd">else</span><span class="pln"> </span><span class="kwd">if</span><span class="pln"> </span><span class="pun">(</span><span class="pln">currentSpeed </span><span class="pun"><=</span><span class="pln"> </span><span class="lit">15</span><span class="pun">)</span><span class="pln"> </span><span class="pun">{</span><span class="pln">
- </span><span class="kwd">return</span><span class="pln"> </span><span class="lit">1</span><span class="pun">;</span><span class="pln">
- </span><span class="pun">}</span><span class="pln"> </span><span class="kwd">else</span><span class="pln"> </span><span class="kwd">if</span><span class="pln"> </span><span class="pun">(</span><span class="pln">currentSpeed </span><span class="pun"><=</span><span class="pln"> </span><span class="lit">25</span><span class="pun">)</span><span class="pln"> </span><span class="pun">{</span><span class="pln">
- </span><span class="kwd">return</span><span class="pln"> </span><span class="lit">2</span><span class="pun">;</span><span class="pln">
- </span><span class="pun">}</span><span class="pln"> </span><span class="kwd">else</span><span class="pln"> </span><span class="kwd">if</span><span class="pln"> </span><span class="pun">(</span><span class="pln">currentSpeed </span><span class="pun"><=</span><span class="pln"> </span><span class="lit">35</span><span class="pun">)</span><span class="pln"> </span><span class="pun">{</span><span class="pln">
- </span><span class="kwd">return</span><span class="pln"> </span><span class="lit">3</span><span class="pun">;</span><span class="pln">
- </span><span class="pun">}</span><span class="pln"> </span><span class="kwd">else</span><span class="pln"> </span><span class="kwd">if</span><span class="pln"> </span><span class="pun">(</span><span class="pln">currentSpeed </span><span class="pun"><=</span><span class="pln"> </span><span class="lit">45</span><span class="pun">)</span><span class="pln"> </span><span class="pun">{</span><span class="pln">
- </span><span class="kwd">return</span><span class="pln"> </span><span class="lit">4</span><span class="pun">;</span><span class="pln">
- </span><span class="pun">}</span><span class="pln"> </span><span class="kwd">else</span><span class="pln"> </span><span class="kwd">if</span><span class="pln"> </span><span class="pun">(</span><span class="pln">currentSpeed </span><span class="pun"><=</span><span class="pln"> </span><span class="lit">55</span><span class="pun">)</span><span class="pln"> </span><span class="pun">{</span><span class="pln">
- </span><span class="kwd">return</span><span class="pln"> </span><span class="lit">5</span><span class="pun">;</span><span class="pln">
- </span><span class="pun">}</span><span class="pln"> </span><span class="kwd">else</span><span class="pln"> </span><span class="pun">{</span><span class="pln">
- </span><span class="kwd">return</span><span class="pln"> </span><span class="lit">6</span><span class="pun">;</span><span class="pln">
- </span><span class="pun">}</span><span class="pln">
- </span><span class="pun">}</span><span class="pln">
- </span><span class="com">// color coding (red, yellow, green)</span><span class="pln">
- rgb_color getColor</span><span class="pun">(</span><span class="kwd">int</span><span class="pln"> y</span><span class="pun">)</span><span class="pln"> </span><span class="pun">{</span><span class="pln">
- </span><span class="kwd">if</span><span class="pln"> </span><span class="pun">(</span><span class="pln">y </span><span class="pun">==</span><span class="pln"> </span><span class="lit">6</span><span class="pun">)</span><span class="pln"> </span><span class="pun">{</span><span class="pln">
- </span><span class="kwd">return</span><span class="pln"> rgb_color</span><span class="pun">(</span><span class="lit">255</span><span class="pun">,</span><span class="lit">0</span><span class="pun">,</span><span class="lit">0</span><span class="pun">);</span><span class="pln">
- </span><span class="pun">}</span><span class="pln"> </span><span class="kwd">else</span><span class="pln"> </span><span class="kwd">if</span><span class="pln"> </span><span class="pun">(</span><span class="pln">y </span><span class="pun">==</span><span class="pln"> </span><span class="lit">5</span><span class="pun">)</span><span class="pln"> </span><span class="pun">{</span><span class="pln">
- </span><span class="kwd">return</span><span class="pln"> rgb_color</span><span class="pun">(</span><span class="lit">255</span><span class="pun">,</span><span class="lit">0</span><span class="pun">,</span><span class="lit">0</span><span class="pun">);</span><span class="pln">
- </span><span class="pun">}</span><span class="pln"> </span><span class="kwd">else</span><span class="pln"> </span><span class="kwd">if</span><span class="pln"> </span><span class="pun">(</span><span class="pln">y </span><span class="pun">==</span><span class="pln"> </span><span class="lit">4</span><span class="pun">)</span><span class="pln"> </span><span class="pun">{</span><span class="pln">
- </span><span class="kwd">return</span><span class="pln"> rgb_color</span><span class="pun">(</span><span class="lit">255</span><span class="pun">,</span><span class="lit">255</span><span class="pun">,</span><span class="lit">0</span><span class="pun">);</span><span class="pln">
- </span><span class="pun">}</span><span class="pln"> </span><span class="kwd">else</span><span class="pln"> </span><span class="kwd">if</span><span class="pln"> </span><span class="pun">(</span><span class="pln">y </span><span class="pun">==</span><span class="pln"> </span><span class="lit">3</span><span class="pun">)</span><span class="pln"> </span><span class="pun">{</span><span class="pln">
- </span><span class="kwd">return</span><span class="pln"> rgb_color</span><span class="pun">(</span><span class="lit">255</span><span class="pun">,</span><span class="lit">255</span><span class="pun">,</span><span class="lit">0</span><span class="pun">);</span><span class="pln">
- </span><span class="pun">}</span><span class="pln"> </span><span class="kwd">else</span><span class="pln"> </span><span class="kwd">if</span><span class="pln"> </span><span class="pun">(</span><span class="pln">y </span><span class="pun">==</span><span class="pln"> </span><span class="lit">2</span><span class="pun">)</span><span class="pln"> </span><span class="pun">{</span><span class="pln">
- </span><span class="kwd">return</span><span class="pln"> rgb_color</span><span class="pun">(</span><span class="lit">255</span><span class="pun">,</span><span class="lit">255</span><span class="pun">,</span><span class="lit">0</span><span class="pun">);</span><span class="pln">
- </span><span class="pun">}</span><span class="pln"> </span><span class="kwd">else</span><span class="pln"> </span><span class="kwd">if</span><span class="pln"> </span><span class="pun">(</span><span class="pln">y </span><span class="pun">==</span><span class="pln"> </span><span class="lit">1</span><span class="pun">)</span><span class="pln"> </span><span class="pun">{</span><span class="pln">
- </span><span class="kwd">return</span><span class="pln"> rgb_color</span><span class="pun">(</span><span class="lit">0</span><span class="pun">,</span><span class="lit">255</span><span class="pun">,</span><span class="lit">0</span><span class="pun">);</span><span class="pln">
- </span><span class="pun">}</span><span class="pln"> </span><span class="kwd">else</span><span class="pln"> </span><span class="pun">{</span><span class="pln">
- </span><span class="kwd">return</span><span class="pln"> rgb_color</span><span class="pun">(</span><span class="lit">0</span><span class="pun">,</span><span class="lit">255</span><span class="pun">,</span><span class="lit">0</span><span class="pun">);</span><span class="pln">
- </span><span class="pun">}</span><span class="pln">
- </span><span class="pun">}</span><span class="pln">
- </span><span class="com">// global variables</span><span class="pln">
- RF24 radio</span><span class="pun">(</span><span class="pln">RADIO_CE_PIN</span><span class="pun">,</span><span class="pln"> RADIO_CSN_PIN</span><span class="pun">);</span><span class="pln">
- </span><span class="kwd">const</span><span class="pln"> </span><span class="kwd">byte</span><span class="pln"> address</span><span class="pun">[</span><span class="lit">6</span><span class="pun">]</span><span class="pln"> </span><span class="pun">=</span><span class="pln"> </span><span class="str">"00001"</span><span class="pun">;</span><span class="pln">
- </span><span class="typ">Adafruit_TiCoServo</span><span class="pln"> servo</span><span class="pun">;</span><span class="pln">
- </span><span class="typ">PololuLedStrip</span><span class="pun"><</span><span class="pln">LED_PIN</span><span class="pun">></span><span class="pln"> ledStrip</span><span class="pun">;</span><span class="pln">
- rgb_color colors</span><span class="pun">[</span><span class="pln">LED_COUNT</span><span class="pun">];</span><span class="pln">
- </span><span class="typ">Adafruit_8x8matrix</span><span class="pln"> tensMatrix </span><span class="pun">=</span><span class="pln"> </span><span class="typ">Adafruit_8x8matrix</span><span class="pun">();</span><span class="pln">
- </span><span class="typ">Adafruit_8x8matrix</span><span class="pln"> onesMatrix </span><span class="pun">=</span><span class="pln"> </span><span class="typ">Adafruit_8x8matrix</span><span class="pun">();</span><span class="pln">
- </span><span class="com">// history for bar graph</span><span class="pln">
- </span><span class="kwd">int</span><span class="pln"> maxRecentVals</span><span class="pun">[</span><span class="pln">GRID_WIDTH</span><span class="pun">];</span><span class="pln">
- </span><span class="com">// toggle for line graph/bar graph</span><span class="pln">
- </span><span class="kwd">bool</span><span class="pln"> isLineGraph </span><span class="pun">=</span><span class="pln"> </span><span class="kwd">false</span><span class="pun">;</span><span class="pln">
- </span><span class="com">// interval to shift bar graph</span><span class="pln">
- </span><span class="kwd">unsigned</span><span class="pln"> </span><span class="kwd">long</span><span class="pln"> graphShiftInterval </span><span class="pun">=</span><span class="pln"> </span><span class="lit">1000</span><span class="pun">;</span><span class="pln"> </span><span class="com">// in ms</span><span class="pln">
- </span><span class="com">// timer for bar graph shift</span><span class="pln">
- </span><span class="kwd">unsigned</span><span class="pln"> </span><span class="kwd">long</span><span class="pln"> loopStartTime</span><span class="pun">;</span><span class="pln">
- </span><span class="com">// variables to track peak speed</span><span class="pln">
- </span><span class="kwd">int</span><span class="pln"> currentSpeed</span><span class="pun">,</span><span class="pln"> peakcurrentSpeed</span><span class="pun">;</span><span class="pln">
- </span><span class="kwd">unsigned</span><span class="pln"> </span><span class="kwd">long</span><span class="pln"> peakcurrentSpeedTime</span><span class="pun">;</span><span class="pln">
- </span><span class="com">// servo angle</span><span class="pln">
- </span><span class="kwd">int</span><span class="pln"> motorAngle </span><span class="pun">=</span><span class="pln"> </span><span class="lit">0</span><span class="pun">;</span><span class="pln">
- </span><span class="kwd">void</span><span class="pln"> setup</span><span class="pun">()</span><span class="pln"> </span><span class="pun">{</span><span class="pln">
- </span><span class="typ">Serial</span><span class="pun">.</span><span class="kwd">begin</span><span class="pun">(</span><span class="lit">9600</span><span class="pun">);</span><span class="pln">
- pinMode</span><span class="pun">(</span><span class="pln">POT_PIN</span><span class="pun">,</span><span class="pln"> INPUT</span><span class="pun">);</span><span class="pln">
- pinMode</span><span class="pun">(</span><span class="pln">SWITCH_PIN</span><span class="pun">,</span><span class="pln"> INPUT_PULLUP</span><span class="pun">);</span><span class="pln">
- servo</span><span class="pun">.</span><span class="pln">attach</span><span class="pun">(</span><span class="pln">SERVO_PIN</span><span class="pun">);</span><span class="pln">
- tensMatrix</span><span class="pun">.</span><span class="kwd">begin</span><span class="pun">(</span><span class="pln">TENS_MATRIX_ADDR</span><span class="pun">);</span><span class="pln">
- onesMatrix</span><span class="pun">.</span><span class="kwd">begin</span><span class="pun">(</span><span class="pln">ONES_MATRIX_ADDR</span><span class="pun">);</span><span class="pln">
- loopStartTime </span><span class="pun">=</span><span class="pln"> millis</span><span class="pun">();</span><span class="pln">
- radio</span><span class="pun">.</span><span class="kwd">begin</span><span class="pun">();</span><span class="pln">
- radio</span><span class="pun">.</span><span class="pln">openReadingPipe</span><span class="pun">(</span><span class="lit">0</span><span class="pun">,</span><span class="pln"> address</span><span class="pun">);</span><span class="pln">
- radio</span><span class="pun">.</span><span class="pln">setPALevel</span><span class="pun">(</span><span class="pln">RF24_PA_HIGH</span><span class="pun">);</span><span class="pln">
- radio</span><span class="pun">.</span><span class="pln">startListening</span><span class="pun">();</span><span class="pln">
- </span><span class="kwd">for</span><span class="pln"> </span><span class="pun">(</span><span class="kwd">int</span><span class="pln"> i </span><span class="pun">=</span><span class="pln"> </span><span class="lit">0</span><span class="pun">;</span><span class="pln"> i </span><span class="pun"><</span><span class="pln"> GRID_WIDTH</span><span class="pun">;</span><span class="pln"> i</span><span class="pun">++)</span><span class="pln"> maxRecentVals</span><span class="pun">[</span><span class="pln">i</span><span class="pun">]</span><span class="pln"> </span><span class="pun">=</span><span class="pln"> </span><span class="lit">0</span><span class="pun">;</span><span class="pln">
- </span><span class="pun">}</span><span class="pln">
- </span><span class="kwd">void</span><span class="pln"> loop</span><span class="pun">()</span><span class="pln"> </span><span class="pun">{</span><span class="pln">
- </span><span class="com">// get radio input from transmitter</span><span class="pln">
- </span><span class="kwd">if</span><span class="pln"> </span><span class="pun">(</span><span class="pln">radio</span><span class="pun">.</span><span class="pln">available</span><span class="pun">())</span><span class="pln"> </span><span class="pun">{</span><span class="pln">
- </span><span class="kwd">int</span><span class="pln"> anemometerVal </span><span class="pun">=</span><span class="pln"> </span><span class="lit">77</span><span class="pun">;</span><span class="pln">
- radio</span><span class="pun">.</span><span class="pln">read</span><span class="pun">(&</span><span class="pln">anemometerVal</span><span class="pun">,</span><span class="pln"> </span><span class="kwd">sizeof</span><span class="pun">(</span><span class="pln">anemometerVal</span><span class="pun">));</span><span class="pln">
- </span><span class="com">// convert raw analog value to wind speed in mph</span><span class="pln">
- currentSpeed </span><span class="pun">=</span><span class="pln"> map</span><span class="pun">(</span><span class="pln">anemometerVal</span><span class="pun">,</span><span class="pln"> </span><span class="lit">77</span><span class="pun">,</span><span class="pln"> </span><span class="lit">412</span><span class="pun">,</span><span class="pln"> </span><span class="lit">0</span><span class="pun">,</span><span class="pln"> </span><span class="lit">72</span><span class="pun">);</span><span class="pln">
- </span><span class="pun">}</span><span class="pln">
- </span><span class="com">// track daily peak speed</span><span class="pln">
- </span><span class="kwd">if</span><span class="pln"> </span><span class="pun">(</span><span class="pln">currentSpeed </span><span class="pun">></span><span class="pln"> peakcurrentSpeed </span><span class="pun">||</span><span class="pln"> millis</span><span class="pun">()</span><span class="pln"> </span><span class="pun">-</span><span class="pln"> peakcurrentSpeedTime </span><span class="pun">></span><span class="pln"> DAY_MILLIS</span><span class="pun">)</span><span class="pln"> </span><span class="pun">{</span><span class="pln">
- peakcurrentSpeed </span><span class="pun">=</span><span class="pln"> currentSpeed</span><span class="pun">;</span><span class="pln">
- peakcurrentSpeedTime </span><span class="pun">=</span><span class="pln"> millis</span><span class="pun">();</span><span class="pln">
- </span><span class="pun">}</span><span class="pln">
- </span><span class="com">// get graph shift interval</span><span class="pln">
- </span><span class="kwd">int</span><span class="pln"> potVal </span><span class="pun">=</span><span class="pln"> analogRead</span><span class="pun">(</span><span class="pln">POT_PIN</span><span class="pun">);</span><span class="pln">
- </span><span class="com">// map to 1 minute - 10 minute range</span><span class="pln">
- </span><span class="kwd">unsigned</span><span class="pln"> </span><span class="kwd">long</span><span class="pln"> graphShiftInterval </span><span class="pun">=</span><span class="pln"> map</span><span class="pun">(</span><span class="pln">potVal</span><span class="pun">,</span><span class="pln"> </span><span class="lit">0</span><span class="pun">,</span><span class="pln"> </span><span class="lit">1023</span><span class="pun">,</span><span class="pln"> </span><span class="lit">60000</span><span class="pun">,</span><span class="pln"> </span><span class="lit">600000</span><span class="pun">);</span><span class="pln">
- </span><span class="kwd">int</span><span class="pln"> prevMotorAngle </span><span class="pun">=</span><span class="pln"> motorAngle</span><span class="pun">;</span><span class="pln">
- </span><span class="com">// convert speed to angle</span><span class="pln">
- motorAngle </span><span class="pun">=</span><span class="pln"> map</span><span class="pun">(</span><span class="pln">peakcurrentSpeed</span><span class="pun">,</span><span class="pln"> </span><span class="lit">0</span><span class="pun">,</span><span class="pln"> </span><span class="lit">70</span><span class="pun">,</span><span class="pln"> </span><span class="lit">15</span><span class="pun">,</span><span class="pln"> </span><span class="lit">180</span><span class="pun">);</span><span class="pln">
- </span><span class="com">// only write to servo on angle change</span><span class="pln">
- </span><span class="kwd">if</span><span class="pln"> </span><span class="pun">(</span><span class="pln">motorAngle </span><span class="pun">!=</span><span class="pln"> prevMotorAngle</span><span class="pun">)</span><span class="pln"> servo</span><span class="pun">.</span><span class="pln">write</span><span class="pun">(</span><span class="pln">motorAngle</span><span class="pun">);</span><span class="pln">
- </span><span class="com">// shift graph</span><span class="pln">
- </span><span class="kwd">if</span><span class="pln"> </span><span class="pun">(</span><span class="pln">millis</span><span class="pun">()</span><span class="pln"> </span><span class="pun">-</span><span class="pln"> loopStartTime </span><span class="pun">></span><span class="pln"> graphShiftInterval</span><span class="pun">)</span><span class="pln"> </span><span class="pun">{</span><span class="pln">
- loopStartTime </span><span class="pun">=</span><span class="pln"> millis</span><span class="pun">();</span><span class="pln">
- </span><span class="kwd">for</span><span class="pln"> </span><span class="pun">(</span><span class="kwd">int</span><span class="pln"> i </span><span class="pun">=</span><span class="pln"> GRID_WIDTH </span><span class="pun">-</span><span class="pln"> </span><span class="lit">1</span><span class="pun">;</span><span class="pln"> i </span><span class="pun">></span><span class="pln"> </span><span class="lit">0</span><span class="pun">;</span><span class="pln"> i</span><span class="pun">--)</span><span class="pln"> </span><span class="pun">{</span><span class="pln">
- maxRecentVals</span><span class="pun">[</span><span class="pln">i</span><span class="pun">]</span><span class="pln"> </span><span class="pun">=</span><span class="pln"> maxRecentVals</span><span class="pun">[</span><span class="pln">i </span><span class="pun">-</span><span class="pln"> </span><span class="lit">1</span><span class="pun">];</span><span class="pln">
- </span><span class="pun">}</span><span class="pln">
- maxRecentVals</span><span class="pun">[</span><span class="lit">0</span><span class="pun">]</span><span class="pln"> </span><span class="pun">=</span><span class="pln"> </span><span class="lit">0</span><span class="pun">;</span><span class="pln">
- </span><span class="pun">}</span><span class="pln">
- </span><span class="com">// continuously update newest graph column</span><span class="pln">
- maxRecentVals</span><span class="pun">[</span><span class="lit">0</span><span class="pun">]</span><span class="pln"> </span><span class="pun">=</span><span class="pln"> max</span><span class="pun">(</span><span class="pln">currentSpeed</span><span class="pun">,</span><span class="pln"> maxRecentVals</span><span class="pun">[</span><span class="lit">0</span><span class="pun">]);</span><span class="pln">
- </span><span class="com">// clear LED strip</span><span class="pln">
- </span><span class="kwd">for</span><span class="pln"> </span><span class="pun">(</span><span class="kwd">int</span><span class="pln"> i </span><span class="pun">=</span><span class="pln"> </span><span class="lit">0</span><span class="pun">;</span><span class="pln"> i </span><span class="pun"><</span><span class="pln"> GRID_WIDTH </span><span class="pun">*</span><span class="pln"> GRID_HEIGHT</span><span class="pun">;</span><span class="pln"> i</span><span class="pun">++)</span><span class="pln">
- colors</span><span class="pun">[</span><span class="pln">i</span><span class="pun">]</span><span class="pln"> </span><span class="pun">=</span><span class="pln"> rgb_color</span><span class="pun">(</span><span class="lit">0</span><span class="pun">,</span><span class="pln"> </span><span class="lit">0</span><span class="pun">,</span><span class="pln"> </span><span class="lit">0</span><span class="pun">);</span><span class="pln">
- </span><span class="com">// display bar graph</span><span class="pln">
- isLineGraph </span><span class="pun">=</span><span class="pln"> digitalRead</span><span class="pun">(</span><span class="pln">SWITCH_PIN</span><span class="pun">);</span><span class="pln">
- </span><span class="kwd">for</span><span class="pln"> </span><span class="pun">(</span><span class="kwd">int</span><span class="pln"> x </span><span class="pun">=</span><span class="pln"> </span><span class="lit">0</span><span class="pun">;</span><span class="pln"> x </span><span class="pun"><</span><span class="pln"> GRID_WIDTH</span><span class="pun">;</span><span class="pln"> x</span><span class="pun">++)</span><span class="pln"> </span><span class="pun">{</span><span class="pln">
- </span><span class="kwd">int</span><span class="pln"> val </span><span class="pun">=</span><span class="pln"> maxRecentVals</span><span class="pun">[</span><span class="pln">x</span><span class="pun">];</span><span class="pln">
- </span><span class="kwd">if</span><span class="pln"> </span><span class="pun">(</span><span class="pln">isLineGraph</span><span class="pun">)</span><span class="pln"> </span><span class="pun">{</span><span class="pln">
- </span><span class="kwd">int</span><span class="pln"> y </span><span class="pun">=</span><span class="pln"> getYval</span><span class="pun">(</span><span class="pln">maxRecentVals</span><span class="pun">[</span><span class="pln">x</span><span class="pun">]);</span><span class="pln">
- colors</span><span class="pun">[</span><span class="pln">getLEDnum</span><span class="pun">(</span><span class="pln">x</span><span class="pun">,</span><span class="pln">y</span><span class="pun">)]</span><span class="pln"> </span><span class="pun">=</span><span class="pln"> getColor</span><span class="pun">(</span><span class="pln">y</span><span class="pun">);</span><span class="pln">
- </span><span class="pun">}</span><span class="pln"> </span><span class="kwd">else</span><span class="pln"> </span><span class="pun">{</span><span class="pln">
- </span><span class="kwd">for</span><span class="pln"> </span><span class="pun">(</span><span class="kwd">int</span><span class="pln"> y </span><span class="pun">=</span><span class="pln"> </span><span class="lit">0</span><span class="pun">;</span><span class="pln"> y </span><span class="pun"><=</span><span class="pln"> getYval</span><span class="pun">(</span><span class="pln">val</span><span class="pun">);</span><span class="pln"> y</span><span class="pun">++)</span><span class="pln"> </span><span class="pun">{</span><span class="pln">
- colors</span><span class="pun">[</span><span class="pln">getLEDnum</span><span class="pun">(</span><span class="pln">x</span><span class="pun">,</span><span class="pln">y</span><span class="pun">)]</span><span class="pln"> </span><span class="pun">=</span><span class="pln"> getColor</span><span class="pun">(</span><span class="pln">y</span><span class="pun">);</span><span class="pln">
- </span><span class="pun">}</span><span class="pln">
- </span><span class="pun">}</span><span class="pln">
- </span><span class="pun">}</span><span class="pln">
- ledStrip</span><span class="pun">.</span><span class="pln">write</span><span class="pun">(</span><span class="pln">colors</span><span class="pun">,</span><span class="pln"> LED_COUNT</span><span class="pun">);</span><span class="pln">
- </span><span class="com">// display instantaneous reading on 8x8 LEDs</span><span class="pln">
- </span><span class="kwd">int</span><span class="pln"> tensIndex </span><span class="pun">=</span><span class="pln"> </span><span class="pun">(</span><span class="pln">currentSpeed </span><span class="pun">/</span><span class="pln"> </span><span class="lit">10</span><span class="pun">)</span><span class="pln"> </span><span class="pun">%</span><span class="pln"> </span><span class="lit">10</span><span class="pun">;</span><span class="pln">
- </span><span class="kwd">int</span><span class="pln"> onesIndex </span><span class="pun">=</span><span class="pln"> currentSpeed </span><span class="pun">%</span><span class="pln"> </span><span class="lit">10</span><span class="pun">;</span><span class="pln">
- displayImage</span><span class="pun">(</span><span class="pln">tensMatrix</span><span class="pun">,</span><span class="pln"> TENS_IMAGES</span><span class="pun">[</span><span class="pln">tensIndex</span><span class="pun">]);</span><span class="pln">
- displayImage</span><span class="pun">(</span><span class="pln">onesMatrix</span><span class="pun">,</span><span class="pln"> ONES_IMAGES</span><span class="pun">[</span><span class="pln">onesIndex</span><span class="pun">]);</span><span class="pln">
- </span><span class="pun">}</span>
Comments are closed.