Introduction
Previously, we interviewed Peter about his typical day-to-day life and hobbies in order to get a better understanding of his interests and personality. Ultimately, his strong curiosity regarding the wind speed on his porch is what propelled us into our proposed solution for him: a personalized anemometer that would relay information relevant to his needs. An overview of this documentation is as follows:
- Prototype images + brief animation
- Major Challenges (Aesthetics and Functionality)
- Critique and Review from meeting again with Peter
- Next Steps
More about the initial interview and brainstorming can be found here: https://courses.ideate.cmu.edu/60-223/s2019/work/interviewing-peter/
Prototype
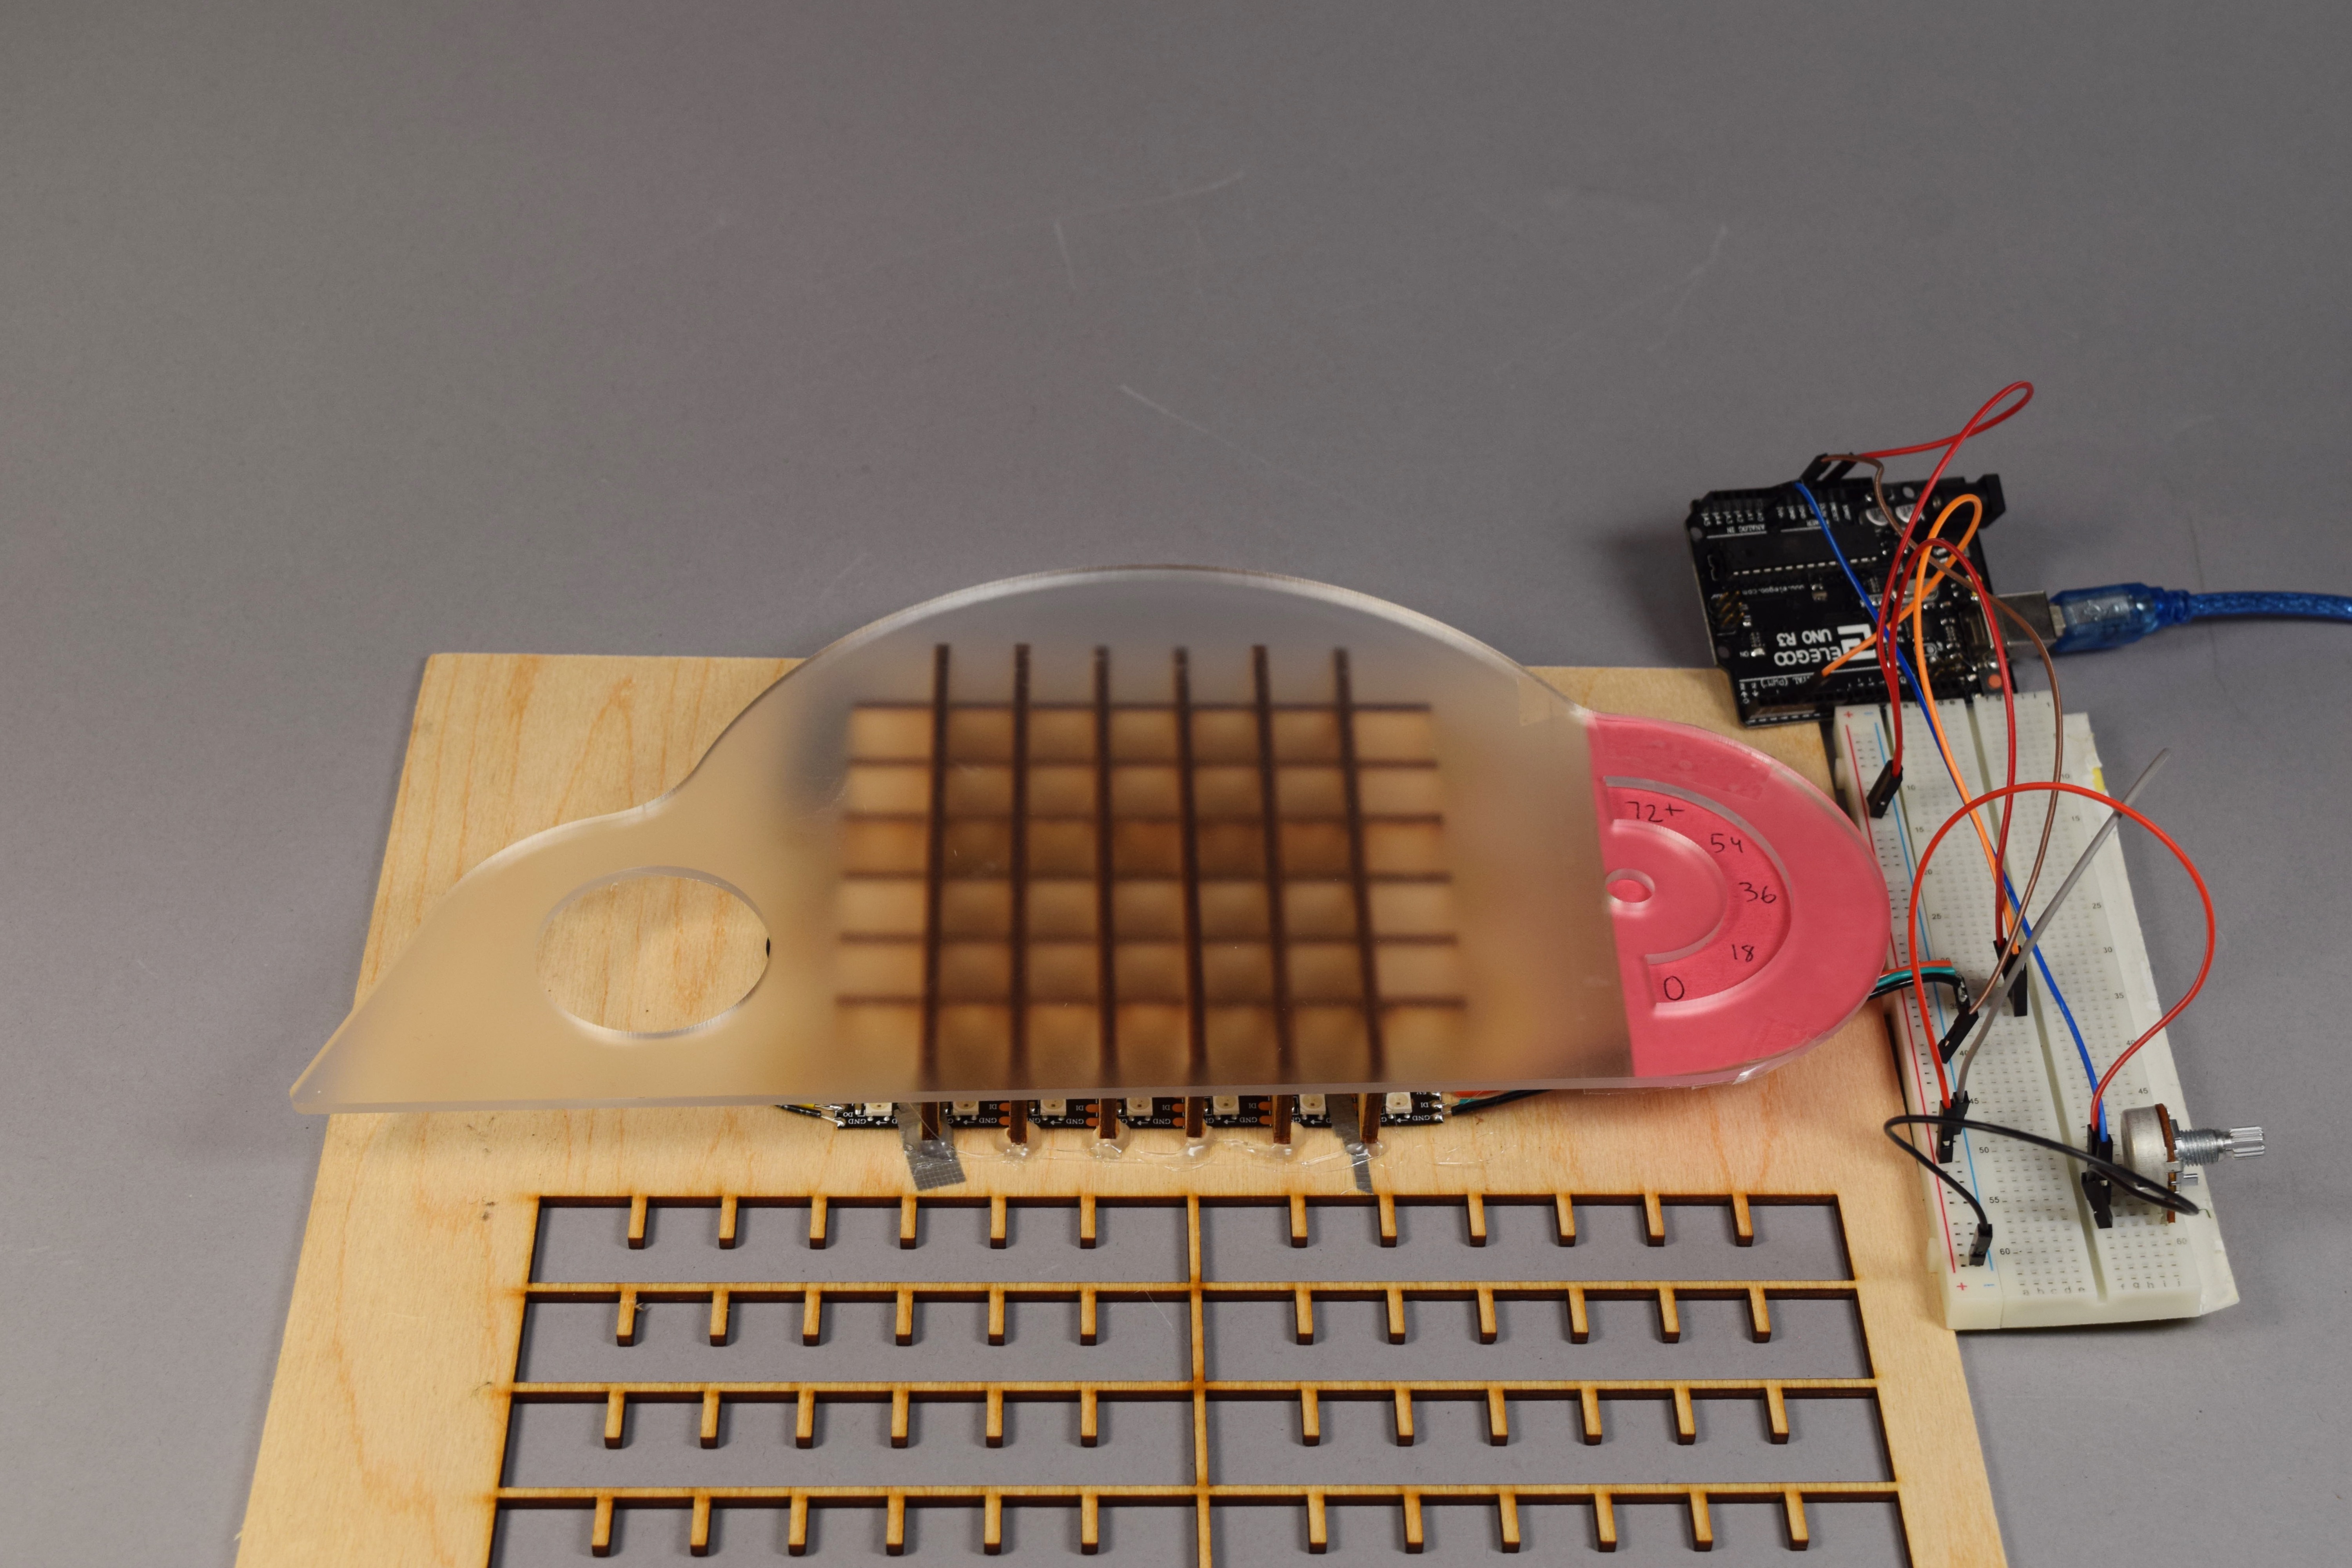
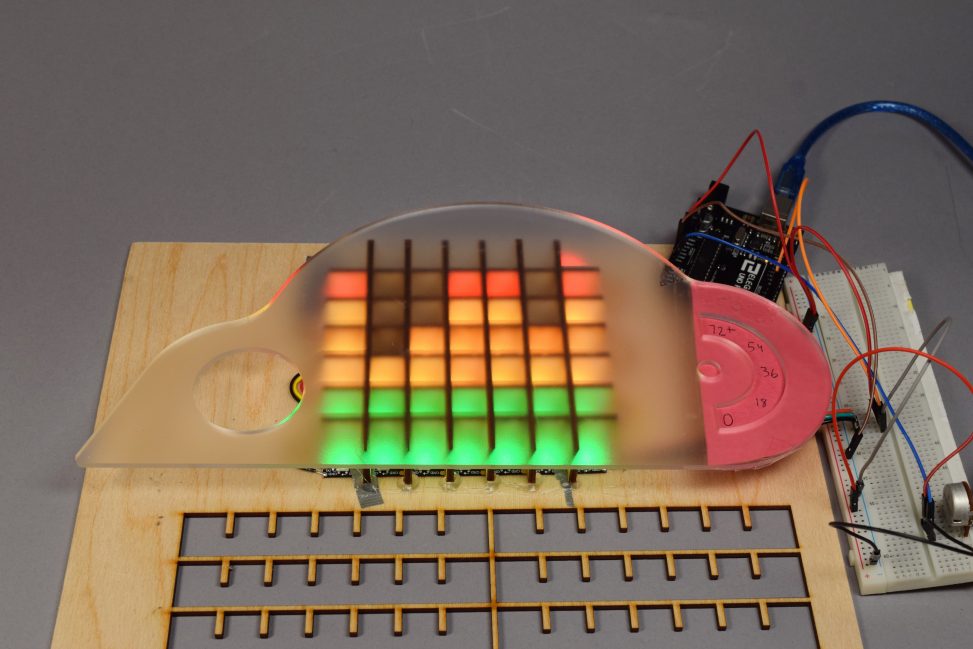
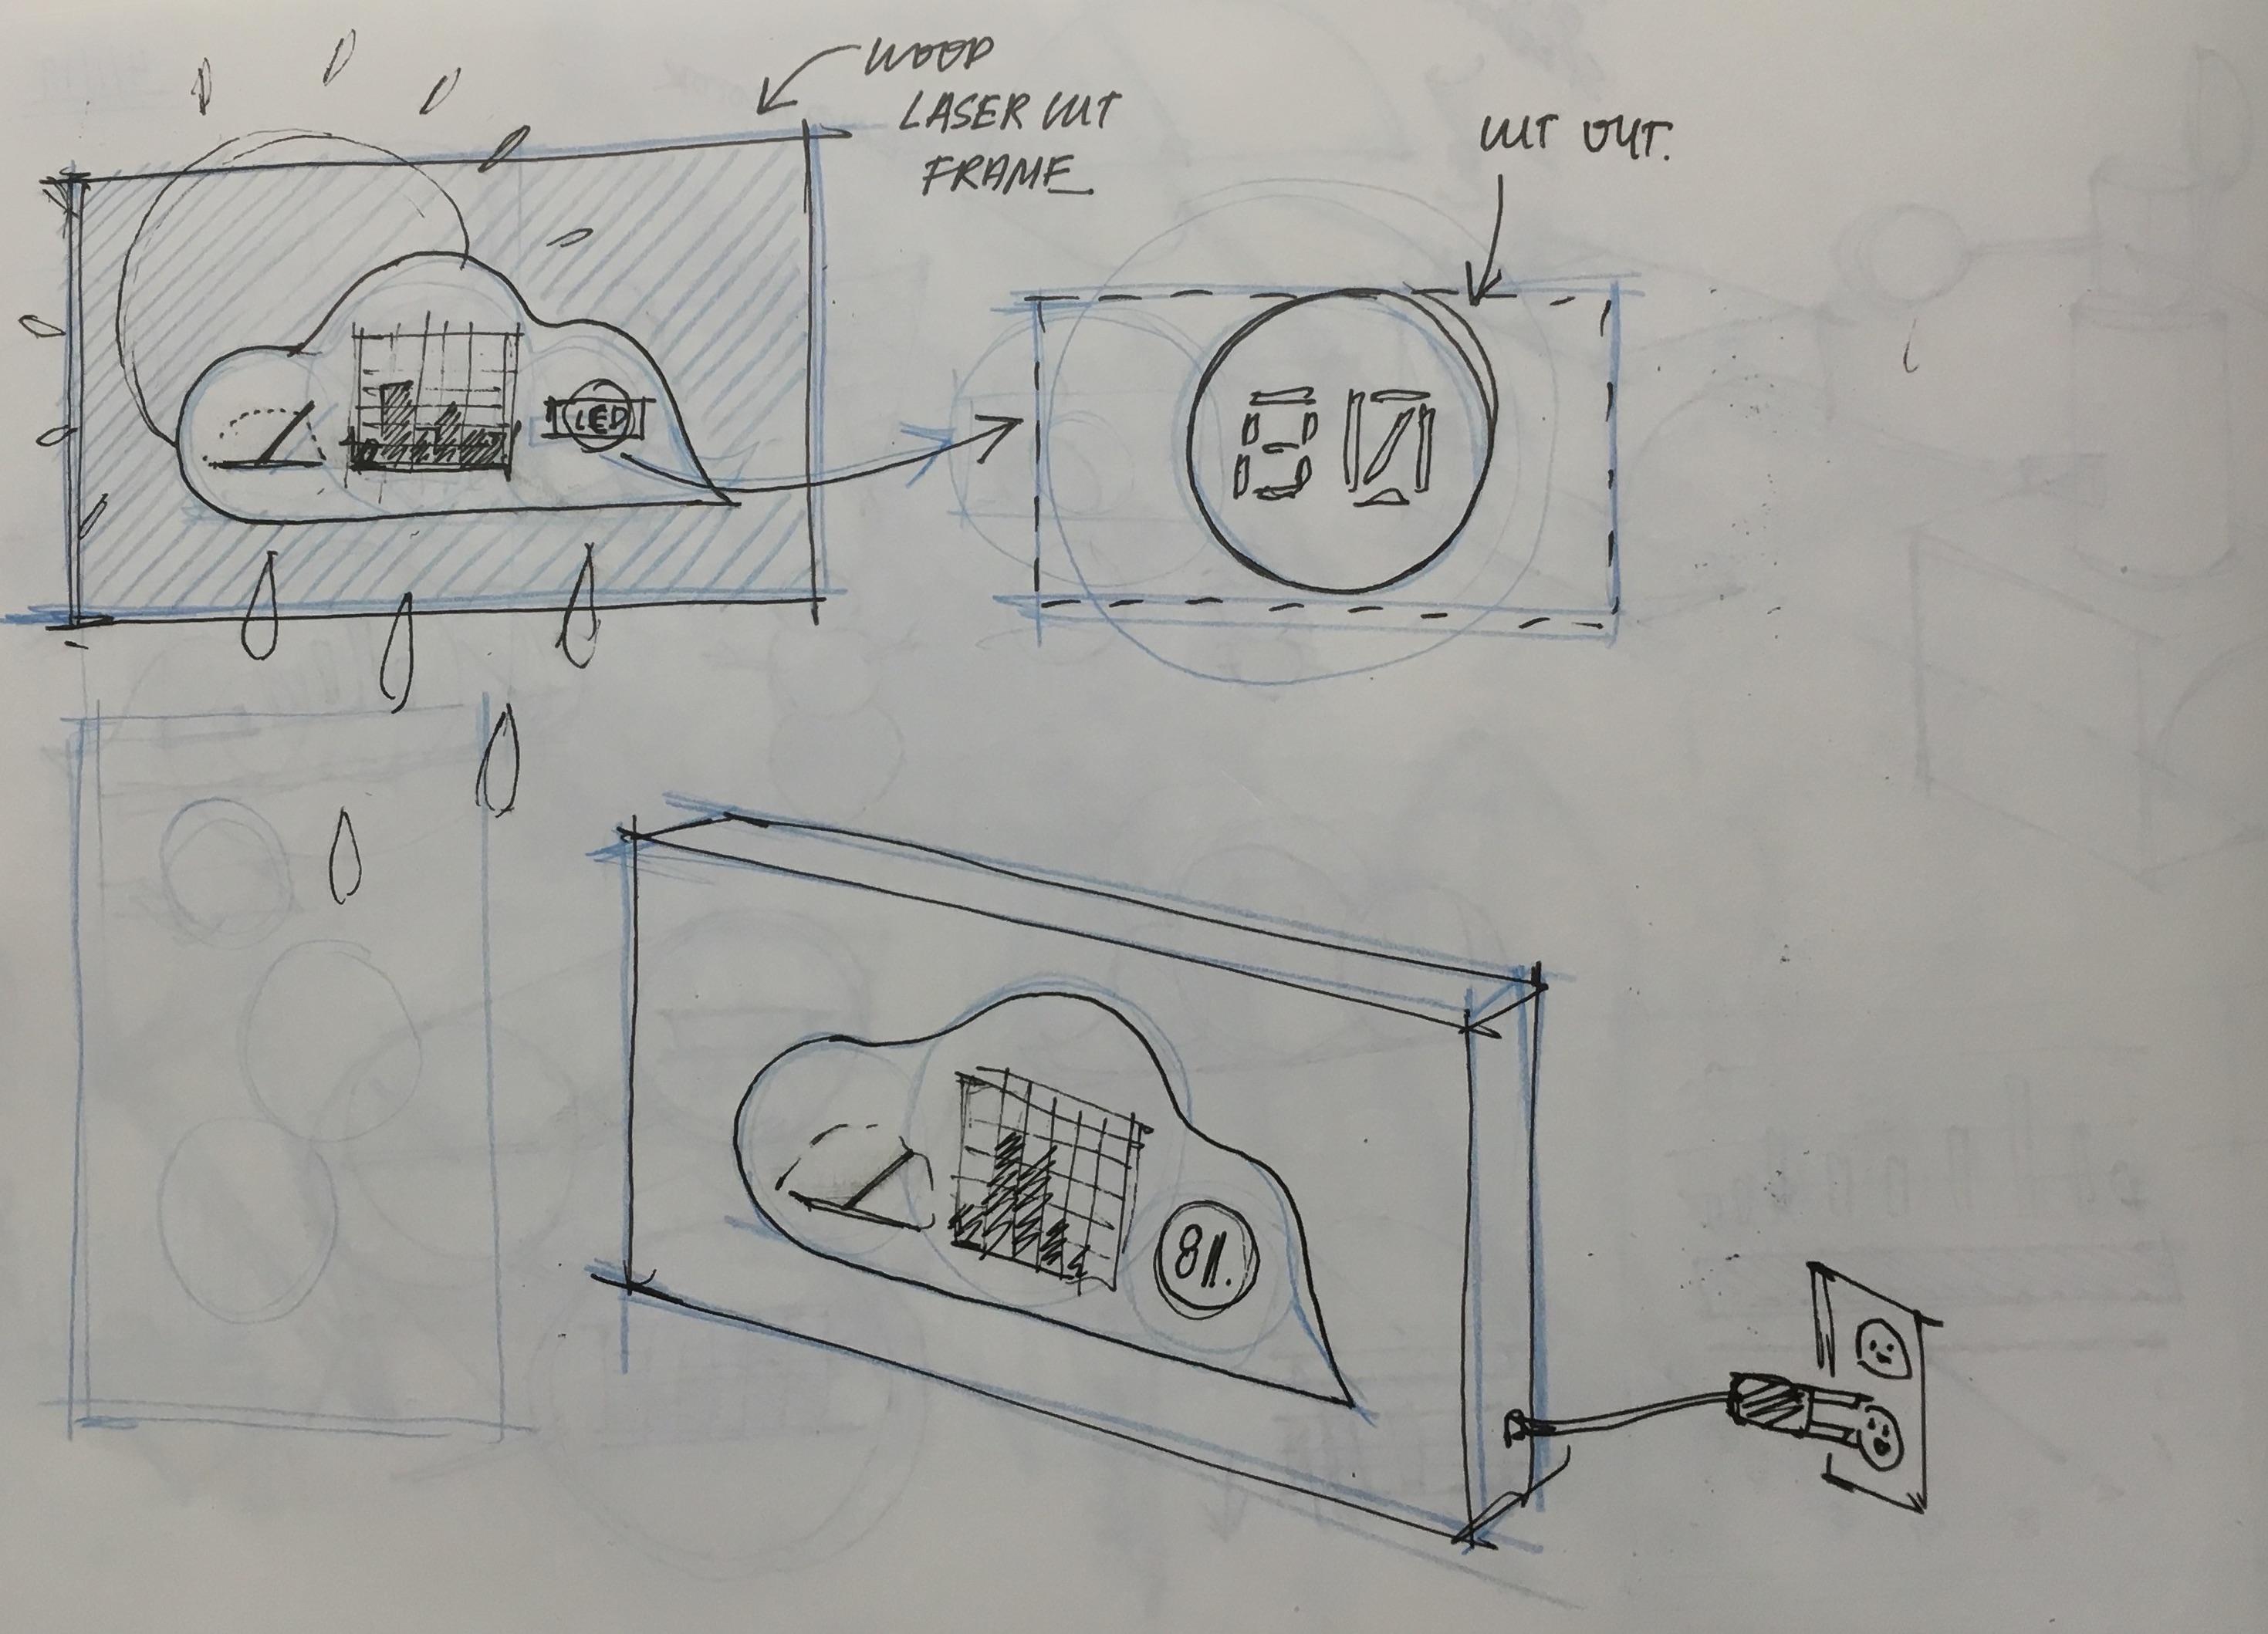
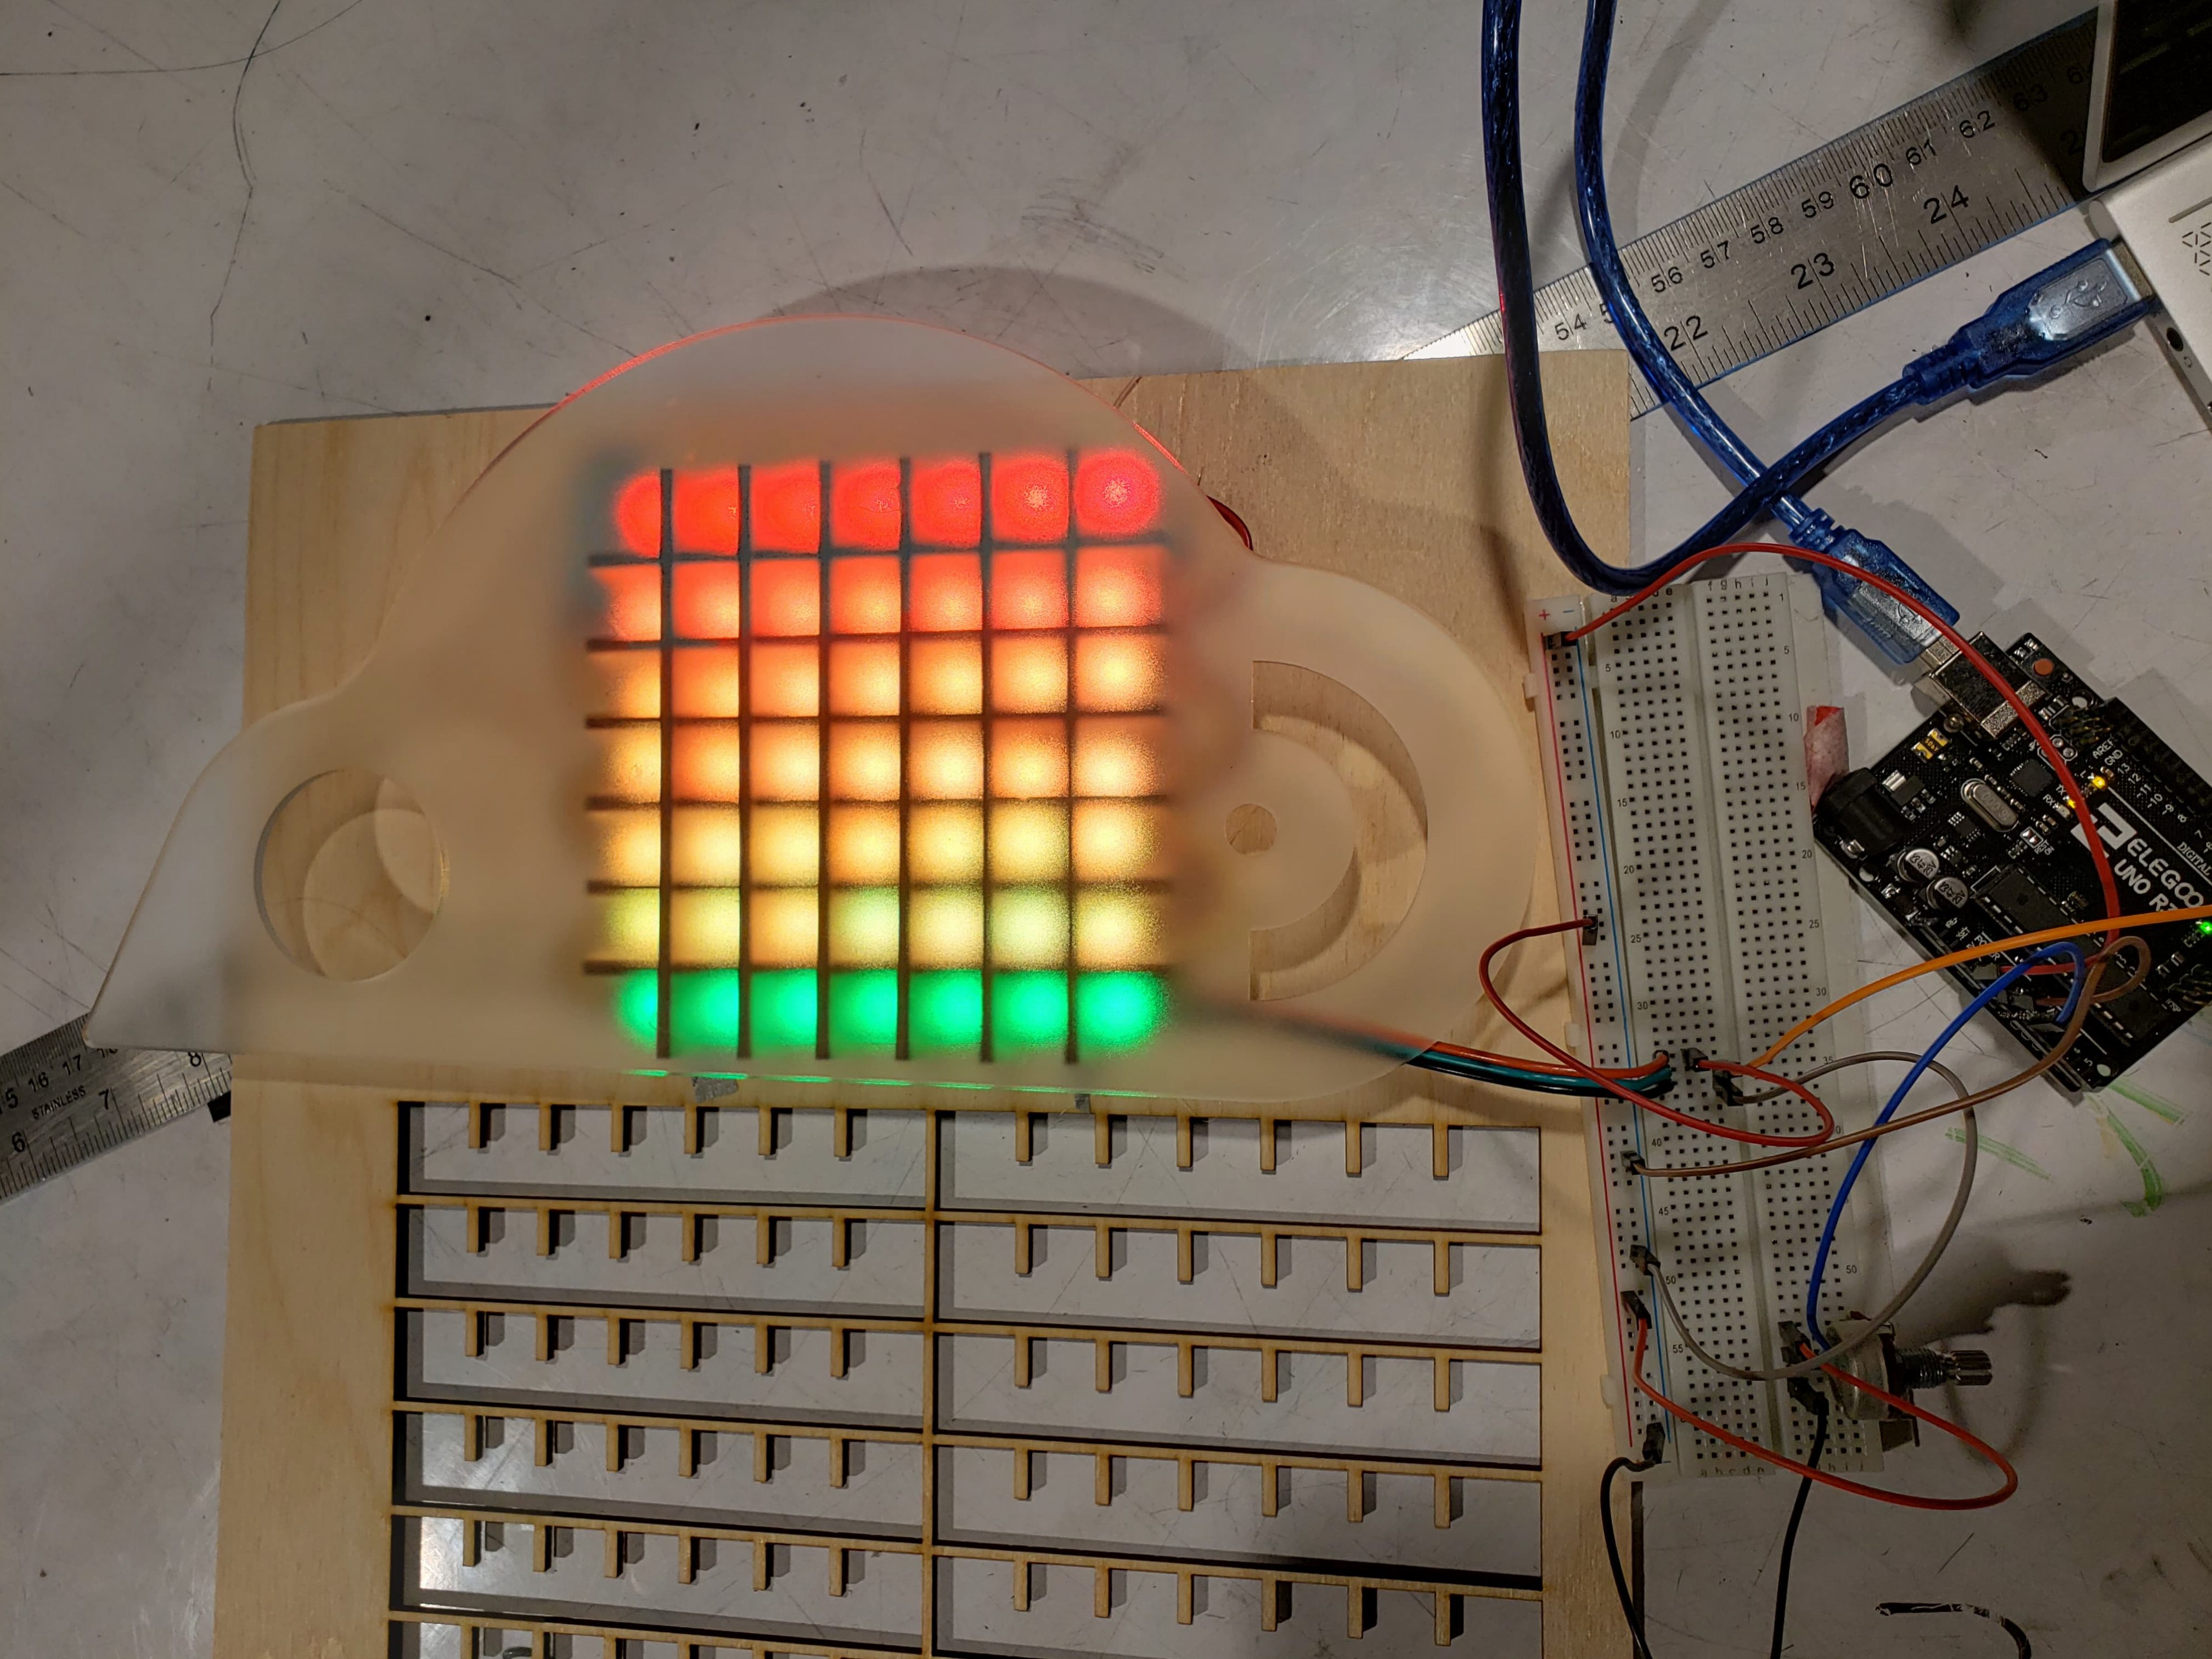
Cloud Prototype Process 1

Light up of wind speed over “N” amount of minutes
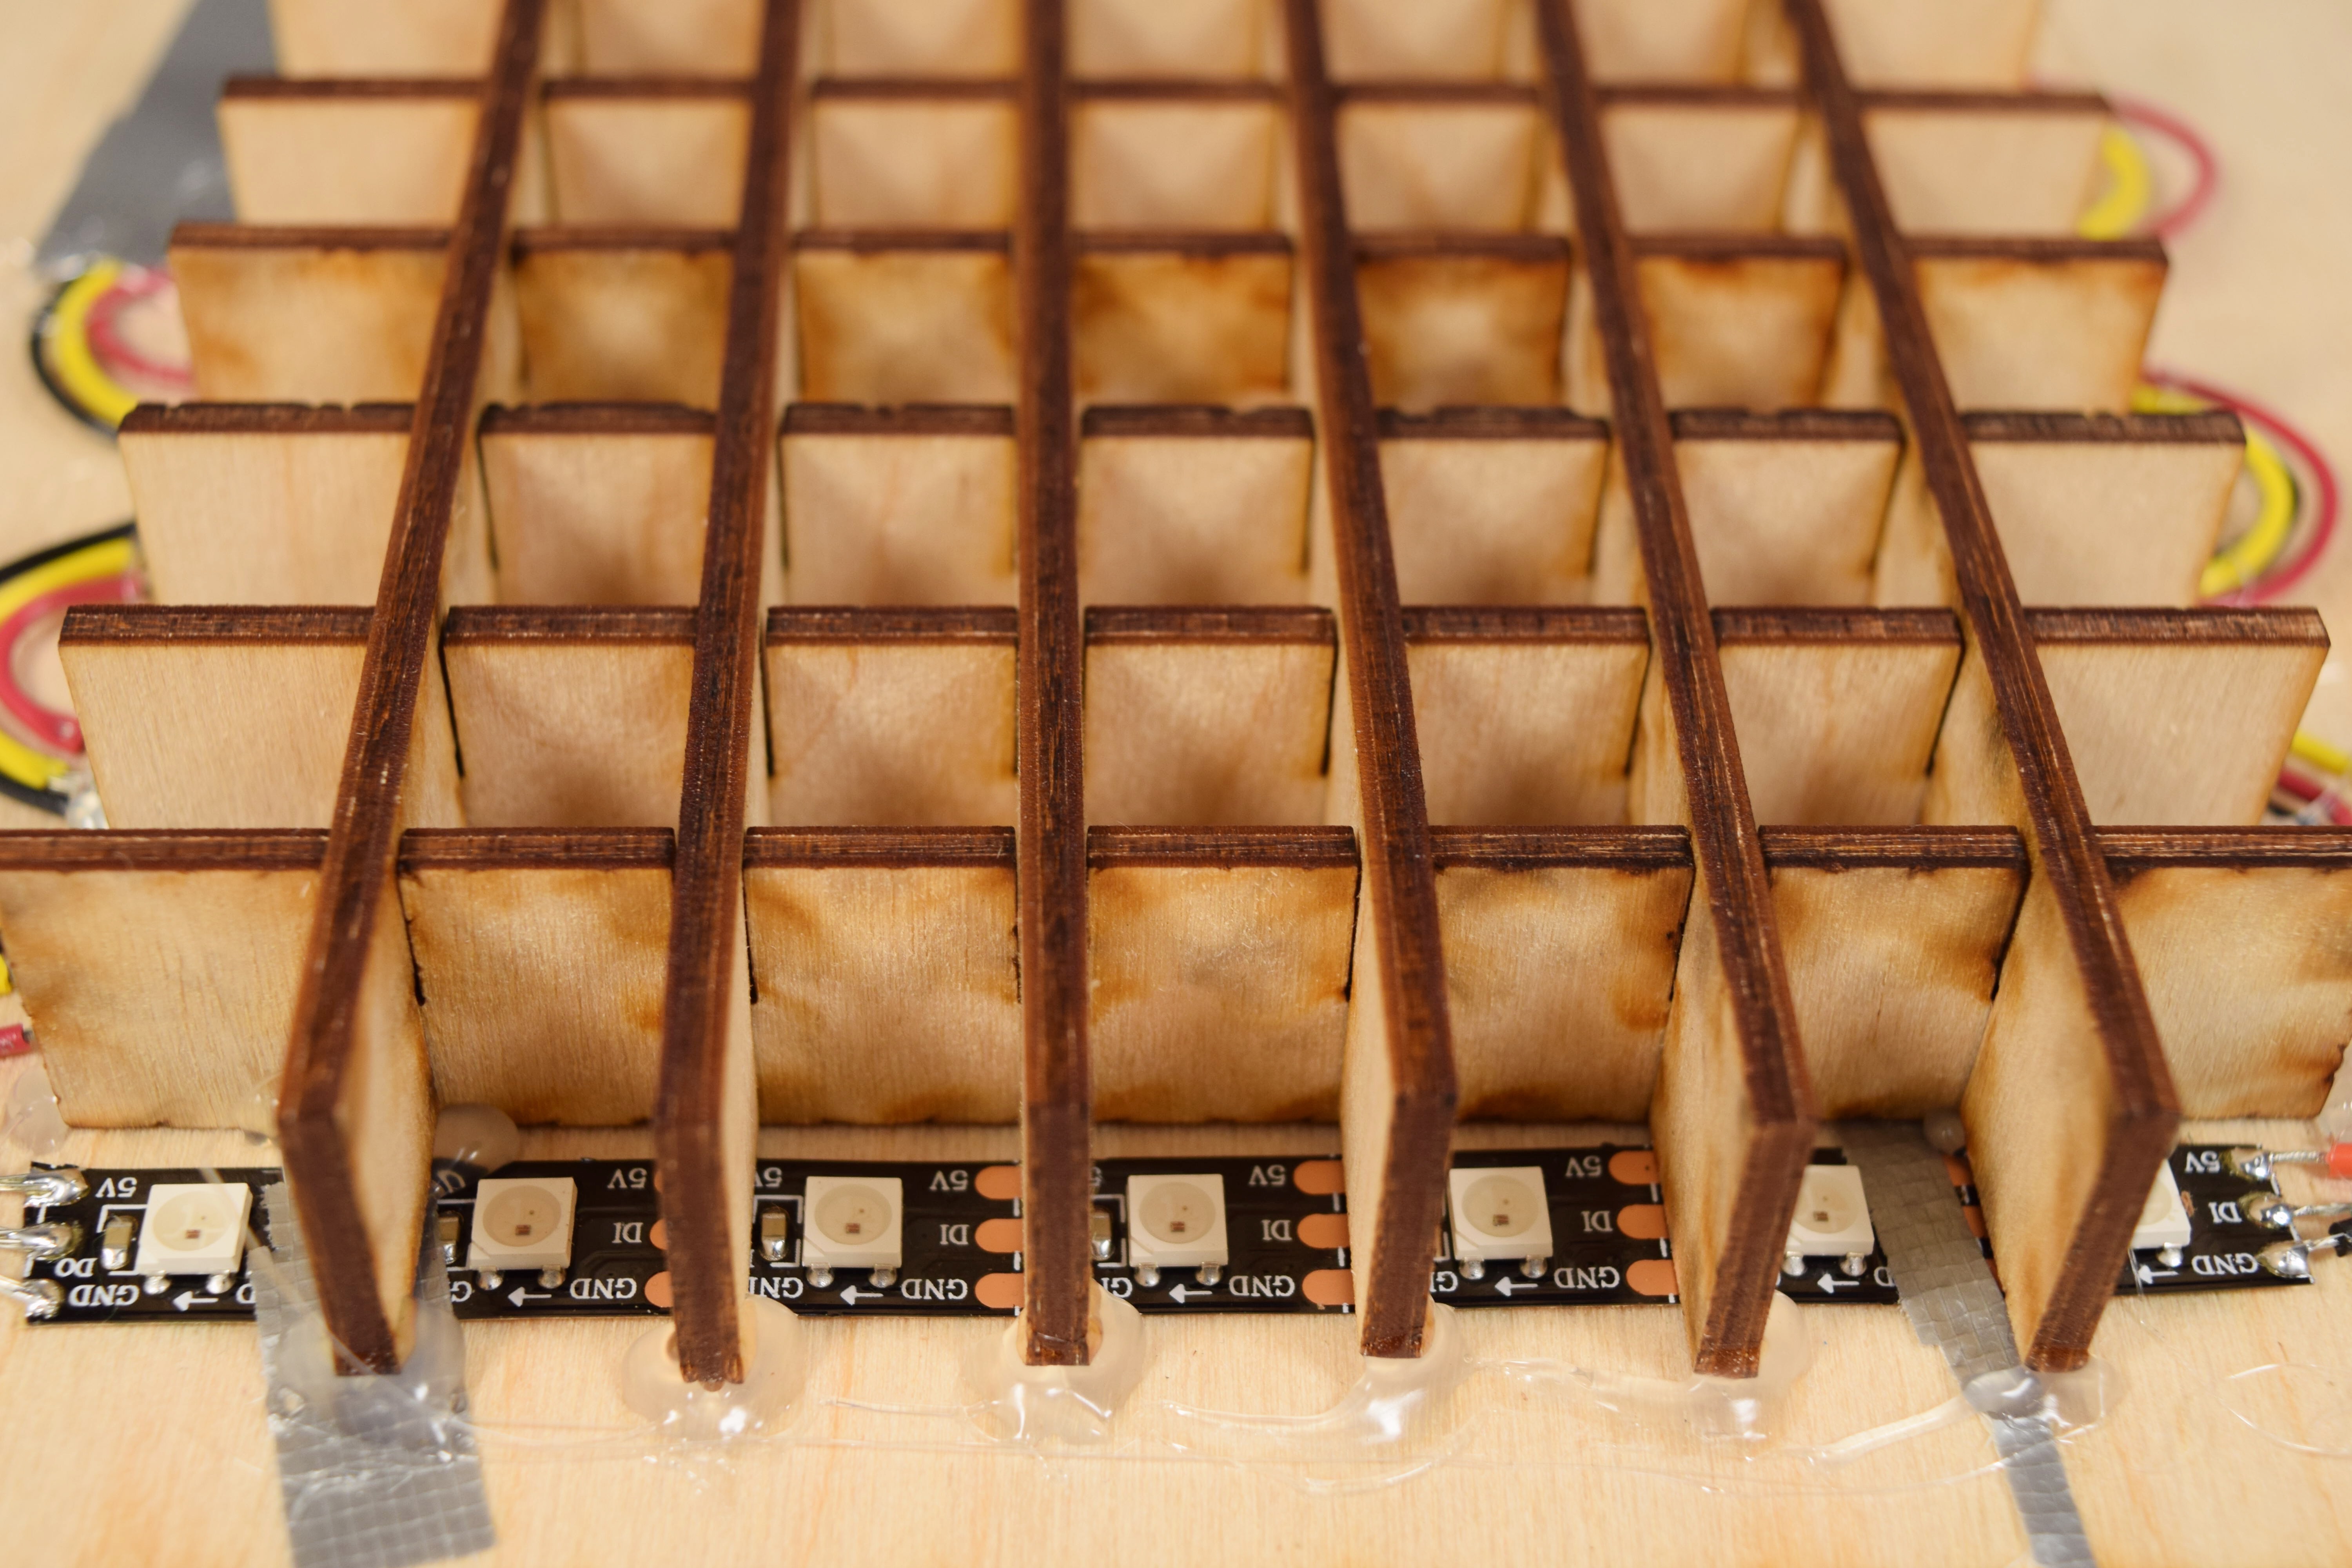
Close up of LED grid
- This personalized anemometer reads wind speeds outside and relays it in three main channels:
- Wind speeds within the past ~10 minutes
- Maximum wind speed of the day
- Current wind speed (instant)
- The “picture frame” display of the system will be housed within one’s home, preferably along a wall or other power outlet source, and the reader portion of the system will be strapped to a structurally sound arrangement that will allow the anemometer to read the wind speed, and Arduino to filter and relay the information.
Process
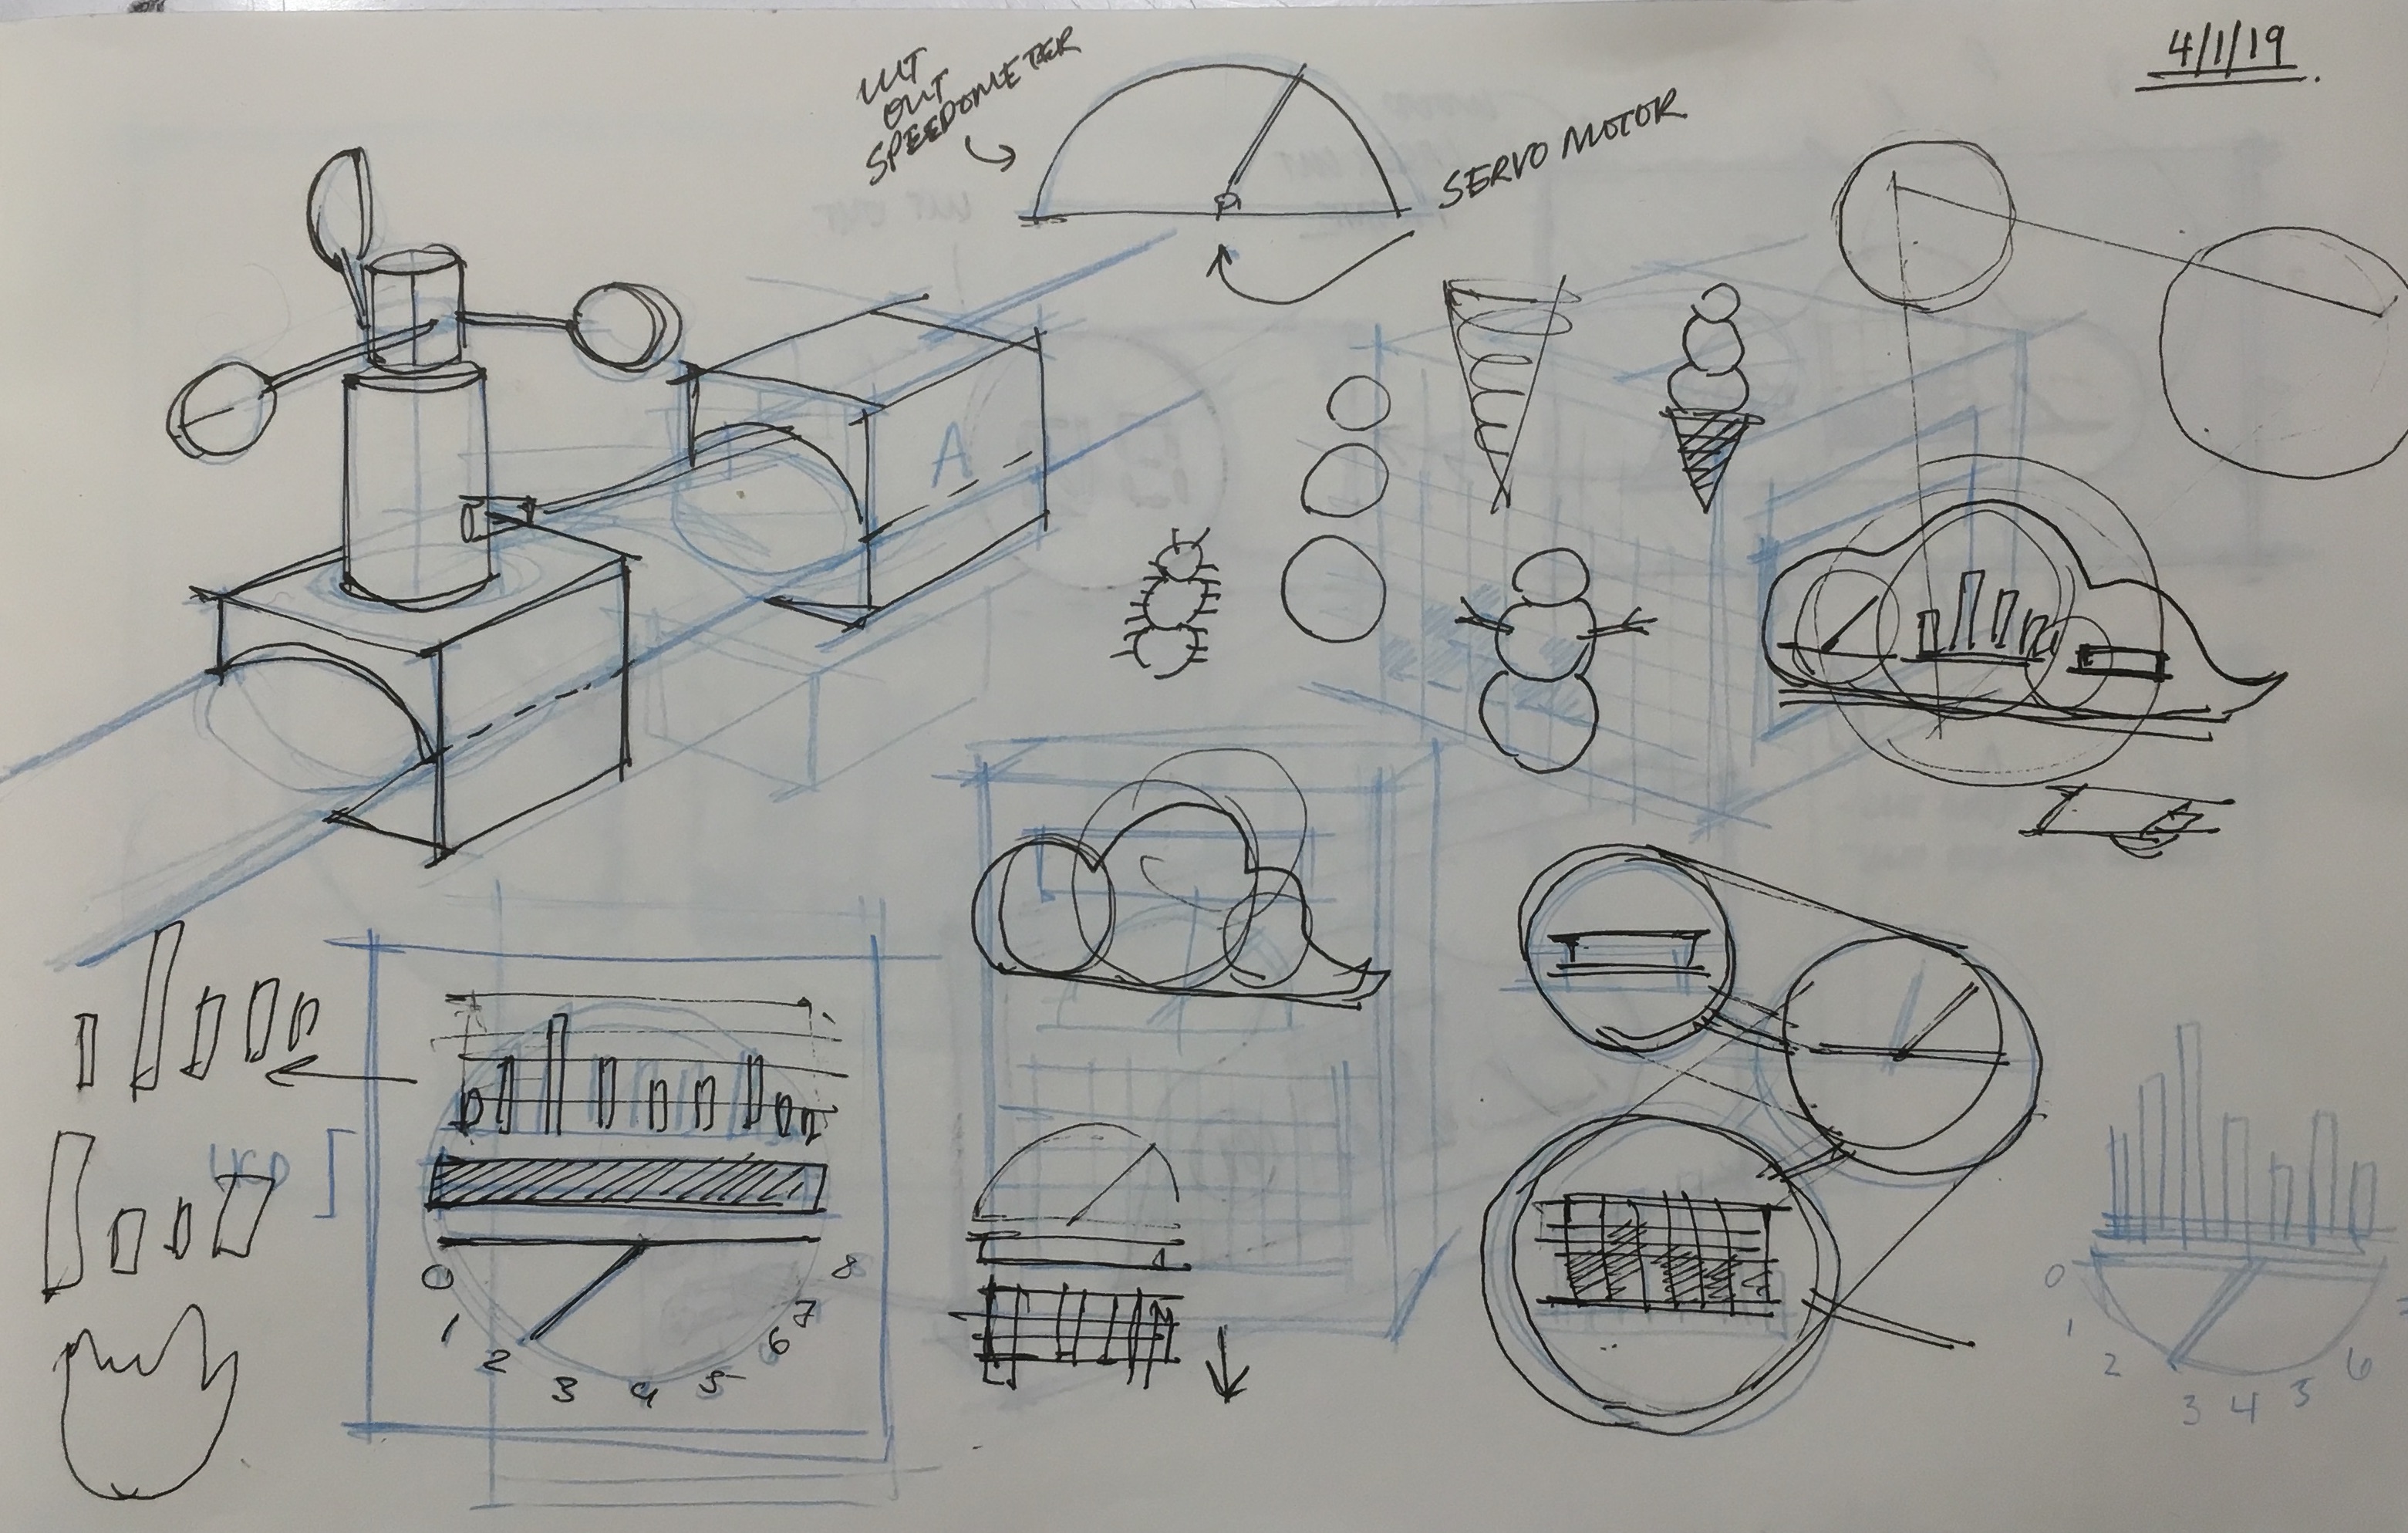
Initial Sketches
Developing cloud prototype
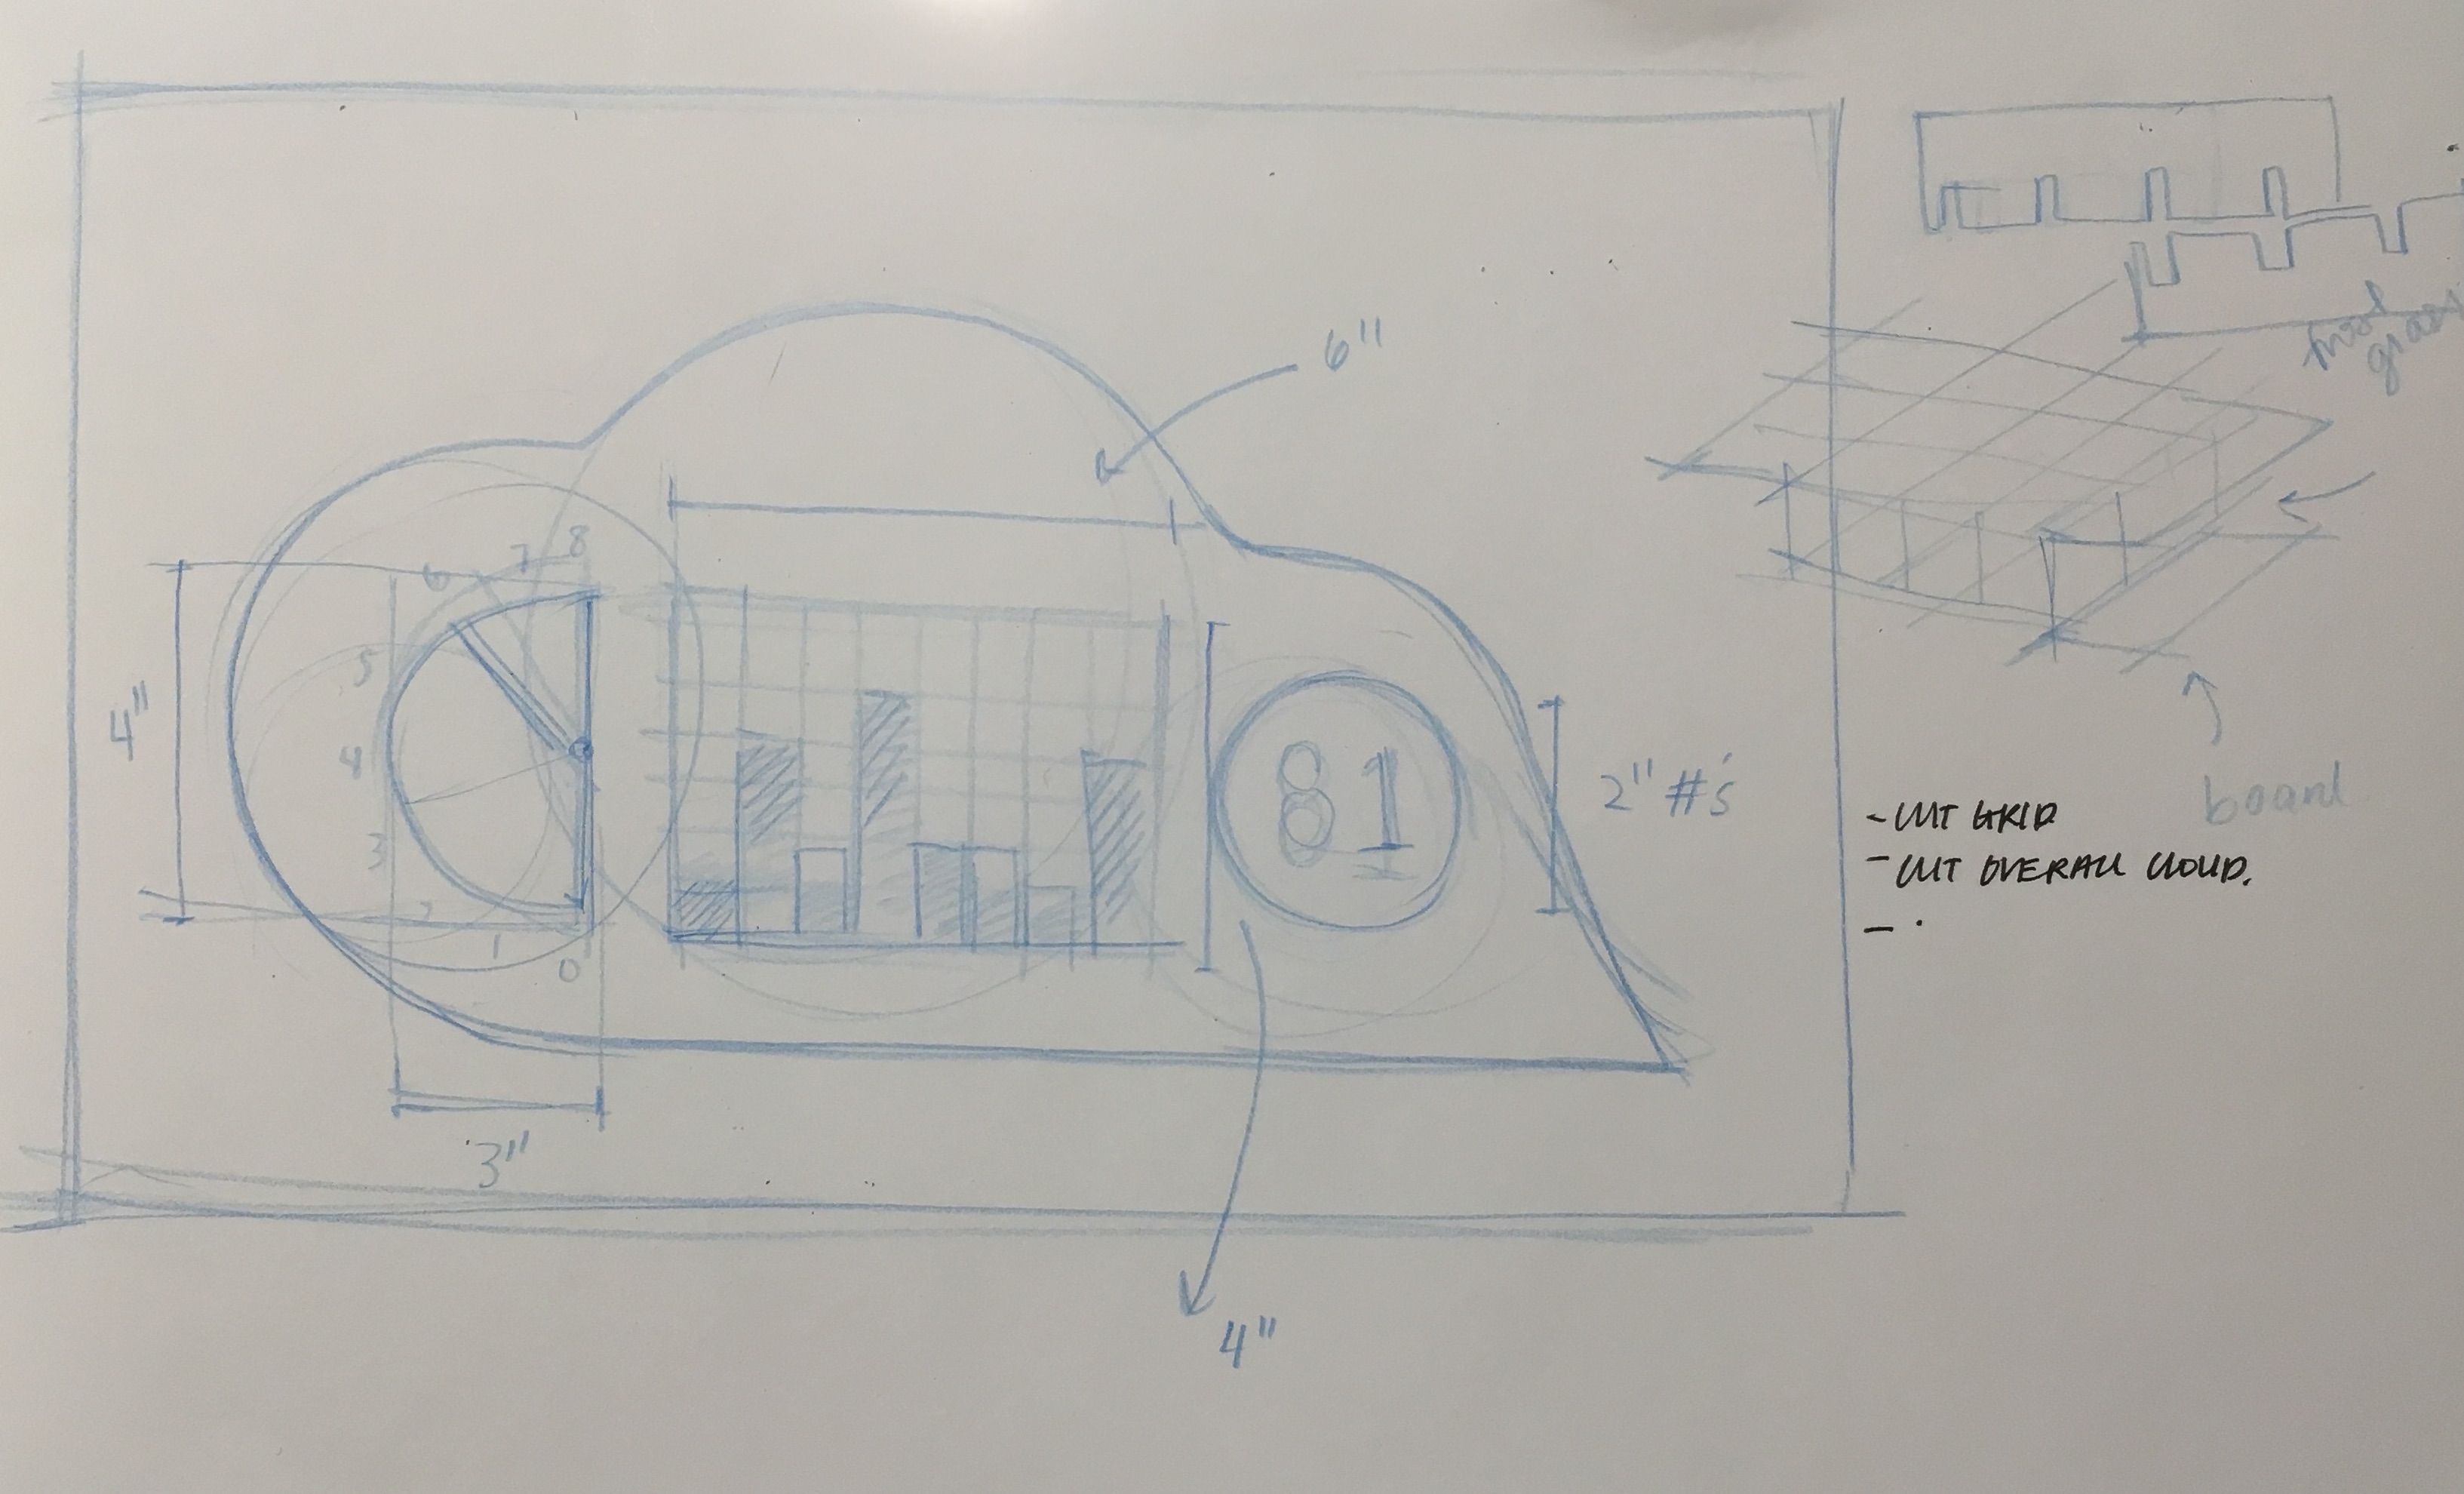
Figuring out dimensions + what cloud proportions should be
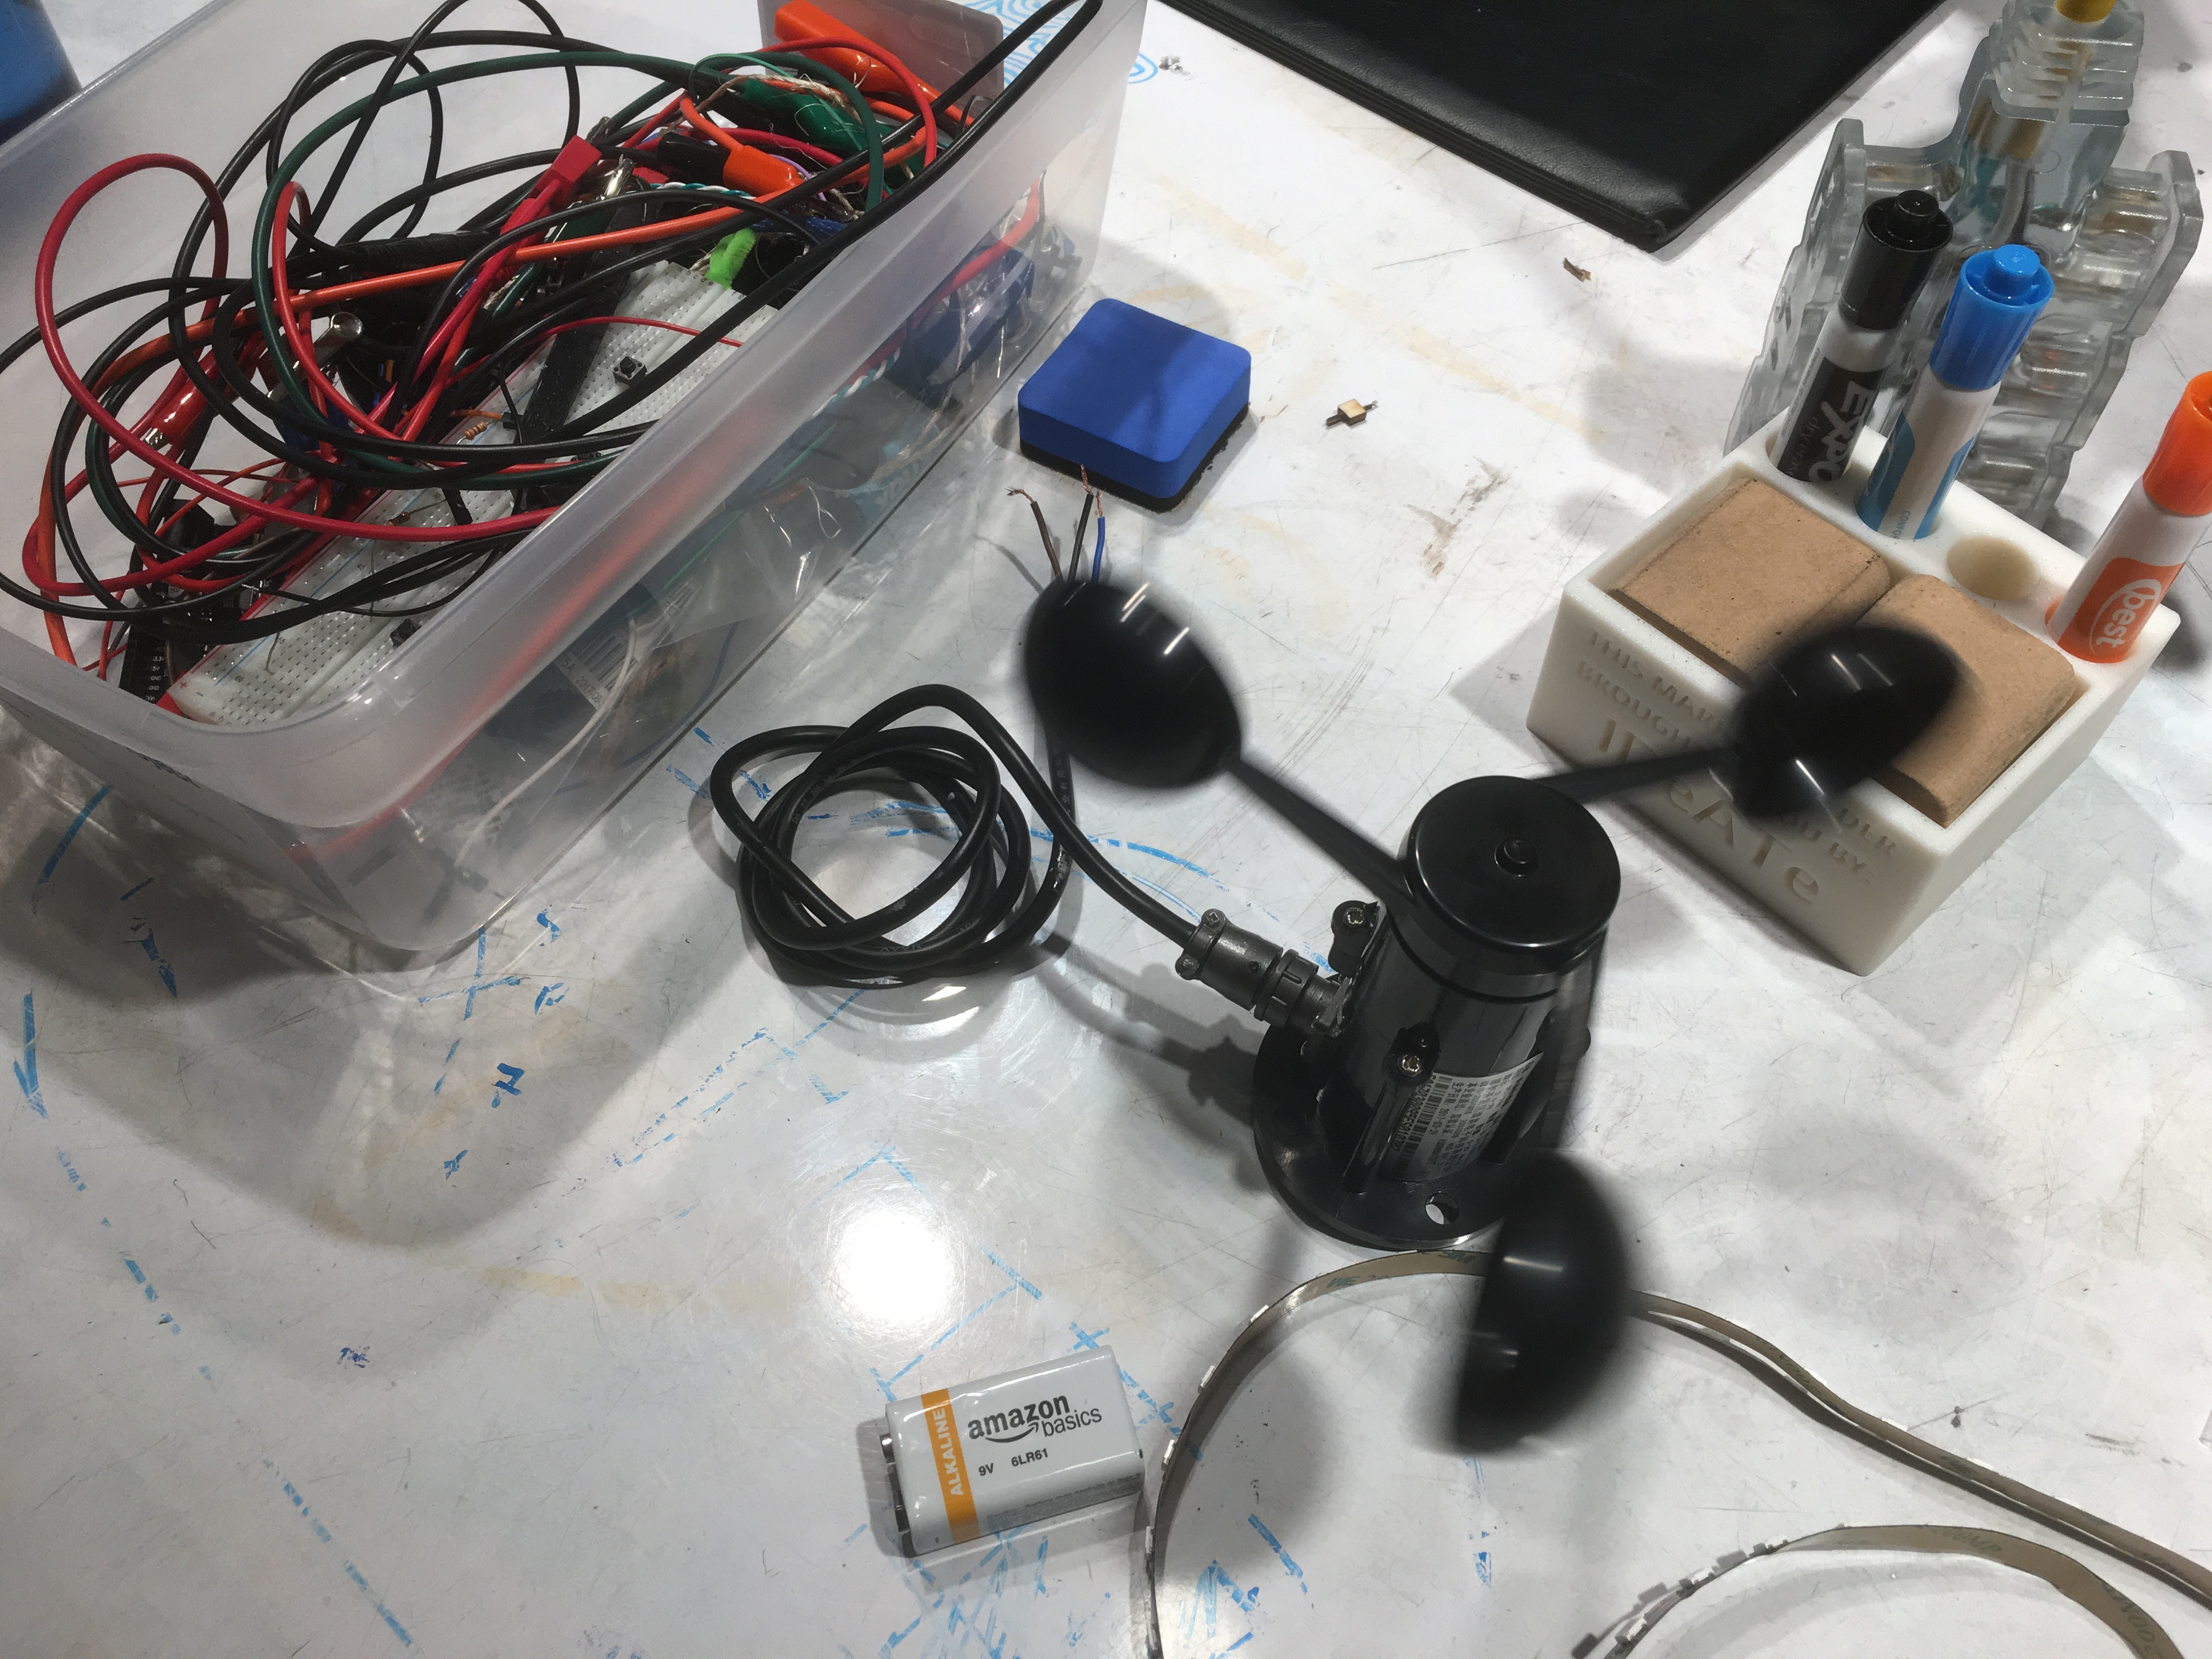
Playing around with anemometer (and pretending to be fake wind)
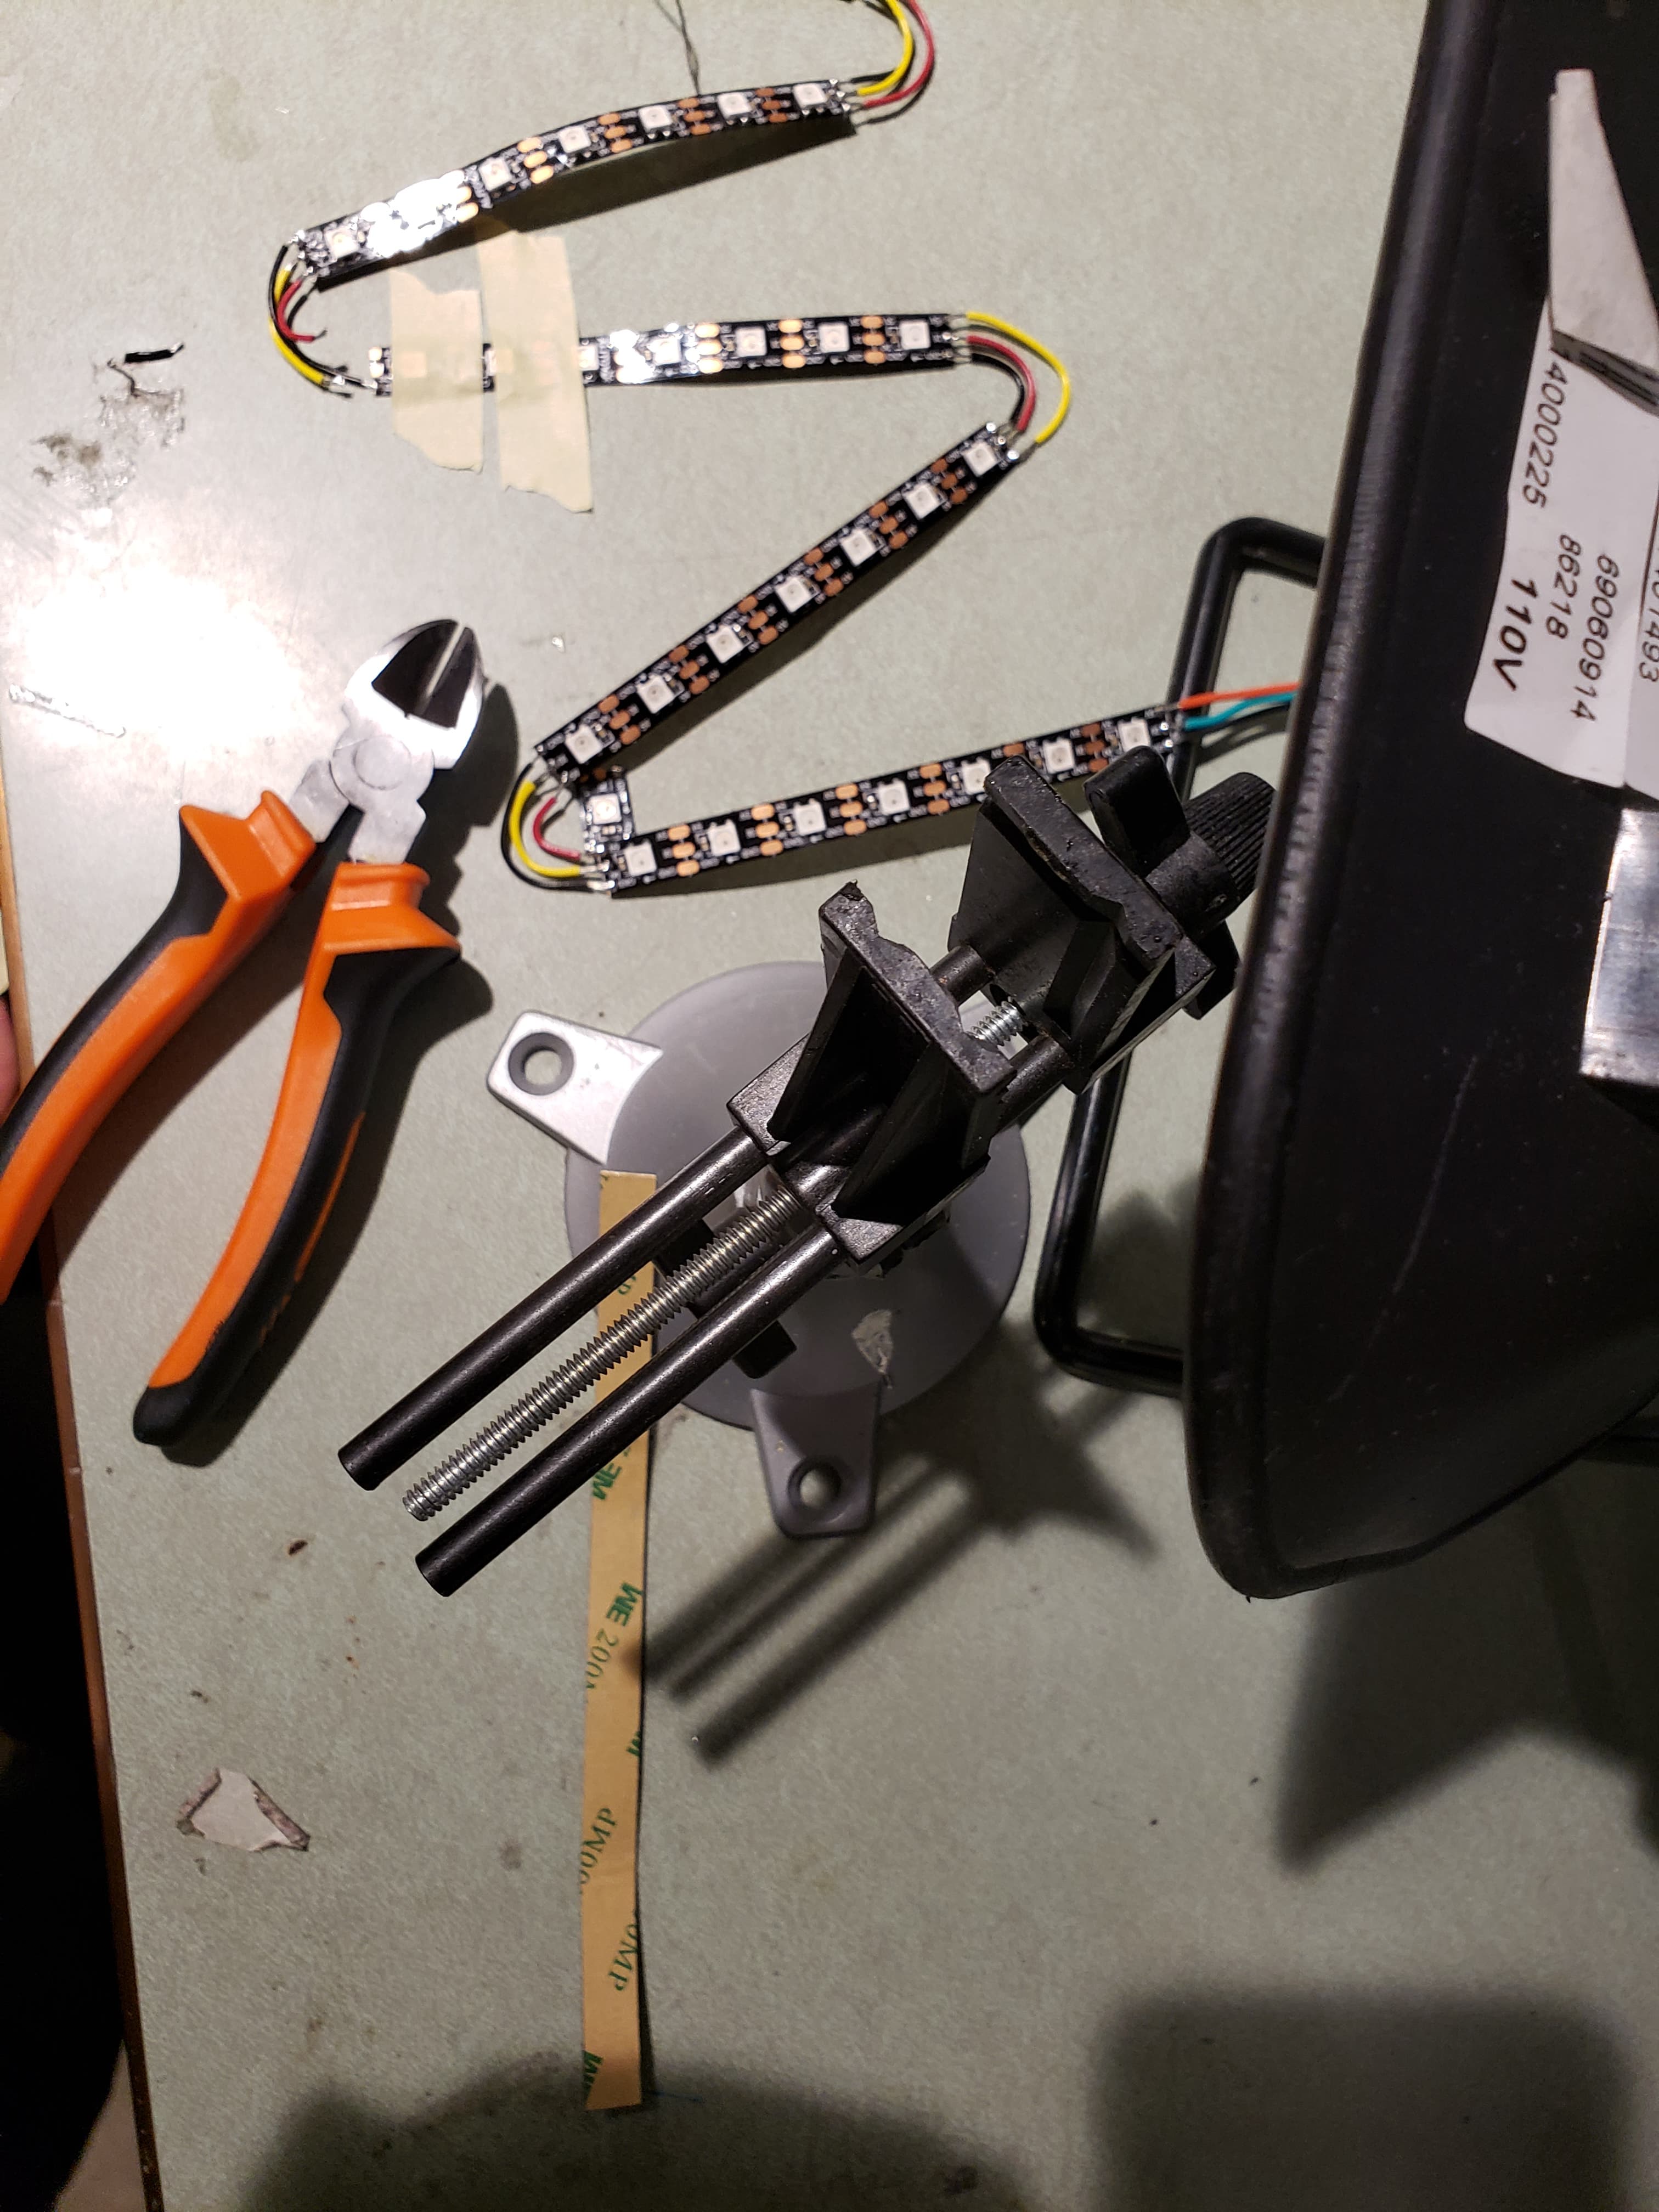
Soldering wires into grid structure
Exploring LED grid capabilities
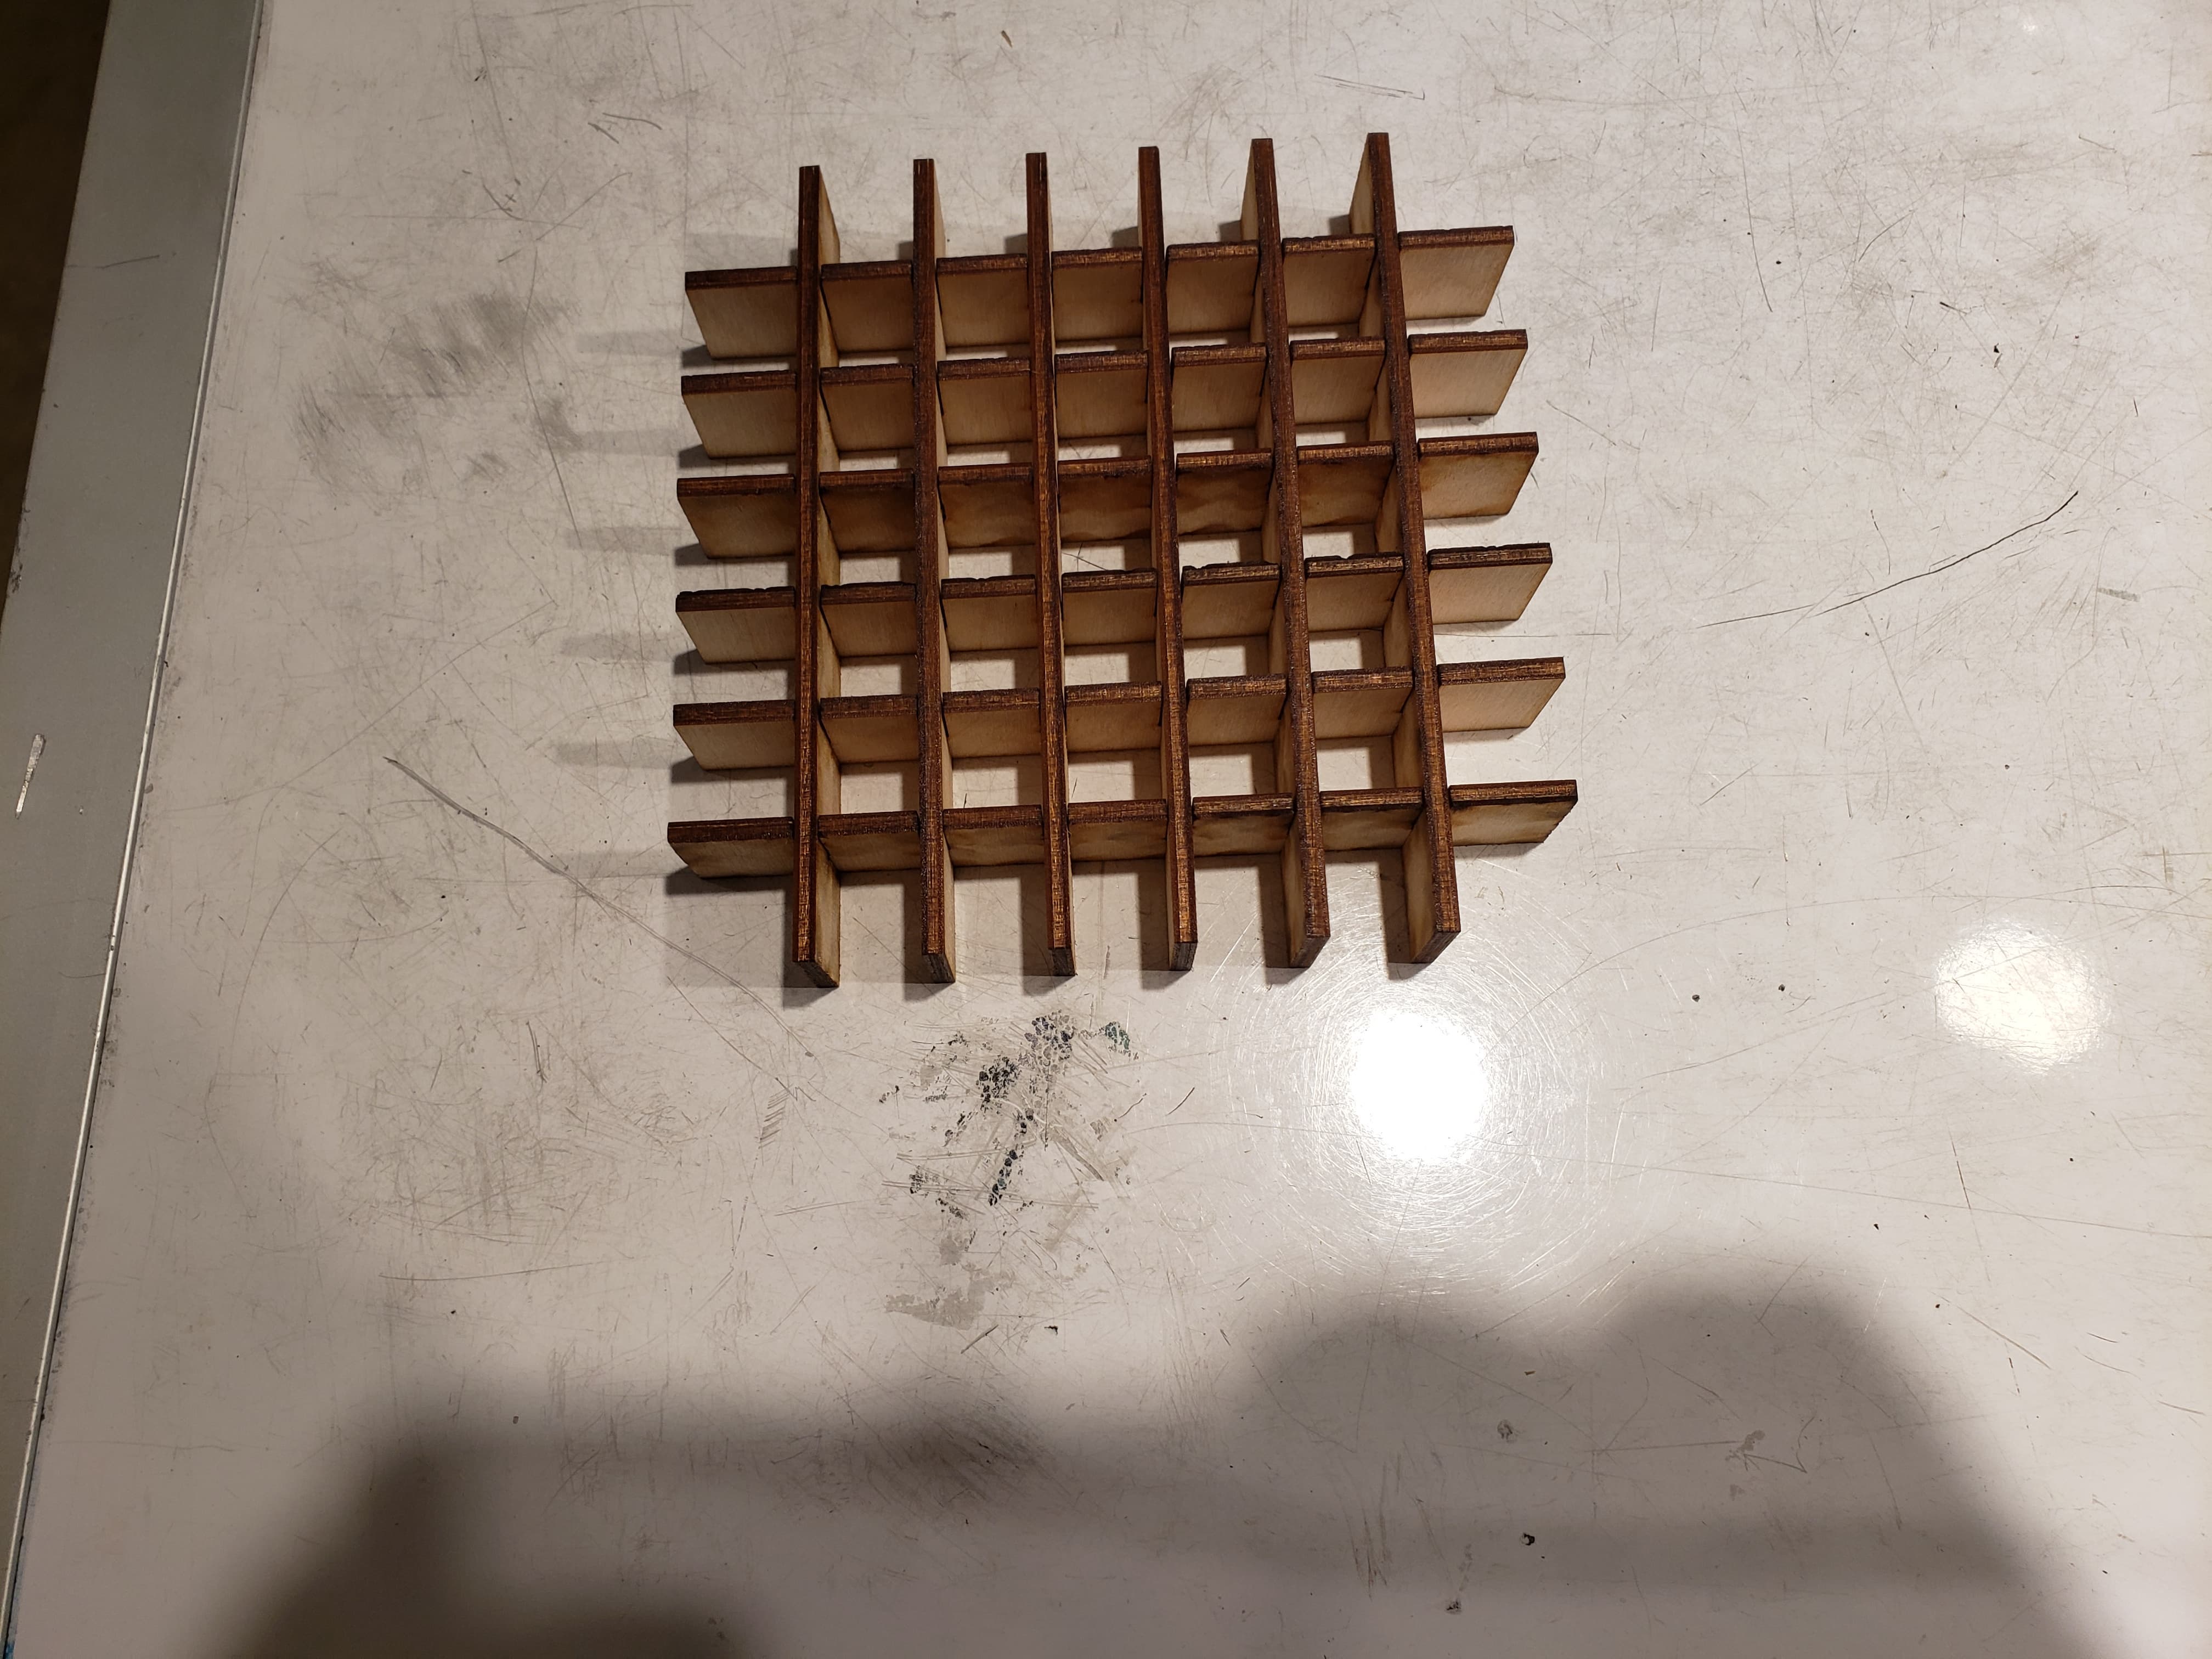
Wooden cut out grid to control LED lights from bleeding into each other.
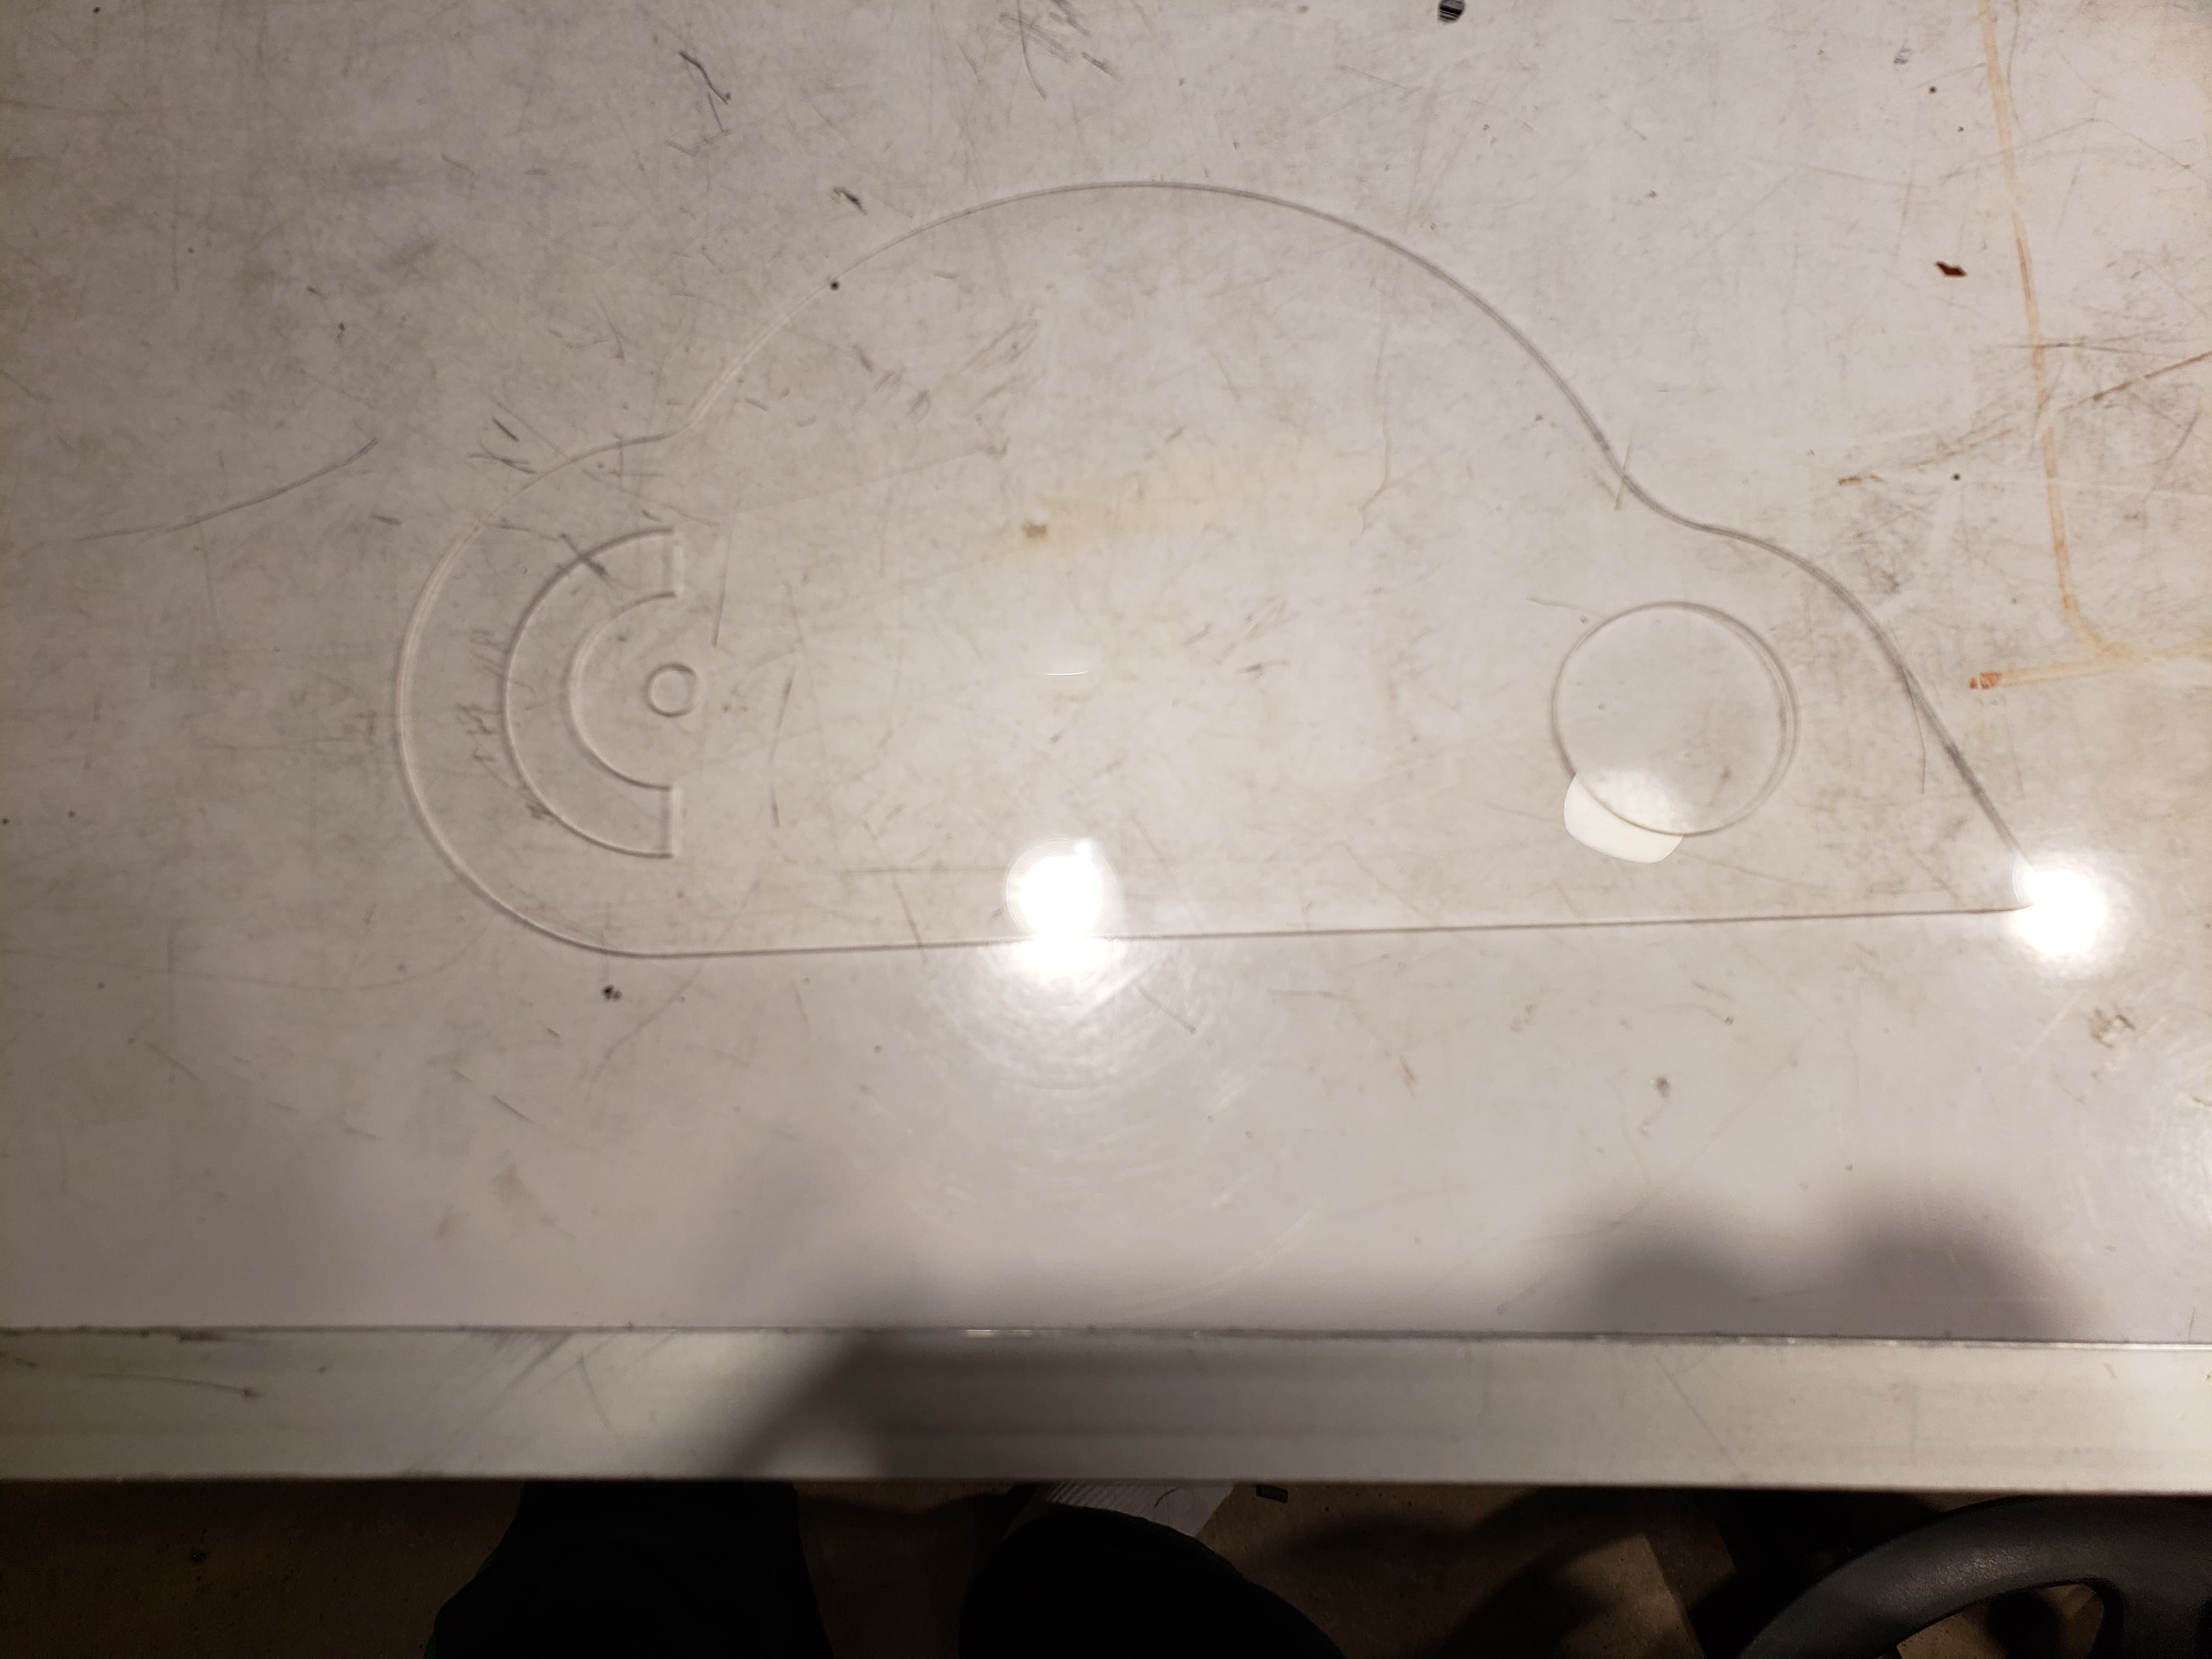
Acrylic cut cloud surface
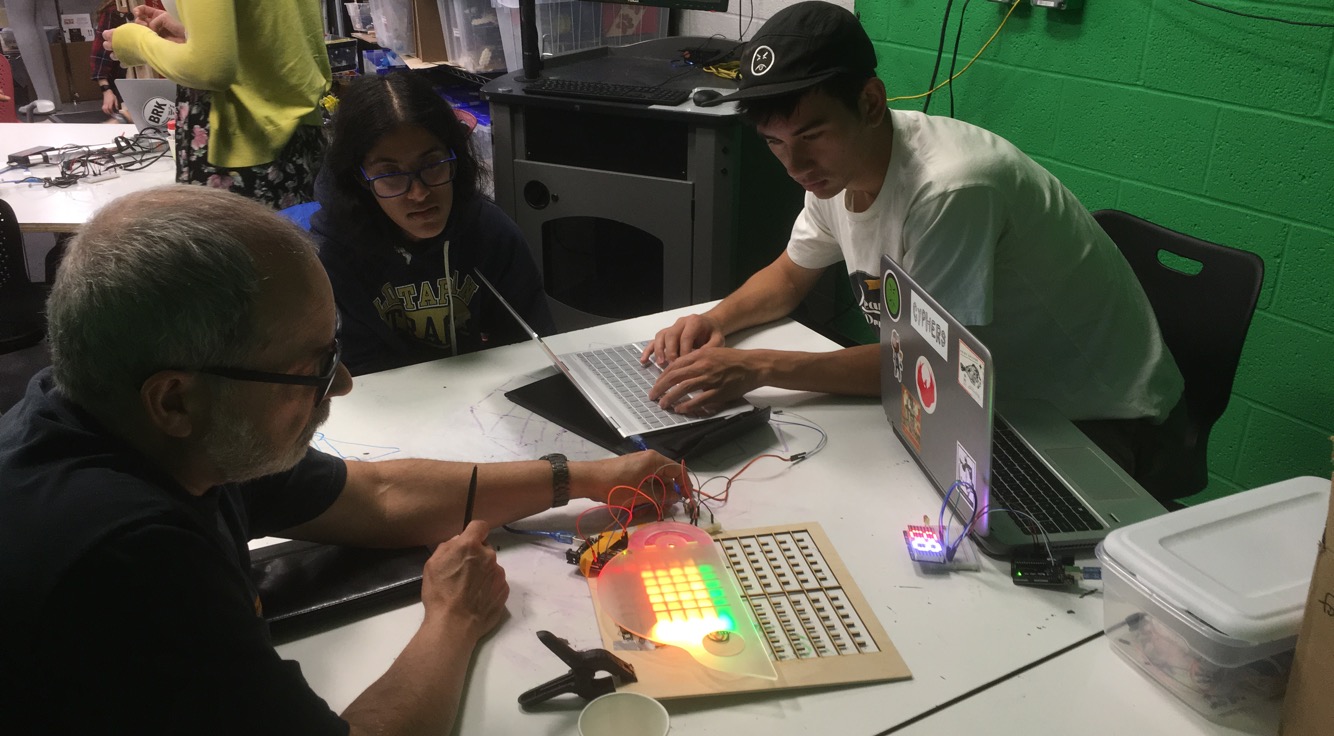
Meeting and chatting with Peter again for crit and mid-process feedback!
Discussion
Major Challenges
When creating this functioning prototype, we were challenged with how to personalize the visualization of data relayed in a visually engaging but not intrusive and obnoxious manner, how to adapt the components used to create a weather-proof deliverable, and errors and complexities that arose with trying to debug code that we fed into the LED systems. The largest and starting point of this project began with how to display the three points of interest (average wind speed, highest wind speed of the day, and wind speed within the past 10 or so minutes), in visually engaging and interesting ways that would not be so plain as to be simply text, akin to current on market anemometers. At first, we ideated around creating an interface that would also be housed outside, and be able to shine into the house from afar, however, decided against that as it would then also have to be of weather proof design and materials. We then brainstormed ideas of creating a picture-frame-esque mounted piece, that would display the three readings utilizing three different ways of interpreting data: 1. A “bar graph” like reading 2. A “speed dial” like reading and 3. A digital reading. By using three distinctly different ways of conveying data, we hope to create a contrast among the different types of data Peter takes interest in, despite them all being centered around wind speed. Ultimately, we settled on a graphic cloud-like design, with each set of data housed within one mound of the cloud. Moving forwards, we had to then design a box that would strap accordingly to the railing of Peter’s balcony, and serve as a sturdy platform as well as solid housing for the anemometer and Arduino to be housed within. Additionally, because the anemometer we purchased is one meant to detect high wind speeds, we are unable to directly prototype and test out what wind speeds would actually be like relayed onto our LED panels and digital reads. Instead, we have had to make do by attaching a potentiometer in efforts of playing around with the different levels of possible wind speeds. Aside from the design aspect, we realized that the motor didn’t function as expected when in the same code as the lights, so we will have to troubleshoot that some more. Looking back, we believe that there wasn’t enough power or current for both to run simultaneously; in previous projects, they used the same battery source, but ran in sequence so this particular problem did not arise.
Feedback from Meeting Again with Peter (April 8th)
After meeting again with Peter, we discussed more in depth the possible types of data that could be relayed across the three outputs, as well as how fluid we want the data to be manipulated in regards to controlling the duration of which data will be collected over. For example, Peter brought up that instead of having a digital reading of what the maximum wind speed within the past hour, he would rather have the servo motor point to the maximum wind speed of that particular day, which would then consistently go up as the day progressed, and then reset every night. This decision was based on the notion that 1. The servo motor could be quite loud and thus it would not be ideal to have it move often and 2. The information of maximum wind speed for the current day was more beneficial and interesting to Peter than the average wind speed within the past hour. Another possible element for change that Peter suggested was playing around with the lights, as he did not seem extremely keen on how bright they were. Initially, we had tried to diffuse this by utilizing a foggy acrylic, however, we might play around with creating a more so “line graph” out of the LED grid rather than a “bar graph” in order to alleviate the brightness, seeing as we can not manipulate the brightness. Furthermore, Peter thought it would be helpful if he were able to toggle between several features of what he wanted to display for the digital read, for example, to toggle between reading the instant wind speed at a given time versus reading the peak of the day.
As a group, we concluded that we would definitely want to hit upon most of Peter’s suggestions, as one of the primary points of this anemometer was the fact that it was personalized to Peter’s interests and curiosities in reading wind speeds. Because of that, we would like to accommodate the different features and data readings that he is most interested in knowing. We would also like to address the specific aesthetic needs that he has, as we would ideally want it to be non-intrusive as well, however, due to the limitations of materials and how certain materials give way to more customization than others, we will primarily focus on how the overall housing and structure of the product (ie. the cloud’s design, shape, dimension) before addressing the smaller aspects that have less give (ie. the brightness of the LED, the sound of how loud the servo motor is).
Moving Forwards
Moving forwards, we hope to integrate the different key features that Peter wishes to see in regards to the data readings from the wind anemometer. This includes creating a more personalized toggle system within the current wind speed readings, creating pieces and parts for the servo motor reading, and readjusting the way data will be conveyed through digital readings. We will also shift gears at a certain point to tackle the exterior portion of the system, and how to fasten the anemometer, Arduino, and radio module component accordingly so that the product can stay structurally sound amidst the outdoor winds and weather.
Comments are closed.