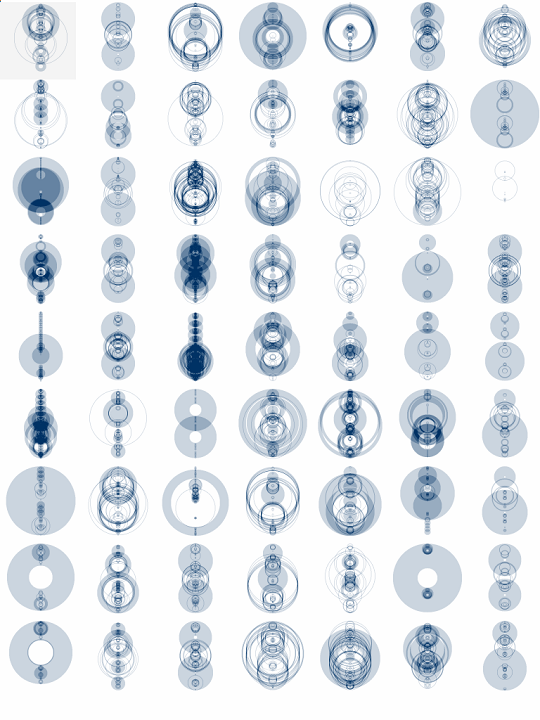
One of the projects where an artist created software to visualize data is called “The shape of the song”. Martin Wattenberg created this because he wanted to be able to see music. The arcs go between two sections of notes that are repeated. The software analyzes MIDI files, files that get the notes from a piece, which can be found on the internet. However, since these files are handmade, each file can have different contents even though it might be of the same song, which in return might produce different sequences in arcs. Since the arcs are translucent when they overlap it creates a variety of different opacities within the piece and depending on how big the section that is being repeated the stroke of the arcs are also varied. Wattenberg has an interest in how technologies can provide insight into things that are often overlooked in everyday life. Visualizing different patterns in music shows us a deeper understanding of music and might provide insight into why some people like certain songs compared to others. Additionally, this project reminded me of one of the other projects I looked into for Looking Outwards – Milkdrop. Milkdrop used shapes, curves, and colors to help visualize music. Milkdrop was a more organic, conceptual way of visualizing music, while The Shape Of Song is a more logical structured way of visualizing it. With The Shape Of Sing, it is easier for the audience to see how the music generated the artwork.
https://www.bewitched.com/song.html

![[OLD SEMESTER] 15-104 • Introduction to Computing for Creative Practice](https://courses.ideate.cmu.edu/15-104/f2022/wp-content/uploads/2023/09/stop-banner.png)