![[OLD SEMESTER] 15-104 • Introduction to Computing for Creative Practice](https://courses.ideate.cmu.edu/15-104/f2022/wp-content/uploads/2023/09/stop-banner.png)
Melian Solly wrote an article about how ImageNet Roulette, an AI tool created by Trevor Paglen, is biased when it comes to how it categorizes people. When a white person uploads a picture of themselves it talks about an occupation or a characteristic. However when other races upload their picture it stereotypes them. This is probably due to the data that was used while creating the program. There was most likely more data sampling of white people, when it comes to other races the creator’s bias might have impacted the data or they might not have created a diverse data set. This shows how important it is to pick good and diverse data samples and to keep in mind the wide range of people that would be using the program. Even though a programmer might be designing for themselves when creating the app, at some point in the process it is important to step back and consider the users as well. The data is just showing a summary of what developers put into categorizing people, and because of that the developers biases leak into the program.
Author: Nakshatra
Looking Outwards 09
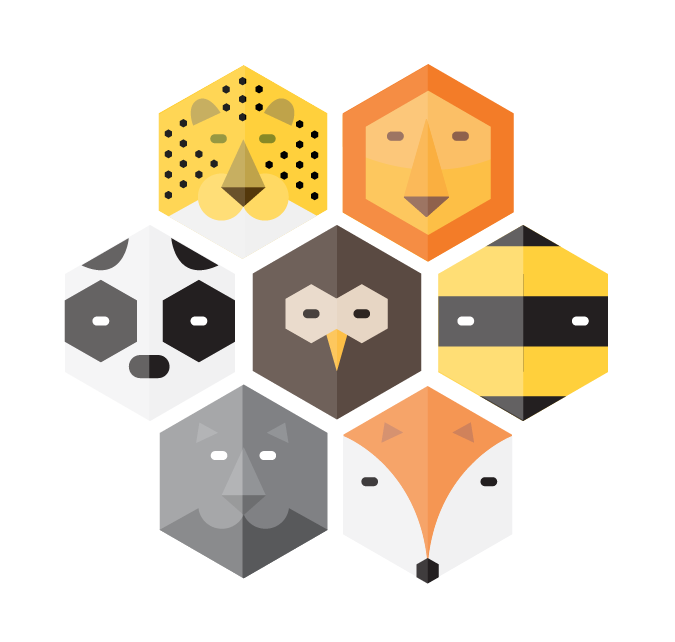
The artist Chloe Varelidi, usually creates games, toys, and unique products. She worked for different organizations for ten years before she founded a company called “humans who play”. Humans who play is a company who works with organizations on human-centric design. They aim to tackle problems and questions through design. Each of her projects uses different mediums to resolve the challenge. One of her projects is called Animal Badges. She created different badges that had different animals. The badges were given out to kids after they learned a new skill related to emotional learning. Each of the different animals represents a different skill like empathy, curiosity, perseverance, and compassion. I admire this project because it is helping kids learn more about their emotions. Education about emotions should be taught in school because it helps people understand what they are going through and feeling and communicate that to other people so others understand as well. It is one of the most important life skills that someone needs, not only to understand themselves better but to also interact with different people.
https://varelidi.com/post/89194714461/animal-badges-a-sample-of-some-badges-i
Looking Outwards 08: The Creative Practice of an Individual
Matt Adams is one of the people that is a part of Blast Theory. This group creates interactive art that questions the way people interact with each other as well as the social and political climate during that time. They test how people respond to various scenarios and create interactive platforms highlighting certain actions and choices. They play with the relationship between real life and fictional lives, often the occupants have to make choices that result in real-life consequences or analysis. Even though a user thinks they are playing a make-believe game, the game might be linked to actual life events that have taken place. I admire that they make people question what is happening in the real world by temporarily removing them and placing them in a fictitious world. Doing so leads the user to think more about the real-life consequences learned from that simulation. The order in which he talked about the projects also helped to explain the concepts. He alternated between explaining and showing the examples, which aided in explaining the concept. The audience is introduced to the idea, then they are shown the project so they can see it in action. After that, he explains the conclusions and the result of the project.
https://www.blasttheory.co.uk/?from=header
Dynamic Snowflakes
For this project I used the rose curves and epicycloid functions to create this composition. The rose curve (white) resembles a snow flake and as the mouse moves the it changes but still looks like a snow flake. When mouse is at zero, the middle of the composition, 480 or off the canvas it creates a circle. The epicycloid changes in complexity and in color as the mouse moves.
sketch
//Nakshatra Menon
//Section C

var nPoints = 240;


function setup() {
    createCanvas(480, 480);
    background(246, 242, 240);
    colorMode(HSB);
}


function draw() {
    background("black");
    translate (width/2, height/2); // origin is middle of canvas
    noFill();
    epicycloid(0, 0);             // shape 1
    roseCurve(0,0);               // shape 2
}

function roseCurve(){  // draw rose curve from https://mathworld.wolfram.com/RoseCurve.html
    var g = constrain(mouseY/32, 5, 15);      // g is based on mouse Y
    var n = constrain(int(mouseX), 0, 480);   // n is based on mouse X
    strokeWeight(.5);
    stroke("white");
    beginShape();
    for (var i = 0; i < nPoints; i++) {
        var t = map(i, 0, nPoints, 0, TWO_PI);
        var radius = 10 * cos(n * t);    // function

        // first set of values
        var x = g*radius * cos(t);       // function
        var y = g*radius * sin(t);       // function

        // second set of values
        var x1 = 2*g*radius * cos(t);    // function
        var y1 = 2*g*radius * sin(t);    // function

        vertex(x, y);                    // vertex for shape
        vertex(x1, y1);                  // vertex 2 for shape
    }
    endShape(CLOSE);
}

function epicycloid (){    // draw the epicycloid from https://mathworld.wolfram.com/Epicycloid.html
    var f = constrain(int(mouseY/20), 2, 48);        // output of number based on mouse Y
    strokeWeight(1);
    stroke(332,mouseX/5, 20);                        // color changes based on mouse X position
    for (var a = 10; a <240; a = a+10){              // how many epicycloids are drawn
        var b = a/f                                  // b is related to mouse Y
        beginShape();
        for (var i = 0; i < nPoints; i++) {
            var t = map(i, 0, nPoints, 0, TWO_PI);  // remaps

            var x = (a+b)*cos(t) - b*cos(((a+b)/b)*t); // function
            var y = (a+b)*sin(t) - b*sin(((a+b)/b)*t); // function

            vertex(x, y);                              // vertex for points
        }

    endShape(CLOSE);
    }
}
Information Visualization
One of the projects where an artist created software to visualize data is called “The shape of the song”. Martin Wattenberg created this because he wanted to be able to see music. The arcs go between two sections of notes that are repeated. The software analyzes MIDI files, files that get the notes from a piece, which can be found on the internet. However, since these files are handmade, each file can have different contents even though it might be of the same song, which in return might produce different sequences in arcs. Since the arcs are translucent when they overlap it creates a variety of different opacities within the piece and depending on how big the section that is being repeated the stroke of the arcs are also varied. Wattenberg has an interest in how technologies can provide insight into things that are often overlooked in everyday life. Visualizing different patterns in music shows us a deeper understanding of music and might provide insight into why some people like certain songs compared to others. Additionally, this project reminded me of one of the other projects I looked into for Looking Outwards – Milkdrop. Milkdrop used shapes, curves, and colors to help visualize music. Milkdrop was a more organic, conceptual way of visualizing music, while The Shape Of Song is a more logical structured way of visualizing it. With The Shape Of Sing, it is easier for the audience to see how the music generated the artwork.
https://www.bewitched.com/song.html
Mug Clock
I was inspired by the coffee mugs that change based on the temperature of the liquid inside. However instead of temperature this mug changes based on time. The color depends on the hour of the day, the height depends on the minute and the steam depends on the second.
sketch
//Nakshatra Menon
//Section C

var cupHeight;

function setup() {
    createCanvas(480, 480);
    background(246, 242, 240);
}


function draw() {
    push();
    colorMode(HSB);
    background(180, hour()*2, 42);
    pop()
    fill(44, 28, 7);
    noStroke();
    rect(0, 300, width, 200);
    cup(240, 300);
}


function cup(x,y){ // draws cup
    cupHeight = -minute();                           // makes the cup taller with the min
    push();
    translate(x,y)                                   // center of the liquid becomes the origin
    // cup handle
    strokeWeight(10);
    stroke(170);
    noFill();
    ellipse(70, cupHeight+40, 48-cupHeight, 44);

    // saucer
    strokeWeight(1);
    noStroke();
    c();                               // color
    ellipse(0, 75, 120, 20);
    fill(0, 0, 0, 50);                // shadow
    ellipse(0, 75, 100, 15);

    // body of cup
    strokeWeight(1);
    noStroke();
    c();                               // color
    beginShape();
        curveVertex(-76, cupHeight);
        curveVertex(-76, cupHeight);
        curveVertex(-62, 27);
        curveVertex(-38, 60);
        curveVertex(0, 75);
        curveVertex(38, 60);
        curveVertex(62, 27);
        curveVertex(76, cupHeight);
        curveVertex(76, cupHeight);
    endShape();

    // liquid
    strokeWeight(5);
    stroke(170);
    fill(110, 69, 17);
    ellipse(0, cupHeight, 150, 20);
    pop();

    // steam
    push();
    translate(x, y-45)
    steam();
    pop();
}

function c(){ // changes the color based on the hour
    // rounds up the number
    var f = ceil(hour()/2)
    var f2 = ceil(hour()/3)
    var f3 = ceil((hour()-12)/2)
    var f4 = ceil((hour()-12)/3)

    // color changes based on hour
    if(hour()>= 0 & hour()<= 4){                   // color goes from red to green
        fill((255-63*hour()),63*hour(), 0)
    }

    if (hour() > 4 && hour() <= 8){                 // color goes from green to blue
        fill(0,(255-63*f),43*f)
    }

    if(hour()> 8 && hour()<= 12){                   // color goes from blue to red
        fill(43*f2, 0, (255-43*f2))
    }

    if(hour()> 12 && hour()<= 16){                // color goes from red to green
        fill((255-43*(hour()-12)),43*(hour()-12), 0)
    }

    if (hour() > 16 && hour() < 20){             // color goes from green to blue
        fill(0,(255-43*(f3)),43*(f3))
    }

    if(hour()>= 20 && hour()<= 24){             // color goes from blue to red
        fill(43*(f4), 0, (255-43*(f4)))
    }
}


function steam(){ // steam changes based on second
    if (second()<=30){                           // when sec less/equal than 30
        fill(255, 255, 255, 120-2*second());    // the opacity changes depending on the second
        beginShape()                            // shape 1
            curveVertex(0, -12);
            curveVertex(0, -12);
            curveVertex(-16+second(), -34);
            curveVertex(-53+second(), -57);
            curveVertex(-52+second(), -107);
            curveVertex(21+second(), -119);
            curveVertex(10+second(), -158);
            curveVertex(47, -171);
            curveVertex(54-second(), -108);
            curveVertex(18-second(), -80);
            curveVertex(42-second(), -43);
            curveVertex(13-second(), -24);
            curveVertex(0, -12);
            curveVertex(0, -12);
        endShape();
    }
    if (second()>30){                           // when sec greater than 30
        fill(255, 255, 255, 120-2*second());   // opacity changes based on second
        beginShape()                           // shape 2
            curveVertex(0, -12);
            curveVertex(0, -12);
            curveVertex(-16-second(), -34);
            curveVertex(-53-second(), -57);
            curveVertex(-52-second(), -107);
            curveVertex(21-second(), -119);
            curveVertex(10-second(), -158);
            curveVertex(47, -171);
            curveVertex(54+second(), -108);
            curveVertex(18+second(), -80);
            curveVertex(42+second(), -43);
            curveVertex(13+second(), -24);
            curveVertex(0, -12);
            curveVertex(0, -12);
        endShape();
    }
}
Looking Outwards 06: Randomness
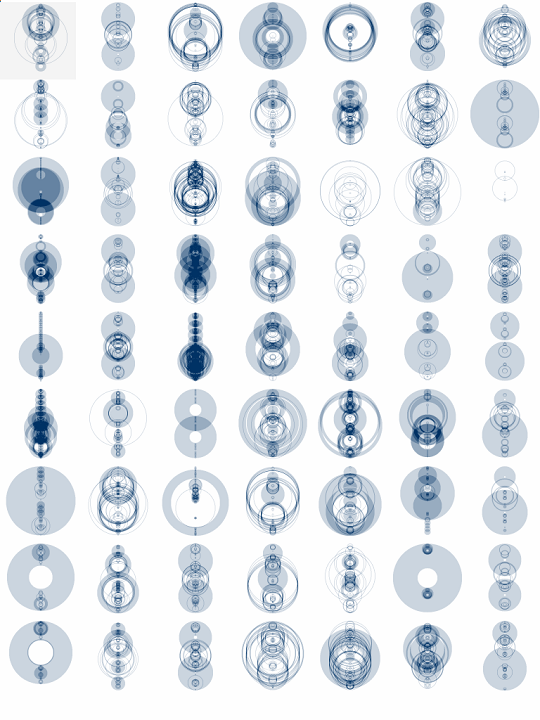
This piece displays randomness because the artist used it to create different-sized polygons. They used the Pareto distribution, which helps in creating a balance of different sizes. In his artwork, he used this to choose the length and width of the shapes. By doing so there are many small shapes but only a few large shapes. This way, even though the size of the polygons is random, the composition that is created is still balanced. If there were too many big shapes then they would overpower the composition. What I admire most about this project, is that it shows control even though it is generated through randomness. So even though the length and the width are controlled by chance, the artist still has some control so they can still get the desired effect. If there was no control, then the composition might communicate something that is unintended. The artist particularly used this form of randomness because they believed that it is what is most common in society and nature. To prove their point they provided examples. One of the examples was that the amount of people that have a lot of money is less than the number of people that don’t. This piece can be something that helps visualize this idea.
Community
By: Tyler Hobbs
https://tylerxhobbs.com/essays/2014/probability-distributions-for-algorithmic-artists
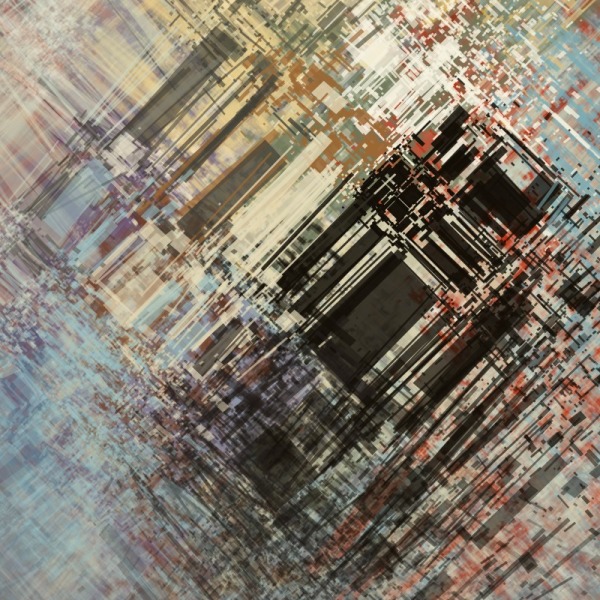
Looking Outwards 05: 3D Computer Graphics
An artist named Gleb Kuznetsov created a piece called Crystal Clear. It depicts hard materials interacting with light. The crystal is a translucent sphere with cracks that create individual pieces. The size of the piece changes and as it does so, the reflection of light in the background also changes. I found this artwork very interesting because of how it depicted the way light interacts with an object to create reflections and refractions. A Lot of other works created by this artist are centered around how different objects interact with light. Many of their works feature translucent objects to really emphasize refractions. This kind of 3d art can be useful for designers when they are testing to see how buildings/ objects interact with the environment, which is something that is important to consider during the design stage. In order to do this and make the light refractions accurate, the artist must have had to use Snell’s law formula and various other formulas that are derived from the study of nature.
https://dribbble.com/shots/18483709-Crystal-clear

String Art Bike
I started this project because I was inspired by the spokes on the bike. They looked like something that would lend itself to string art. After that, I wanted to make it look like the bike was moving so I had the positions of the spokes change and added the cactus in the back. Additionally, the color of the sky changes over time.
sketch
//Nakshatra Menon
//Section C

function setup() {
    createCanvas(400, 300);
    background(200);
}

var bikeWheel = 50;
var heightGround = 250;
var wheel = 1
var numLines = 10
var color3 = 100
var cactusX = 500
var cactusY = 200

function draw() {
    background(246, 235, 216);
    var skyX = 0
    var skyX2 = 600
    var skyY2 = 125
    for (var skyY = 0; skyY<250; skyY+= 8){           //drawing the lines for sky
        strokeWeight(.5);
        stroke(71, 61, color3)
        line(skyX, skyY, skyX2, skyY2);
    }

    var x1 = 0;
    var y1 = 300;
    var x2 = 400;
    var y2 = 250;
    var y3 = 275
    //ground
    for (var y1=300; y1>=250; y1+=-2) {               //ground right up
        stroke(159, 135, 94);
        strokeWeight(1);
        line(x1, y1, x2, y2);
    }
    for (var y2; y2<= 300; y2 +=2){     //ground left up
        stroke(82, 66, 38);
        strokeWeight(1);
        line(x1, y1, x2, y2);
    }
    for(var y3 = 275; y3 <= 300; y3 +=2){     //ground across
        stroke(198, 184, 153);
        line(x1, y3, x2, y3);
    }
    //cactus
    fill(53, 68, 52);
    ellipse(cactusX-20, cactusY, 35, 15);       // left
    ellipse(cactusX+20, cactusY-20, 45, 15);   // right arm
    ellipse(cactusX-35, cactusY-12, 10, 25); // top left
    ellipse(cactusX, cactusY, 20, 100);     //main
    ellipse(cactusX+40, cactusY-30, 5, 15);  //right top

    // bike wheel arcs
    noFill();
    strokeWeight(7);
    stroke(115, 45, 4);
    arc(100, heightGround-bikeWheel-5, 2*bikeWheel, 2*bikeWheel, radians(190), radians(0));   // arc on left tire
    arc(300, heightGround-bikeWheel-5, 2*bikeWheel, 2*bikeWheel, radians(190), radians(0));   //arc on right tire
    // bike from right wheel
    push();
    translate(300, heightGround-bikeWheel);             //moving wheel to correct place
    rotate(radians(-163))       // rotating line 9 degrees evertime it draws a new line
    line(0,0,60,bikeWheel+45);
    line(50, bikeWheel+45, 70, bikeWheel+55 )     // far handle              // drawing vertical line
    line(60, bikeWheel+45,80, bikeWheel+45)       // close handle
    pop();
    // bike from left wheel
    push();
    translate(100, heightGround-bikeWheel);             //moving origin to correct place
    rotate(radians(-163))       // rotating lines
    line(-60,bikeWheel-30,-150,bikeWheel+70);          // across
    line(0,0,-60,bikeWheel-30);           // line to the line holding seat                                       // drawing vertical line
    line(-60, bikeWheel-30, -20, 90)      // line holding up seat
    push();
    rotate(radians(-30));
    ellipse(-60, 70, 60, 6);
    pop();
    line(0,0,-30,bikeWheel+15);           // line 2 to the line holding seat
    line(-30,bikeWheel+15, -150, bikeWheel+70);    //across 2
    pop();

    // bike wheel left
    if(wheel <= 1){
        for(var i=0; i<4*numLines; i += 1){          // how many times it runs (4*numlines to get it to 360)
            stroke(64, 38, 22);                          // shade of brown
            strokeWeight(.5);
            push();
            translate(100, heightGround-bikeWheel);             //moving wheel to correct place
            rotate(radians((i/2)*180/numLines))       // rotating line 9 degrees evertime it draws a new line
            line(0,0,0,bikeWheel);                    // drawing vertical line
            pop();
        }
    }
    if ( wheel <= 2 & wheel > 1){
        for( var i=0; i<6*numLines; i += 1){          // how many times it runs (4*numlines to get it to 360)
            stroke(64, 38, 22);                          // shade of brown
            strokeWeight(.5);
            push();
            translate(100, heightGround-bikeWheel);             //moving wheel to correct place
            rotate(radians((i/3)*180/numLines))       // rotating line 9 degrees evertime it draws a new line
            line(0,0,0,bikeWheel);                    // drawing vertical line
            pop();
        }
    }

    // bike wheel right
    if(wheel <= 1){
        for(var i=0; i<4*numLines; i += 1){          // how many times it runs (4*numlines to get it to 360)
            stroke(64, 38, 22);                          // shade of brown
            strokeWeight(.5);
            push();
            translate(300, heightGround-bikeWheel);             //moving wheel to correct place
            rotate(radians((i/2)*180/numLines))       // rotating line 9 degrees evertime it draws a new line
            line(0,0,0,bikeWheel);                    // drawing vertical line
            pop();
        }
    }
    if ( wheel <= 2 & wheel > 1){
        for( var i=0; i<6*numLines; i += 1){          // how many times it runs (4*numlines to get it to 360)
            stroke(64, 38, 22);                          // shade of brown
            strokeWeight(.5);
            push();
            translate(300, heightGround-bikeWheel);             //moving wheel to correct place
            rotate(radians((i/3)*180/numLines))       // rotating line 9 degrees evertime it draws a new line
            line(0,0,0,bikeWheel);                    // drawing vertical line
            pop();
        }
    }

    //bike tire left
    push();
    noFill();
    strokeWeight(4);
    stroke(64, 38, 22)
    translate(100, heightGround-bikeWheel);
    circle(0,0,2*bikeWheel);                      // drawing the tire
    pop();
    //bike tire right
    push();
    noFill();
    strokeWeight(4);
    stroke(64, 38, 22)
    translate(300, heightGround-bikeWheel);
    circle(0,0,2*bikeWheel);
    pop();

    wheel += .1                                   // wheels move
    if (wheel > 2){
        wheel = 0;
    }

    color3 += .5                                  // color of sky changes
    if (color3 > 300){
        color3 = 100
    }

    cactusX += -5                                // cactus moves
    if (cactusX < -100){
        cactusX = 500
    }
}
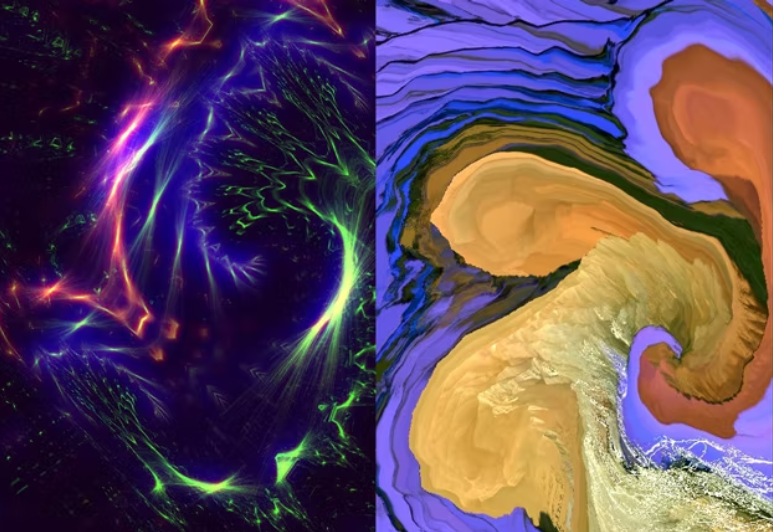
Looking Outwards 04: Sound Art – MilkDrop
One of the areas of sound and computation I find interesting is audio visualization. One of the plug-ins that makes audio visualization possible is a program called MilkDrop. It was created in 2001 by Ryan Geiss. It creates abstract art from songs. It is created through the use of 3d graphics hardware, image rendering techniques, and multiple equations that creates custom shapes and waves. The reason I find it interesting is that I have always been fascinated by the idea of Synesthesia when people can see sound. Although I can’t visualize sound, I associate certain songs/ genres of songs with certain color pallets. I am curious about how this program works because how music makes one person feel is very subjective. For example, there are some genres of music that I would associate with a certain color, however other people might disagree. Would the visualization be an interpretation of the creator’s thought process or is it customizable somehow to each user? If it were to be customizable how would the algorithm change? Would just the color change or the shapes as well? Since songs make everyone feel different emotions, interpretations also change.
http://www.hitsquad.com/smm/programs/MilkDrop/