![[OLD SEMESTER] 15-104 • Introduction to Computing for Creative Practice](https://courses.ideate.cmu.edu/15-104/f2022/wp-content/uploads/2023/09/stop-banner.png)
This week I’m looking at the work of Dr. Lev Manovich, particularly his ‘On Broadway’ project which was inspired by Edward Ruscha’s 1966 unfolding photo book titled ‘Every Building on the Sunset Strip’.
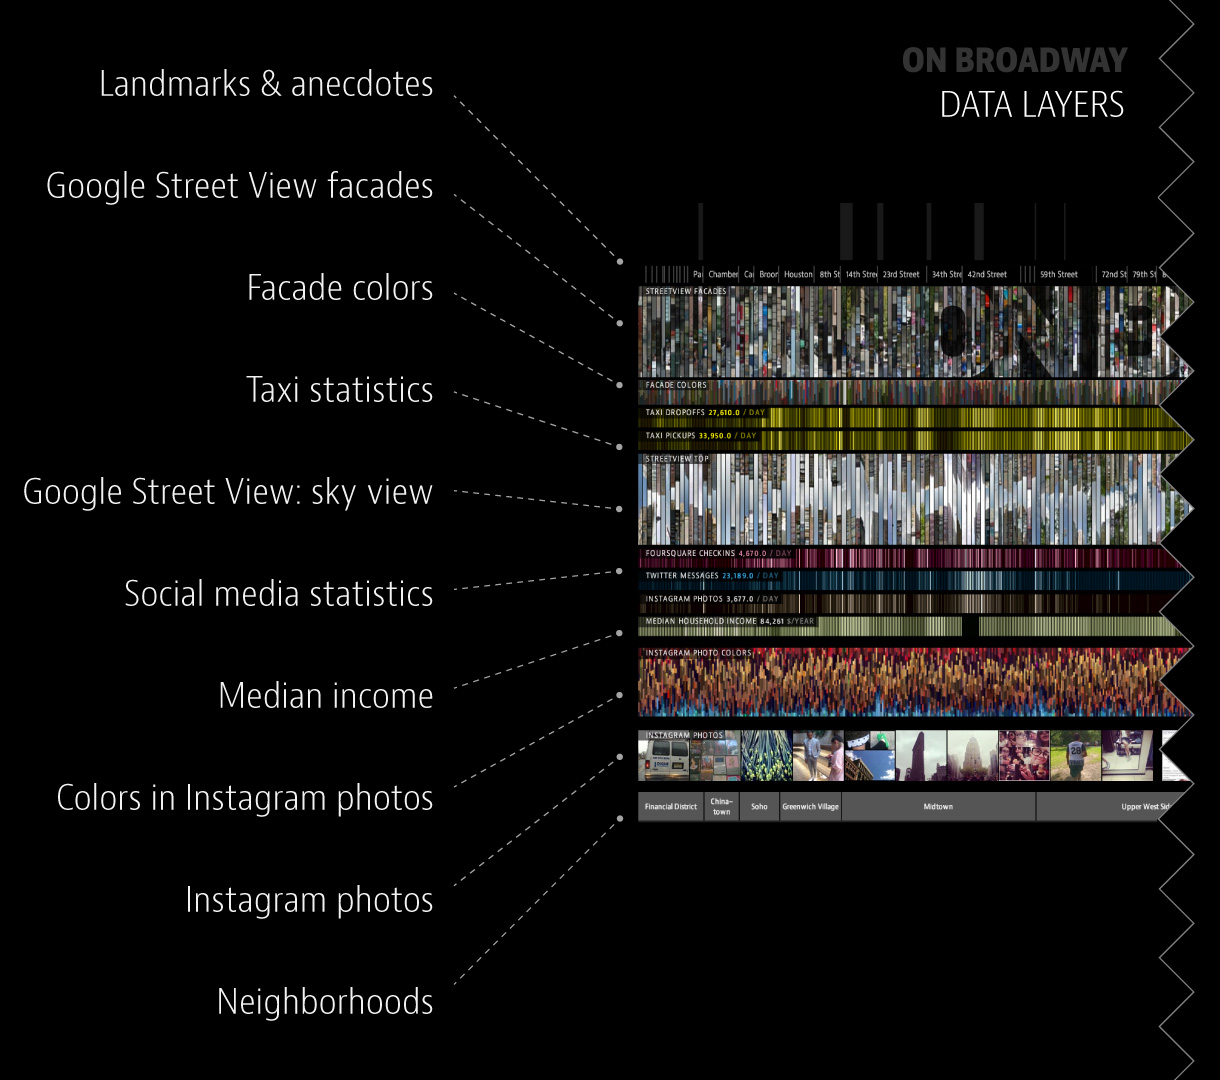
To gather data, Manovich and his team chose anchor points along Broadway to create 100 meter wide ‘slices’ which were combined to create a spine-like shape. The coordinates of the shape were then used to filter all of the data gathered, including Instagram posts made within each 100 meter section, Google images, Twitter posts, taxi pickups and drop offs, average household income, and Foursquare data.
The data was organized and presented in an interactive, layered visual with which users could slide around, zoom in on, and learn more about through the various data sections.
I love how this project was rendered in the final presentation to use color palettes and images as means of containing the data. The end result is clean, aesthetic, and easy to navigate as it unfolds into different layers.