Looking Outward 11 – Racial Biases in Artificial Intelligence

In this article, Meilan Solly discusses a project (ImageNet Roulette) by Trevor Paglen and Kate Crawford that was created to expose the highly flawed and derogatory nature of AI human categorization. The project in question took the form of an AI driven identification tool that, when supplied with an image of a person, would return the category to which that image belongs (according to the algorithm). Categories or identifiers ranged on a spectrum of neutral to problematic terms like ‘pervert’, ‘alky (alcoholic)’, and ‘slut’.

While the category names are disturbing in and of themselves, the trends of categorization were far more so. Generally, the algorithm would sort people of color and women into extremely offensive categories at a disproportionately high rate. While no type of person was entirely safe from a harmful identifier, the disparity was clear. Solly describes a trial of the algorithm by a twitter user who uploaded photos of himself in various contexts and was only returned the tags “Black, Black African, Negroid, and Negro” (Solly). Paglen and Crawford have since removed ImageNet Roulette from the internet given that it has “made it’s point” (Solly), however it is still available as an art installation in Milan.

7-Training-Humans-24.jpg
ImageNet Roulette Installation

The implications of this project run deep. Arbitrary categorization of people on its own may have little consequence, but the underlying system to which it alludes is the same system that functions in the background of active AI processes with real world applications. Beyond this, the project makes comments on the concept of privacy online, having used thousands of images sourced from various locations without consent.

Looking Outward 09 / Caitlin Morris

Caitlin Morris is a researcher with MIT and has been faculty at the School for Poetic Computation since its founding in 2013. She holds a BS in Cognitive Psychology and Architectural Sciences and an MFA in Design and Technology. Her career focus is on the complex relationship between humans and our collective environment, as well as the concept of perception in regard to the natural world.
I chose to look at Morris’ 2018 project Seed and Signal for this weeks blog. This particular work is a sculpture meant to simulate the reflection of a tree in the water. A large blue board serves the base of the work, onto which dozens of square and diamond shaped golden plates are mounted. As the plates fold in and open outward, taking up different degrees of reflection depending on where you stand, the piece creates random but coordinated movement across the board.
I enjoy the simplicity of this project, and the visual is calming. It is not based in realism yet still feels as natural as watching reflections on the water. The stated objective of this piece is to visually manifest Morris’ perspective that ‘scientific theories are reflections of the reality beneath’.

Seed and Signal, 2018

Looking Outwards / Brian House

Brian House is an accomplished artist working with ‘human and nonhuman systems’ to create works that translate data into visual and audible experiences. He studied at multiple universities, earning degrees in Computer Science and Computer Music/Multimedia [Columbia (bachelors), Chalmers tekniska högskola (masters), and Brown (PhD)], and is currently an art professor at Lewis and Clark College in Portland.

House’s methods of data collection, as well as his productions, are multidisciplinary, focusing not only on the existing rhythms and natural trends of environmental dynamics but on the human impacts on these trends. His work spans past, present, and future, visual art, music, and technology. Much of his work– if not, all– is focused on emphasizing the importance of environmental awareness. Despite being grounded in science and data collection, these works are historically, culturally, and politically aware. When speaking about his work, House tends to provide such context prior to explanations of a given project’s approach, method, objective, and result. His speech for Eyeo 2018 opened with an acknowledgment of the Indigenous land upon which the venue was built. I admire the conscientiousness in both his work and his presentations, as well as the common thread of translating the world around us into something we can hear. House’s projects are extremely powerful, moving, and at the same time, more educational than I had expected.

Animas, 2017

My favorite project of his is Animas (2017). The objective of this work was to convert the real-time fluctuations of the Animas river’s heavy metal content into audible vibrational tones. Collecting data through water sensors installed in the river, House suspended sheets of the four heavy metals which had surpassed safe levels in the Animas. Each sheet was rigged with a sensor and amplifier which projected the individual frequencies of the metals in correspondence with their level fluctuations in the Animas.

A brief sound clip of Animas.
Water sensor installed in the Animas River to collect real-time data.

Looking Outward 07 / Dr. Lev Manovich

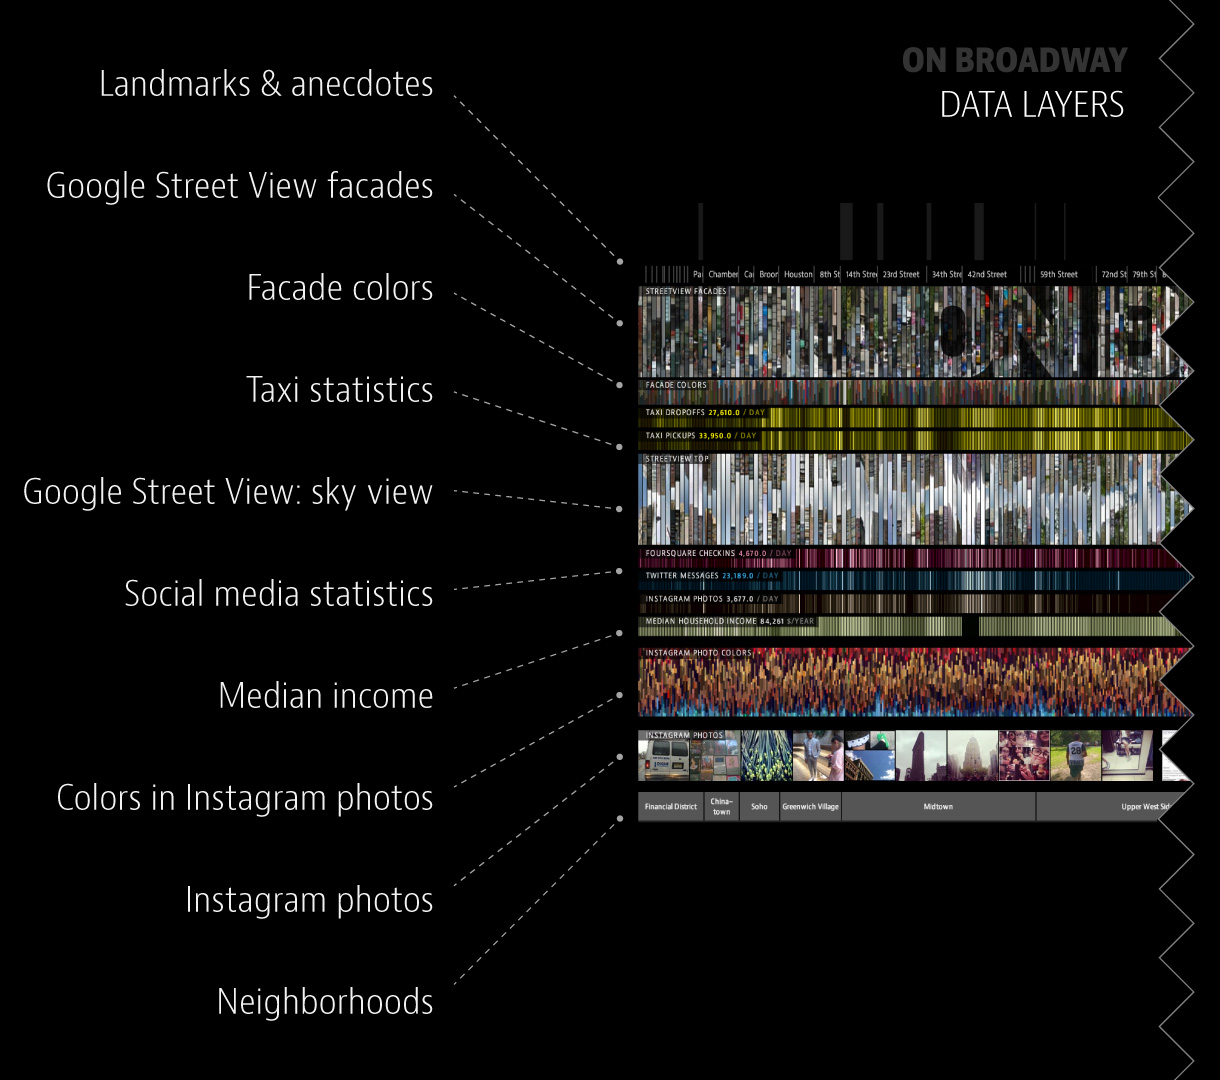
This week I’m looking at the work of Dr. Lev Manovich, particularly his ‘On Broadway’ project which was inspired by Edward Ruscha’s 1966 unfolding photo book titled ‘Every Building on the Sunset Strip’.
To gather data, Manovich and his team chose anchor points along Broadway to create 100 meter wide ‘slices’ which were combined to create a spine-like shape. The coordinates of the shape were then used to filter all of the data gathered, including Instagram posts made within each 100 meter section, Google images, Twitter posts, taxi pickups and drop offs, average household income, and Foursquare data.

“On Broadway” project display.


The data was organized and presented in an interactive, layered visual with which users could slide around, zoom in on, and learn more about through the various data sections.
I love how this project was rendered in the final presentation to use color palettes and images as means of containing the data. The end result is clean, aesthetic, and easy to navigate as it unfolds into different layers.

Looking Outward 06 / Electric Sheep

This is probably one of the more obvious examples of randomness in digital art, but I still find the overall concept really interesting.
Electric Sheep (a project founded by Scott Draves) is a collaborative and dynamic body of abstract work that can be downloaded to most devices. The program runs while devices are in “sleep” mode, communicating via the internet with other devices around the world to create and change the animations (or “sheep”) on display. Users can vote for their favorite ‘sheep’ with their keyboard, which generates new sheep via the algorithm. Sheep can also be “mated together” manually by server administrators or by users who download existing parameters and make changes.

The reason I chose this work for the blog this week is because of its focus on interactivity. The fact that this is a collaborative project between thousands of different computers is fascinating. And while there is an underlying element of randomness with the automatic ‘mating’ of sheep through the algorithm, users can also participate in generating/supplying new sheep to the flock.

Project 05 / Wallpaper

sketchDownload
// Kyli Hilaire - Project 05
// khilaire@andrew.cmu.edu 
// Section B 

var x = 0;
var y = 0;
var beeWidth = 30;
var beeLength = 38;
var stripeY = 0;

function setup() {
    createCanvas(400, 300);
    background(247, 183, 191);
}

function draw() { 
    bgStripes();
    // draw background stripes

    push();
    translate(-45, -18); 
    // move bees in the canvas
    for(x = 0; x <= 500; x += 75) {
        for(y = 0; y <= 400; y += 75) {
            bee(); 
        }
    } pop();
    // draw bees

    for(x = 0; x <= 500; x += 75){
        for(y = 0; y <= 400; y += 75){
            greenCircles();
        }
    } 
    // draw green circles
}

function bee() {
    beeWings();
    beeBody();
}

function beeBody() {
    stroke(245, 242, 158);
    strokeWeight(1);
    fill(255, 255, 188);
    ellipse(x + 50, y + 50, beeWidth, beeLength);
    // yellow oval 
    stroke(80);
    strokeWeight(4);
    line(x + 39, y + 42, x + 61, y + 42);
    line(x + 38, y + 52, x + 62, y + 52);
    line(x + 41, y + 62, x + 59, y + 62);
    // draw bee stripes
    noStroke();
    fill(95)
    triangle(x + 44, y + 68, x + 56, y + 68, x + 50, y + 74);
    // stinger 
}

function beeWings() {
    noStroke();
    fill(255, 255, 240);
    arc(x + 50, y + 50, 65, 50, 11*PI/6, PI/6);
    arc(x + 50, y + 50, 65, 50, 5*PI/6, 7*PI/6);
    // bee wing arcs
    stroke(0);
    strokeWeight(1);
    line(x + 50, y + 50, x + 75, y + 50);
    line(x + 25, y + 50, x + 50, y + 50);
}

function bgStripes() {
    for(let i = 0; i <= 300; i += 10) {
        stroke(255, 251, 236);
        strokeWeight(0.75);
        line(0, stripeY + 2, 400, stripeY + 2);
        stripeY += 16 
        // space lines 16px apart 
    }   
}

function greenCircles() {
    noStroke();
    fill(216, 238, 219);
    circle(x + 14, y + 61, 5);
    circle(x + 20, y + 54, 8);
    circle(x + 22, y + 63, 3);
    // bottom right of bee 

    circle(x + 60, y + 10, 5);
    circle(x + 65, y + 7, 3);
    // upper left of bee
    
    stroke(216, 238, 219);
    strokeWeight(2);
    point(x + 61, y + 3);
    // small point upper left
}

3D Art / Filip Hondas

I find Filip Hodas’ ability to take characters and images we’re so familiar with out of the worlds to which they belong super fascinating. The Super Mario mushroom and the Gameboy building are some of my favorite of his works.
As someone who struggles with realism using paint/graphite, I’m particularly impressed by his ability to create things that are very much in the world but still have this surreal glow about them. I can’t imagine trying to make work like this at all, let alone on a computer.

I struggled to find a comprehensive online catalog of his work, but this article provides a decent overview of his style.

https://www.thecoolector.com/filip-hodas-artwork/

Moments of Inertia / Luke DuBois / Looking Outwards 04 – Sound Art

This week I’m looking at a project by Luke DuBois titled Moments of Inertia. This is a series combining the music of violinist Todd Reynolds and “interactive video”.

To create the images seen, DuBois’ built software that reorganizes and maps Reynolds’ audio loops onto visual imagery. The computer uses analysis of changes in pitch, amplitude, and performance style to re-animate footage of people moving and interacting with the world in various ways (playing a sport, using a phone, etc.). This method of perception can be very uncomfortable and fascinating in its own right. I think the contemporary process of music making that gives this work its roots is also very interesting. I wonder if it would have the same effect if more ‘traditional’ music was used instead.

Moments of Inertia (2010) from R. Luke DuBois on Vimeo.

Project 4

sketch
var dx1; 
var dy1; 
var dx2; 
var dy2; 

var dxOne;
var dyOne;
var dxTwo;
var dyTwo; 

var numLine = 50;
var numLineTwo = 40;

function setup() {
    createCanvas(400, 300);
    background(18, 77, 26);
    
    strokeWeight(2);
    // all lines two pixels wide 

    dx1 = (150-50)/numLine;
    dy1 = (300-50)/numLine;
    dx2 = (350-300)/numLine;
    dy2 = (100-300)/numLine;
    

    dxOne = (400 - 340)/numLineTwo;
    dyOne = (200 - 0)/numLineTwo;
    dxTwo = (50 - 220)/numLineTwo;
    dyTwo = (80 - 0)/numLineTwo;
}

function draw() {

    var x1 = 5;
    var y1 = 115;
    var x2 = 180;
    var y2 = 175;
    // x and y values for left shape and vert lines

    for(i  = 0; i <= numLine; i++) {
        stroke(232, 221, 202);
        line(x1, y1, x2, y2);
            x1 += dx1 + 5;
            y1 += dy1;
            x2 += dx2 - 2;
            y2 += dy2 - 4;
    } // draw left shape, advance by one pixel

    for(i = 0; i <= numLine; i+= 4) {
        stroke(16, 46, 14);
        line(x1, y1, x2, y2);
            x1 += dx2 + 80;
            y1 += dy1 + 120;
            x2 += dx1;
            y2 += dy2;
    } // draw right side vert lines, advance by four pixels

    var xOne = 120;
    var yOne = 0;
    var xTwo = 300;
    var yTwo = 20;
    // x and y values for orange shape

    for(i = 0; i <= numLineTwo; i ++) {
        stroke(122, 65, 15);
        line(xOne, yOne, xTwo, yTwo);
            xOne += dxOne;
            yOne += dyOne;
            xTwo += dxTwo;
            yTwo += dyTwo;
    } // draw orange shape
    
    noLoop();
}

pliii – Tina Frank

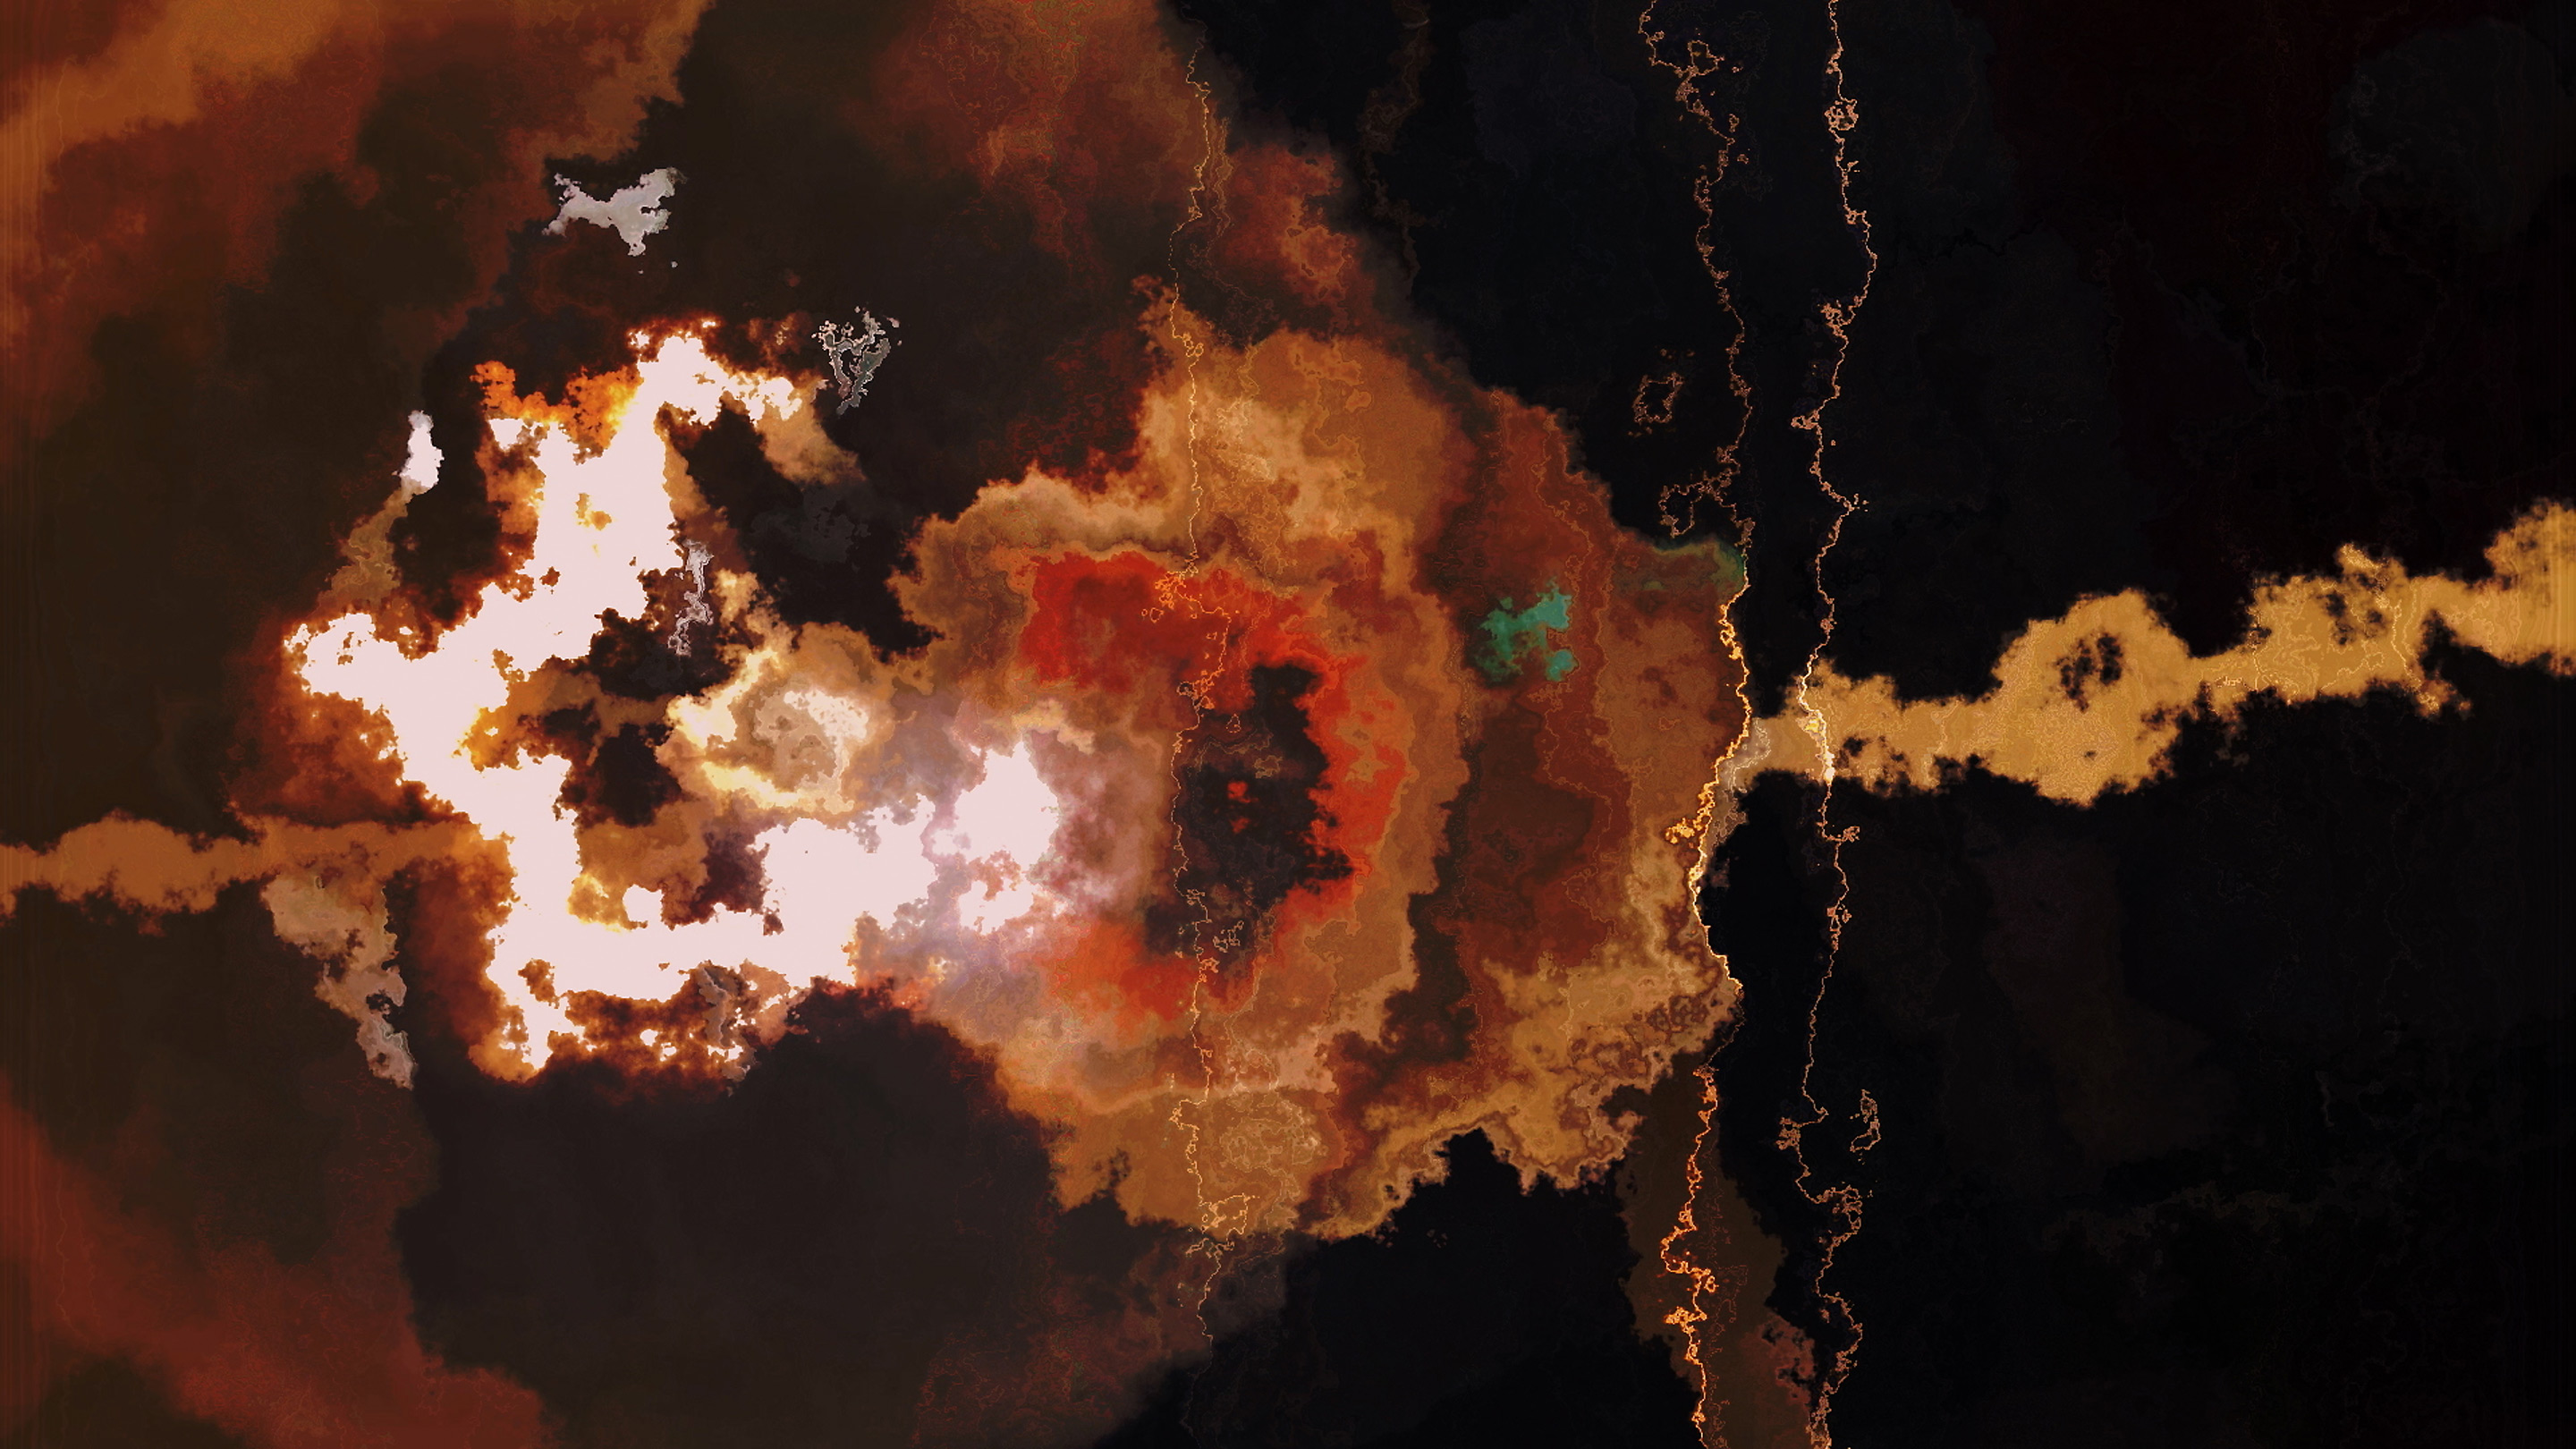
‘pliii’ by Tina Frank is a project dedicated to her late friend, musician and collaborating artist Peter Rehberg. It is a continuation of the project they published together in 1996 titled ‘iii’. To create the images for this work, Frank recorded the on and off flicker of an LED lamp, then processed the recordings using various methods. After isolating the central visuals, she altered speed, frame, and color to create the movement that we see on screen.

I suppose what I admire most about the project is that she has taken something so mundane and turned it into a complex and dynamic work of art. I also appreciate Frank’s continued emphasis on the interaction between sound (which, in this project, includes high frequency waves from the same LED lamp) and visuals. It is clear that Frank is in tune with that which cannot be immediately seen or heard, and this makes her art-style distinct. Rather than being led by common aesthetics, she has built an artistic voice out of experiences that the majority of us cannot easily access.

[flash warning]

pliii (Trailer) from Tina Frank on Vimeo.

(above image sourced from sixpackfilm.com)