Project 09: Computational Portrait

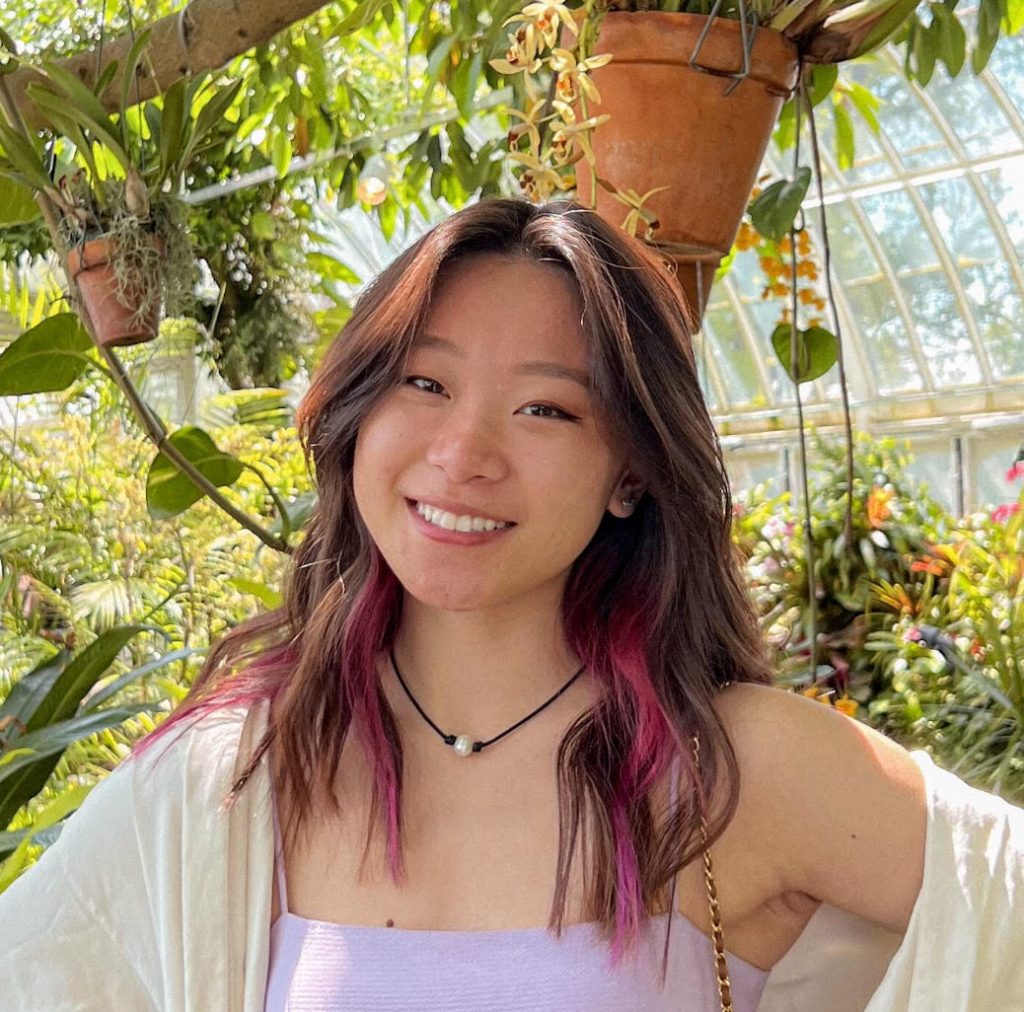
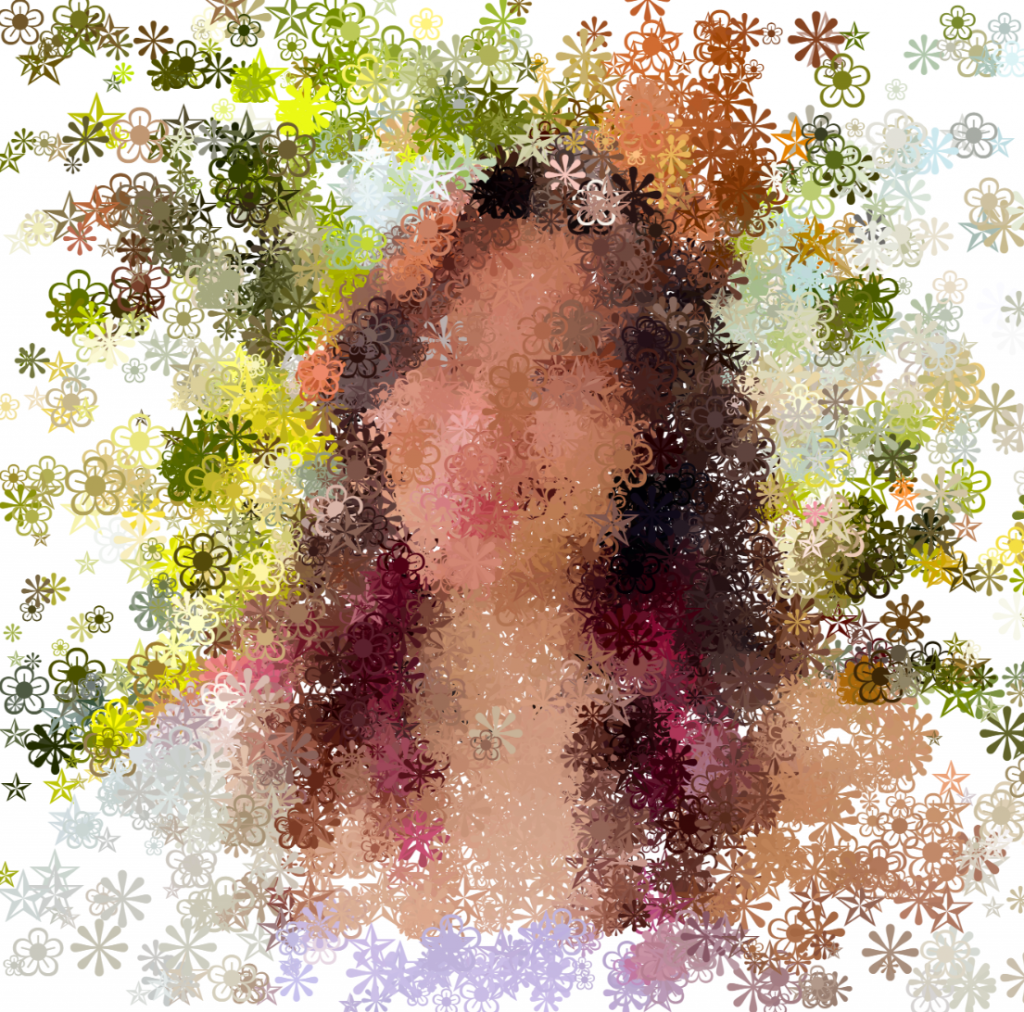
I created my self-portrait using different symbols that are linked to the pixel colors on the image. When the mouse is pressed, the shapes are drawn to create the image.

sketch
//amy hu
//amyhu
//section d

var img;
var smallPoint, largePoint;
var symbols = ["❀", "❋", "✯"]

function preload() {
    img = loadImage('https://i.imgur.com/2ZzOdG6.png');
}

function setup() {
    createCanvas(450,450);
    // smallPoint = 5;
    // largePoint = 20;
    imageMode(CENTER);
    noStroke();
    background(255);
    img.loadPixels();
}

function draw() {
    //mouse location determines point size
    var pointillize = map(mouseX, 0, width, smallPoint, largePoint);

    //picks random x y value
    var x = floor(random(img.width));
    var y = floor(random(img.height));

    //gets pixel color form a xy value
    var pix = img.get(mouseX, mouseY);

    //fills pixel color
    fill(pix, 128);
    ellipse(x, y, pointillize, pointillize);

    //draws symbols when mouse is pressed 
    if(mouseIsPressed){
        textSize(random(10,35));
        text(random(symbols), mouseX, mouseY);
    }
}

LO 09: Women in Computational Art

I looked at the project A Global Retail Interactive for the brand On Running by Vera-Maria Glahn. Glahn is a digital artist who combines data art and immersive experiences to create immersive storytelling. This project is a digital wall of gradient colors with motion sensors that tracks the movement of people in front of it. I think this is a smart design for a running store because it allows interaction between the product of the store and the artistic installation design of the walls. The customer can try on the shoes and run across the wall and the wall would respond to the movement and create a biomechanical profile of their movement, resulting in digital art. When the customers return after their purchase they can run again and the digital wall can show how the shoe can improve their performance. This system is composed of multiple motion sensors that capture the running motion from 3 angles. I find it inspiring how digital programming can create a system that can both be useful to track and compare running data and create artistic art.

Link https://field.systems/work/on-running-try-on-global-retail-interactive

LO 8: The creative practice of an individual

Christina “Phazero” Curlee is a video game and video artist. She designs video games that express her emotions and childhood experiences and connects the audience to themselves to help them discover who they are as a person. I think it’s really interesting how video games can be connected to someone’s inner feelings and emotions and not something superficial like tactical shooters. I have never seen anything similar before. Curlee also had a different style of learning for game making because she has a fine arts background where she uses and combines it with game development to create her own style. She focuses on using symbols, experiences, and nonverbal communication in her work. Her current project Artifacts lets users experience her life through a lucid dream-like state to help them become closer to themselves. I think it is really powerful how she is able to create a game that can help people understand themselves and possibly allow them to grow emotionally. Curlee does a good job presenting by explaining her passion and how her work is unique and her previous life experiences and then her projects and how her experiences helped her develop her style.

link

LO 7: Visualizing Information

I looked at the project about Flight Patterns that represent visual information. This project plots flight patterns throughout the US visually using colors and lines. It was created as an experimental project for “Celestial Mechanics” by Scott Hessles and Gabriel Dunne at UCLA. I find this visual data intriguing because flight patterns are not something explicitly visual so it’s interesting to see what areas and cities have the most air traffic which is visually represented in this project as varying colors of lines with lighter lines as more trafficked areas. when zooming into a specific city the data is detailed enough to see the specific flight patterns within the city itself. The algorithm was developed with data that is processed through the Processing program which plots out the lines visually.

website link

Project 06: Abstract Clock

I created a lighthouse clock. The ocean level represents the hour of the day with low tide as hour 0 or midnight and when the water level reaches the top of the canvas, or floods the island, it is 11:00. The lighthouse’s beam rotates each minute and the lighthouse beam flashes each second.

sketch
//amyhu
//amhyhu@adrew.cmu.edu
//section d 

var h;  //hour
var m;  //minute
var s;  //second
var theta = 6; //angle to increase by each minute
var r = 500;    //radius of light beam

function setup() {
    createCanvas(450,450);
    background(220);
}

function draw() {
    background("lightblue");

    let h = hour();
    let m = minute();
    let s = second();

    //water level is hour 
    fill("blue");
    h = map(h,0,24,0,height);
    rect(0, height-h, width, height);


    //lighthouse object
    drawLighthouse();

    //island object
    drawIsland();

    //light beam speed is what minute it is
    push();
    translate(125,135);
    var x = r*cos(radians(theta*m));
    var y = r*sin(radians(theta*m));

    //light beam flashing every second
    if(s % 2 == 0){
        stroke("yellow");
        strokeWeight(18);
        line(0,0,x,y);   
    }else{
        stroke("white");
        strokeWeight(18);
        line(0,0,x,y);
    }
    pop();
}

function drawIsland(){
    fill("lightyellow");
    //noStroke();
    ellipse(0,height,500);
}

function drawLighthouse(){
    //rectMode(CENTER);
    //stroke(1);
    fill("white");
    rect(110,120,30,50);    //top white bit
    fill("red");
    rect(100,150,50,200);   //red
    fill("white");
    rect(100,170,50,20);    //white stripe
    fill("yellow");
    circle(125,135,20);      //light circle
}

LO 06: Randomness

The project Sprawl by Mark J. Stock intrigues me with the correlation between randomness and naturalistic inspired art. Mark J. Stock is a generative artist who combines nature and computation in his work. In this project, he creates an organic branching structure growing on a regular array of blocks. The algorithm used sets particles at specific points and uses a random walk algorithm to let them grow until they strike a part of the existing block structure. The generated art creates a natural like growth pattern but it is interesting to see how randomness can contrast and interact with regulated forms such as the block array. I find it intriguing that some parts of the grown pattern can become restrained and seem not random but other parts are chaotic and sparatic. Stock claims that “this contrast refers to the creeping growth of our built environment”.

Link

Project 05: Wallpaper

sketch
//amyhu
//amyhu@andrew.cmu.edu
//section d
//project 05

var s = 100

function setup() {
    createCanvas(600,600);
    background(220);
}

function draw() {
    //first column 
    for(let y = 0; y <= 600; y += 100){
        for(let x = 0; x <=600; x += 200){
            drawSquare(x,y);
        }
    }

    //offset column
    for(let y = -s/2; y <= 600; y += 100){
        for(let x = s; x <=600; x += 200){
            drawSquare(x,y);
        }
    }
}


function drawSquare(x,y){
    fill(50,10,40);
    noStroke();
    square(x,y,s);


    fill(130,2,99);
    arc(x+s,y,s,s,(radians(90)),-(radians(180)));
    fill(217,3,104);
    arc(x,y,s,s,0,(radians(90)));
    fill(234,222,218)
    arc(x,y+s,s,s,(radians(270)),(radians(0)));
    fill(46,41,78);
    arc(x+s,y+s,s,s,(radians(180)),(radians(270))); 
}

//offseted column
// function drawSquares(a,b){
//     fill(240);
//     square(x,y,s);
//     fill("red"); 
//     arc(x+s,y,s,s,(radians(90)),-(radians(180)));
//     arc(x,y,s,s,0,(radians(90)));
//     arc(x,y+s,s,s,(radians(270)),(radians(0)));
//     arc(x+s,y+s,s,s,(radians(180)),(radians(270))); 
// }

LO 05- 3d computer graphics

I looked at the project To All The Good Books by Hao-Yun Cheng. The project showcases a boy reading books and looks at an imaginary scene of a small town with books as buildings. The artist’s inspiration behind the design is his love for books way which can allow him to immerse himself in imagination. The scene on the table is representative of the imagination of the land with books. This project was created using a combination of 3d modeling software and photography images to create the final outcome. This project also shows the possibilities with 3d computer graphics and rendering software to create what can only be imagined and combine with realistic elements to tell a story.

Link

Project 04: String Art

string art
//Amy Hu
//amyhu
//Section D

var dx1;
var dy1;
var dx2;
var dy2;
var numLines = 30;

function setup() {
    createCanvas(400, 400);
    background(200);

    for(var angle = 0; angle <= 360; angle += 45){
        translate(width/2,height/2);
        line(0,-50,0,-150);
        line(150,0,50,0);
        dx1 = (0-0)/numLines;        
        dy1 = (-150+50)/numLines;
        dx2 = (50-150)/numLines;       
        dy2 = (0-0)/numLines;
        rotate(radians(angle));
    }

}

function draw() {

    translate(width/2,height/2);

    for(var angle = 0; angle <= 360; angle += 45){
        var x1 = 0;
        var y1 = -50;
        var x2 = 150;
        var y2 = 0;
        for (var i = 0; i <= numLines; i += 1) {
            line(x1, y1, x2, y2);
            x1 += dx1;
            y1 += dy1;
            x2 += dx2;
            y2 += dy2;
        }
        rotate(radians(angle));
    }
    

    noLoop();
}

LO 04: Sound Art

The project ‘FORMS – String Quartet’ by Playmodes is a live performance of a string quartet and EDM music that projects to the visual sonification of the music. It uses real-time music to transcribe into a series of visual graphic notations in the form of lines, circles, curves, and other shapes. I think visualizing music is intriguing and the patterns of music can generate different forms of lines and representation that is also beautiful. This can really help those who are hard of hearing or may prefer visual experiences more where people may also be able to hear what they see. The visual graphics the music produces also seem to tell a story about what the music is like and it is able to isolate each instrument used in the song. This reminds me of the way EDM concerts have light shows that follow the patterns and beats in the music to create a more immersive experience. The visuals can also be transformed into music. The software that makes the graphics was coded in Processing and the image sonification was done in Max/MSP. The algorithm that makes it is able to isolate each instrument or rhythm and transform it into visuals and the other way around, whatever is on the screen can be translated into music.

Website Link