Project 07 – srauch – curves

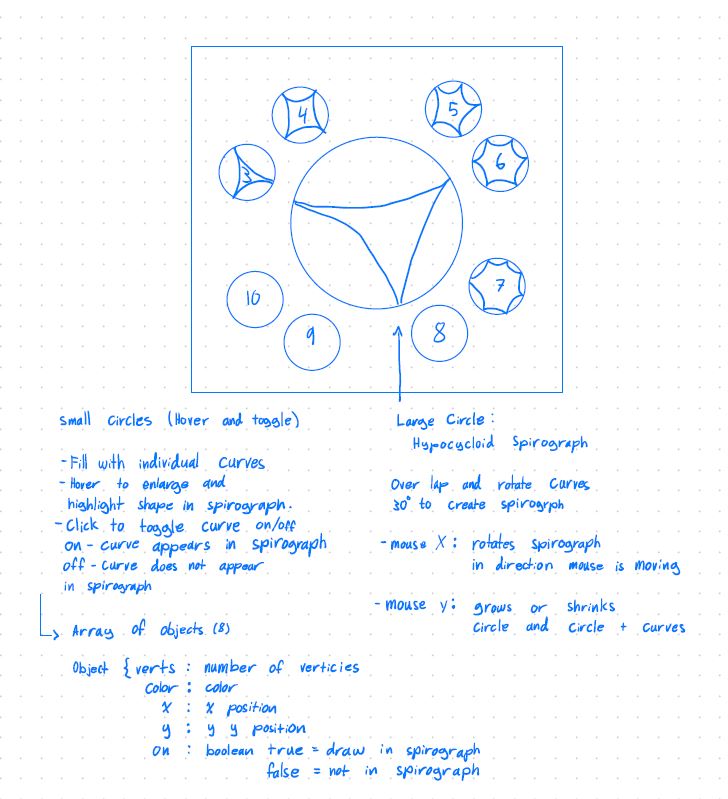
Here is my program that runs on curves. I call it “laser ballerinas”. Move your mouse left to right to increase the size of the curves and the overall rotation, and move your mouse up and down to change the number of “lobes” on each curve. Click to change the colors of each lobe!

sketch

//Sam Rauch, section B, srauch@andrew.cmu.edu, project 07
//This code produces a "laser ballerinas" using epicycloid curves. Ten epicycloid curves of decreasing
//size and random colors are drawn on top of each other to produce "nested curves", and six nested curves
//are drawn in a hexagon pattern around the center of the canvas, which spins. MouseX controls the size of
//the curves and the rotation of the hexagon pattern, while mouseY controls the number of "lobes" produced
//in each epicycloid curve. Click to change the colors of the ballerinas!

var coloroptions;

function setup() {
    createCanvas(400, 400);
    background(220);
    text("p5.js vers 0.9.0 test.", 10, 15);

    coloroptions = [];
    for (var i = 0; i < 9; i++) {
        coloroptions[i] = color(random(255), random(255), random(255));
    }

}

function draw() {
    background(0);
    translate(width/2, height/2);
    
    //create spin the hexagon of curves around the center of the canvas according to mouseX
    push();
    var spinamt = map(mouseX, 0, width, 0, 2*PI)
    rotate(spinamt);


    //draws six nested curves in a hexagon pattern
    for (var i = 0; i < 6; i++){
        push();
        translate(100, 0);
        nestedCurve();
        pop();
        rotate(radians(60));
    }

    pop();

}

//generates epicycloid curve (https://mathworld.wolfram.com/Epicycloid.html) with center at 0,0
function drawCurve(color){ 
    
    noFill();
    stroke(color);
    strokeCap(ROUND);
    strokeJoin(ROUND);
    strokeWeight(3);

    var points = 80;
    var xValues = [];
    var yValues = [];
    var a = mouseX/4; //radius of larger inner circle 
    var b = constrain(mouseY/10, 0, a) ; //40; //radius of smaller outer circle
    var theta = 0;

    //generating x and y values based on epicycloid curve forumla, and increasing the center angle
    //by a small amount
    for (var i = 0; i < points; i++) {
        theta += radians(5);
        xValues[i] = (a+b)*cos(theta) - b*cos(((a+b)/b)*theta);
        yValues[i] = (a+b)*sin(theta) - b*sin(((a+b)/b)*theta);
    }
    
    //plotting x and y values
    beginShape();
    for (var i = 0; i <points; i++) {
        vertex(xValues[i], yValues[i]);
    }
    endShape();
}

//draws ten epicycloid curves of random colors nested inside each other
function nestedCurve() {
    push();

    var size = 1;
    var sizeIncrement = 0.1;

    //draws ten epicycloid curves, but for each one, decreases scale and change color
    for (var i = 0; i < 9; i++) {
        scale(size);

        var col = coloroptions[i];
        drawCurve(col);
        size -= sizeIncrement;
    }

    pop();
}

function mousePressed(){
    for (var i = 0; i < 9; i++) {
        coloroptions[i] = color(random(255), random(255), random(255));
    }
}

Project-07: Hypocycloid Spirograph

Sketch
sketch
/* Evan Stuhlfire
 * estuhlfi@andrew.cmu.edu Section B
 * Project-07: Composition with Curves 
 * Hypocycloid Spirograph */

var rAngle = 30; // rotation angle
var rotation = 0; // degrees of rotation
var maxShapes = 8;
var shape = []; // array of shapes

function setup() {
    createCanvas(480, 480);
    background(250);
    // fill array of objects with default shapes
    createShapes();
}

function draw() {
     // redraw background
    background(250);
    stroke(200);

    // map the mouseX position to a circle for rotation radians
    var xRot = map(mouseX, 0, width, 0, TWO_PI);
    // map the mouseY to half the height to size the shape 
    var my = map(mouseY, 0, height, 50, height/2);
    // r is based on the y position and becomes the radius of the circle
    var r = constrain(my, 100, height/2 - 75);

    // add text to canvas
    addText();

    push(); // store settings
    // translate origin to center
    translate(width/2, height/2);

    // draw the small circles and their curves
    for(var s = 0; s < shape.length; s++) {
        drawSmallShapes(s, height/2 - 25);
    }


    // rotate the canvas based on the mouseX position
    rotate(xRot);
    circle(0, 0, 2 * r);
    // loop over array of shape objects
    for(var s = 0; s < shape.length; s++) {
        // drawSmallShapes(s, maxr);
        // reset degrees of rotation for each shape
        rotation = 0; 
        if(shape[s].on == true){
            // draw the curve in spirograph, 4 times for curve rotation
            for(var i = 0; i < 4; i++) {
                // rotation canvas, start at 0
                rotate(radians(rotation));
                rotation = rAngle;
                drawCurves(shape[s].verts, r, shape[s].color);
            }            
        }
    }
    pop(); // restore settings
}

function mousePressed() {
    // when a shape is clicked it is added or removed
    // from the spirograph, toggles like a button

    // map the mouse position to the translated canvas
    var mx = map(mouseX, 0, width, -240, 240);
    var my = map(mouseY, 0, height, -240, 240);

    // loop through shapes to see if clicked
    for(var i = 0; i < shape.length; i++) {
        var d = dist(shape[i].px, shape[i].py, mx, my);

        // check distance mouse click from center of a shape
        if(d <= shape[i].radius){
            // if on, set to false
            if(shape[i].on == true) {
                shape[i].on = false;  
            } else {
                // if on = false, set true
                shape[i].on = true;
            }
        }
    }
}

function addText() {
    // Add text to canvas
    fill(shape[0].colorB);
    strokeWeight(.1);
    textAlign(CENTER, CENTER);

    // title at top
    textSize(20);
    text("Hypocycloid", width/2, 8);
    text("Spirograph", width/2, 30);
    // directions at bottom
    textSize(10);
    text("Click the circles to toggle curves on or off. Reload for different pen colors.", 
        width/2, height - 5);

    noFill();
    strokeWeight(1);
}

function createShapes() {
    var vCount = 3; // start shapes with 3 verticies
    var sOn = true; // default first shape to show in spirograph
    var angle = 30;
    var shapeRad = 35;

    // create array of shape objects
    for(var i = 0; i < maxShapes; i++) {
        shape[i] = new Object();

        // set object values
        shape[i].verts = vCount;
        // generate random color Bright and Dull for each
        var r = random(255);
        var g = random(255);
        var b = random(255);

        shape[i].colorB = color(r, g, b, 255); // Bright color
        shape[i].colorM = color(r, g, b, 80); // Muted faded color
        shape[i].color = shape[i].colorM;
        shape[i].angle = angle;
        shape[i].px = 0;
        shape[i].px = 0;
        shape[i].radius = shapeRad;
        shape[i].on = sOn;

        // default shapes to not display in spirograph
        sOn = false;      
        vCount++;
        angle += 30;
        if (angle == 90 || angle == 180 || angle == 270) {
            angle += 30;
        }
    }
}

function drawSmallShapes(s, r) {
    // calculate the parametric x and y
    var px = r * cos(radians(shape[s].angle));
    var py = r * sin(radians(shape[s].angle));
    shape[s].px = px;
    shape[s].py = py;

    // map the mouse position to the translated canvas
    var mx = map(mouseX, 0, width, -240, 240);
    var my = map(mouseY, 0, height, -240, 240);

    // check if mouse is hovering over small circle
    var d = dist(shape[s].px, shape[s].py, mx, my);
    if(d <= shape[s].radius) {
        // hovering, make bigger, make brighter
        var hover = 1.25;
        shape[s].color = shape[s].colorB;
    } else {
        // not hovering, make normal size, mute color
        var hover = 1;
        shape[s].color = shape[s].colorM;
    }

    // check if shape is appearing in spriograph
    if(shape[s].on == true) {
        var c = shape[s].colorB; // bright
    } else {
        var c = shape[s].colorM; // muted
    }

    push();
    // move origin to little circle center
    translate(px, py);
    stroke(c); // set color from object
    strokeWeight(2);

    circle(0, 0, shape[s].radius * 2 * hover); // draw little circle
    // draw the curve in the little circle
    drawCurves(shape[s].verts, shape[s].radius * hover, c)
    pop();
}

function drawCurves(n, r, c) {
    // n = number of shape verticies, r = radius, c = color
    // number of vertices for drawing with beginShape
    var nPoints = 50;

    beginShape();
    for(var i = 0; i < nPoints; i++) {
        // map the number of points to a circle
        var t = map(i, 0, nPoints, 0, TWO_PI); // t = theta
        // fit the shape to the radius of the circle
        var value = r/n;
        // calculate hypocycloid at a different number of cusps.
        var px = value * ((n - 1) * cos(t) - cos((n - 1) * t));
        var py = value * ((n - 1) * sin(t) + sin((n - 1) * t)); 
    
        vertex(px, py); // add a vertex to the shape
    }
    noFill();
    stroke(c);
    strokeWeight(1);
    endShape(CLOSE); // close shape
}

Project 7 Curves

I connected mouseX and mouseY to the mapping of t to visualize the continuous movement of the curves and the larger shapes they create. It is interesting as you can watch it wind itself, giving a Spirograph effect. I then connected mouseX to a of the ranunculoid which affects the scaling from left to right. It is interesting how both x and y on the canvas determines the complexity of the shapes created. I also had fun experimenting with the different ways the shapes could be shown and decided to have the hypocycloid made of small squares.

project7
// Rachel Legg / rlegg / Section C

//# of point of each shape
var nPoints = 150;

function setup() {
    createCanvas(480, 480);
    frameRate(10);
}

function draw() {
    //draw the ranunculoid & astroid curve
    background(0, 38, 38);    //dark green-blue
    fill(255);
    push();
    translate(width/2, height/2);
    fill(121, 33, 250);        //purple
    drawRanunculoid();
    noFill();
    drawHypocycloid();
    scale(1/12);
    fill(105, 20, 235);        //darker purple
    drawRanunculoid();
    pop();

}

function drawRanunculoid() {
    //Ranunculoid : https://mathworld.wolfram.com/Ranunculoid.html

    var x;
    var y;

    var a = 30;        

    stroke(149, 198, 35);      //green
    strokeWeight(1);
    beginShape();
    for(var i = 0; i < nPoints; i++) {
        //map points to mouseX & mouseY for continuous flow
        var t = map(i, 0, nPoints, mouseX, mouseY); 
        a += mouseX / 500;                    //scale when mouseX changes
        
        //adjust to 7 to increase petals to 6
        x = (a * (7 * cos(t) - cos(7 * t)));
        y = (a * (7 * sin(t) - sin(7 * t)));
        vertex(x, y);                           //vertex gets spinograph effect
        //line(x - 5, y - 5, 10, 10);           //visually different. shows lines to center

    }
    endShape(CLOSE);
}

function drawHypocycloid() {
    //https://mathworld.wolfram.com/Hypocycloid.html

    var x;
    var y;
    

    var a = 110;        
    var b = 30;

    noFill();
    stroke(212, 223, 158);     //light green
    strokeWeight(1);
    for(var i = 0; i < nPoints; i++){
        //map points to mouseX & mouseY for continuous change
        var t = map(i, 0, nPoints, mouseX, mouseY);  

        x = ((a - b) * cos(t)) - (b * cos(t * ((a - b) / b)));
        y = ((a - b) * sin(t)) - (b * sin(t * ((a - b) / b)));
        //rectangle shapes to show patterns
        rect(x - 5, y - 5, 10, 10);
    }
}


rose curve + augmented hypocycloid

mouseX rotates and changes the size of the hypocycloid (thicker lines, filled shape). mouseY corresponds with n, which essentially determines the complexity of the curves. it took me a while to finish this because I was having too much fun spacing out while playing with it…

sketch
// jaden luscher
// jluscher@andrew.cmu.edu
// section a
// project 07: composition with curves
// HYPOCYCLOID PEDAL CURVE + ROSE CURVE

// INITIALIZING VARIABLES
var nPoints = 250;
var n;
var a;
var q;

function setup() {
  createCanvas(400, 400);
  background(200);

  frameRate(30);

}

function draw() {
  background("orange");
  noFill();

  q = constrain((mouseX / width), 0.1, 1.0);
  p = constrain((mouseY / height), 0.1, 1.0);
  n = int(p * 100);   // n corresponds to the curves' complexity
  a = int(width * p * 10);    // "radius" of rose curve increades with mouseY
  var c = 155 + (q * 100);  // fill color for hypocycloid

  translate (width/2, height/2);
  strokeWeight(q *20);    // stroke of hypocycloid corresponds to mouseX
  stroke("white");
  fill(c, 0, c, 5);
  for (i = 0; i < nPoints/10; i++) {
    drawHypocycloid();
    a = a *sqrt(q) - width*q;   // sqaure root causes many curve sizes to "cross"
  }
  a = int(width * p * 10);    // "radius" of rose curve increades with mouseY
  stroke("white");
  strokeWeight(0.5);
  rotate(PI * q);   // rose curve spins with mouseX
  drawRoseCurve();
}


function drawHypocycloid() {
  // hypocycloid pedal curve:
  // https://mathworld.wolfram.com/HypocycloidPedalCurve.html
  push();

  var x;
  var y;
  var r;

  beginShape();
  for (var i = 0; i < nPoints; i++) {
    var t = map(i, 0, nPoints, 0, TWO_PI);// sweep theta from 0 to two pi

    // hypocycloid:
    r = q * (n-2) * ((sin * (n / (n-2))) * (t + PI/2));

    x = a * (((n-1) * cos(t) + cos((n-1) * t)) / n);
    y = a * (((n-1) * sin(t) + sin((n-1) * t)) / n);
    vertex(x, y);
  }
  endShape(CLOSE);
  pop();
}


function drawRoseCurve() {
  // rose curve
  // https://mathworld.wolfram.com/RoseCurve.html

  push();
  var x;
  var y;
  var r;

  beginShape();
  for (var i = 0; i < nPoints; i++) {
    var t = map(i, 0, nPoints, 0, TWO_PI);// sweep theta from 0 to two pi
    r = a * p  * cos(n * t);

// pasted from hypercycloid
    x = r * cos(t);
    y = r * sin(t);
    vertex(x, y);
  }
  endShape(CLOSE);
  pop();

}

Project 07: Hallucinogenic Roses!

sketchDownload
// Ilia Urgen
// Section B
// iurgen@andrew.cmu.edu
// Project-07

function setup() {
  createCanvas(480, 480);
}
 
function draw() {

    color_1 = color (189,17,89);
    color_2 = color (253,163,26);

    // ombre 
    for (var y = 0; y < height; y++ ) {
        n = map (y,0, height, 0, 1);
        var color_3 = lerpColor (color_1, color_2, n);
        stroke (color_3);
        line (0, y, width, y);
    }

    noFill();
    stroke (0);
    strokeWeight (0.25);

    // canvas border lines
    line (1,1,1,width - 1);
    line (1,1,width - 1,1);
    line (1,width - 1,width - 1,width - 1);
    line (width - 1,1,width - 1,width - 1);
  
    // smallest possible x-value of drawing
    var x = min (mouseX, width);
  
    // link the curve scale to mouseX
    var a0 = map (x, 0, width, 0, 50);
    var b0 = map (mouseX, 0, width, 0, 100);

    var a1 = map (x, 0, width, 0, 200);
    var b1 = map (mouseX, 0, width, 0, 300);

    var a2 = map (x, 0, width, 0, 400);
    var b2 = map (mouseX, 0, width, 0, 800);

    var a3 = map (x, 0, width, 0, 900);
    var b3 = map (mouseX, 0, width, 0, 1800);

    var a4 = map (x, 0, width, 0, 1900);
    var b4 = map (mouseX, 0, width, 0, 3800);

    var a5 = map (x, 0, width, 0, 3900);
    var b5 = map (mouseX, 0, width, 0, 7800);

    var a6 = map (x, 0, width, 0, 7900);
    var b6 = map (mouseX, 0, width, 0, 15800);

    var a7 = map (x, 0, width, 0, 15900);
    var b7 = map (mouseX, 0, width, 0, 31800);
  
    // link the curve rotation to mouseY
    var degree = map (mouseY, 0, height, 0, 360);
  
    push();
    translate (width/2, height/2);
  
    for (var j = 0; j < degree; j += 3600 / degree) {
        
        rotate (720 / degree);
        beginShape();
        curveVertex (0, 0);
        
        // draw the complete curves 
        for (var i = -10; i < 10; i += 0.3) {
            var x0 = a0 * cos (i);
            var y0 = b0 * sin (i);
            curveVertex (x0, y0);
        }

        for (var i = -10; i < 10; i += 0.3) {
            var x1 = a1 * cos (i);
            var y1 = b1 * sin (i);
            curveVertex (x1, y1);
        }

        for (var i = -10; i < 10; i += 0.3) {
            var x2 = a2 * cos (i);
            var y2 = b2 * sin (i);
            curveVertex (x2, y2);
        }

        for (var i = -10; i < 10; i += 0.3) {
            var x3 = a3 * cos (i);
            var y3 = b3 * sin (i);
            curveVertex (x3, y3);
        }

        for (var i = -10; i < 10; i += 0.3) {
            var x4 = a4 * cos (i);
            var y4 = b4 * sin (i);
            curveVertex (x4, y4);
        } 

        for (var i = -10; i < 10; i += 0.3) {
            var x5 = a5 * cos (i);
            var y5 = b5 * sin (i);
            curveVertex (x5, y5);
        }

        for (var i = -10; i < 10; i += 0.3) {
            var x6 = a6 * cos (i);
            var y6 = b6 * sin (i);
            curveVertex (x6, y6);
        }

        for (var i = -10; i < 10; i += 0.3) {
            var x7 = a7 * cos (i);
            var y7 = b7 * sin (i);
            curveVertex (x7, y7);
        }
        
        curveVertex (0, 0);
        endShape();

    }

    pop();
    
    // consistent background lines
    line (0, 0, width, height);
    line (0, width, height, 0);

    line (width/2, 0, width/2, height);
    line (0, height/2, width, height/2)

}

Project-07-Curves

A modified hypotrochoid on top of a modified epitrochoid! I reversed x and y in the second vertex function to create the double layered effect.

sketch
// Zoe Lin (ID: youlin)
// Section B

var nPoints = 80;
var angle;
var x, y, theta;
var r, g, b;

function setup() {
  createCanvas(480, 480);
}

function draw() {
  r = map(mouseX, 0, width, 0, 20); //draws bg color based on mouse pos
  g = map(mouseY, 0, height, 0, 20);
  b = map(mouseX, 0, height, 0, 20);
  background(r, g, b);
  noFill();
  stroke(130);
  translate(width/2, height/2);
  moddedeEpitrochoid(); //draws first geometry at center
  rotate(HALF_PI); //draws second at an angle
  moddedeEpitrochoid();
  hypotrochoid(); 
  rotate(PI / 3); //repeat at third angle
  moddedeEpitrochoid();
  hypotrochoid();

function moddedeEpitrochoid() {
    var a = 85; //angle
    var h = constrain(mouseY / 10, 0, 100); //limits geometry size
    var mouse = mouseX / 70;
    
    beginShape();
    for (var i = 0; i < nPoints; i++) {
        theta = map(i, 0, nPoints, 0, TWO_PI);
        //modified formula for epitrochoid
        x = (a+a/2) * sin(theta) - cos(mouse + theta * (a + a/2) / a/2) * h;
        y = (a+a/2) * cos(theta) - sin(mouse + theta * (a + a/2) / a/2) * h;
        vertex(x, y);
        vertex(y, x); //layers vertexes, draws 2d geometry
    }
    endShape();
 }
  strokeWeight(0.25);
}

function hypotrochoid() { 
    var h = constrain(mouseX / 100, 205, height); //contrains geometry size
    var a = map(mouseX, 0, width, 25, 15); //maps mouse pos to desired angle
    var b = map(mouseY, 0, height, 0, 15);
    beginShape();
      for (var i = 0; i < nPoints-15; i ++) {
        var theta2 = map(i, 0, width/2, 0, 50);
        //hypotrochoid formula
        x = (a - b) * cos(theta2) + h * sin((a - b) * theta2);
        y = (a - b) * sin(theta2) - h * cos((a - b) * theta2);
        vertex(x, y);
      }
    endShape();
}