![[OLD SEMESTER] 15-104 • Introduction to Computing for Creative Practice](https://courses.ideate.cmu.edu/15-104/f2022/wp-content/uploads/2023/09/stop-banner.png)
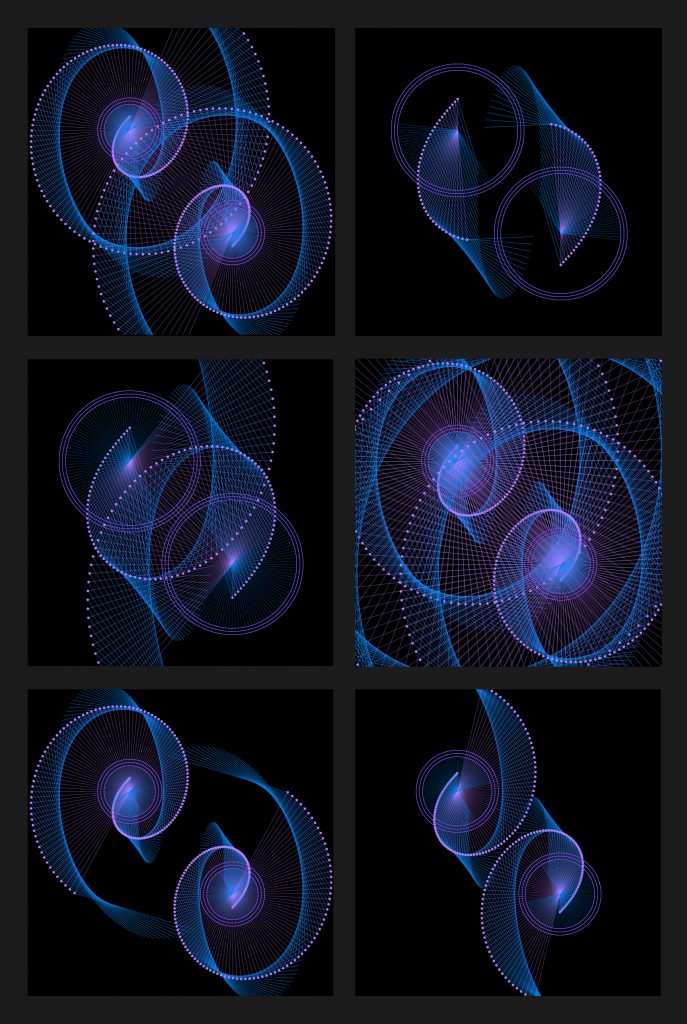
this is my project.
sketch
var nPoints = 400;
function setup() {
createCanvas(400, 400);
}
function draw() {
background(0);
// draw the curve
push();
translate(width/2, height/2);
drawEpitrochoidCurve();
pop();
push();
translate(width/2, height/2-20)
drawCardioidCurve();
pop();
}
//--------------------------------------------------
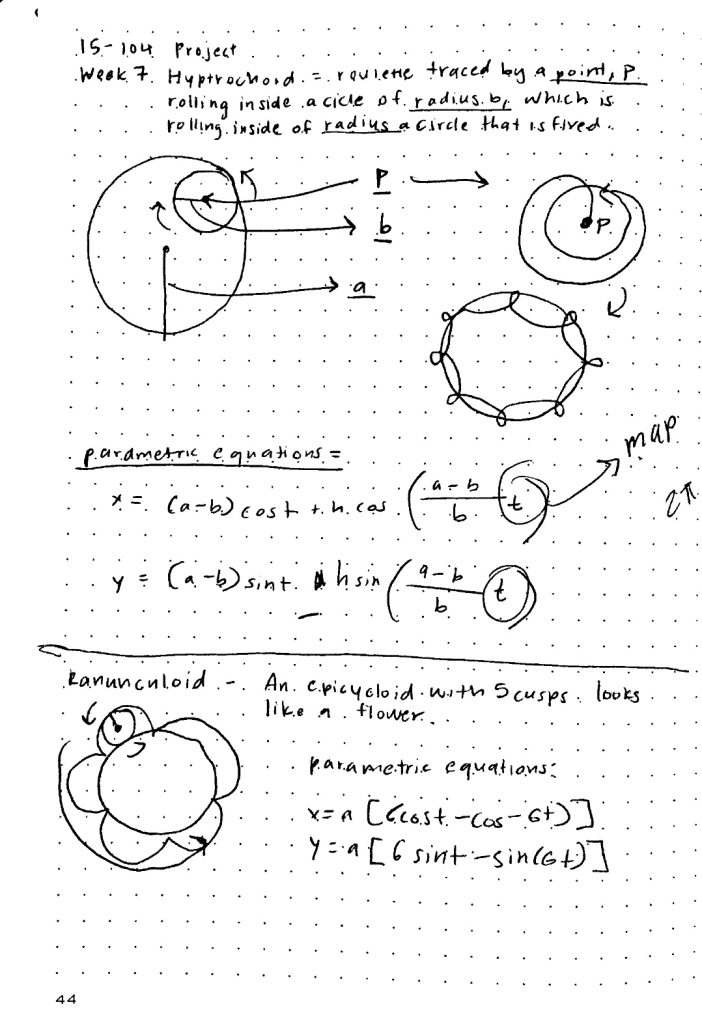
function drawEpitrochoidCurve() {
// Epicycloid:
// http://mathworld.wolfram.com/Epicycloid.html
noFill();
strokeWeight(1);
//change color
if (mouseX< width/2) {
stroke(0, 50, 233);
} else {
stroke(81, 211, 255);
}
var x = constrain(mouseX, 0, width);
var y = constrain(mouseY, 0, height);
var a = map(x, 0, width, 50, 150);
var b = map(y, 0, height, 1, 6);
var h = constrain(mouseY, 50, 90);
//draw Epicycloid
beginShape();
for (var i = 0; i < nPoints; i++) {
var t = map(i, 0, nPoints, 0, TWO_PI);
x = (a + b) * cos(t) - h * cos(t * (a + b) / b);
y = (a + b) * sin(t) - h * sin(t * (a + b) / b);
vertex(x, y);
}
endShape(CLOSE);
}
//--------------------------------------------------
function drawCardioidCurve() {
//Cardioid
// https://mathworld.wolfram.com/Cardioid.html
push();
translate(x, y);
rotate(radians(-90))
var x = constrain(mouseX, 0, width);
var y = constrain(mouseY, 0, height);
var a = map(x, 0, width, 20, 80);
var b = a/2;
//change color
if (mouseY > height/2) {
fill(233, 50, 50, 200);
} else {
fill(169, 22, 22, 200);
}
//draw cardioid
strokeWeight(1)
stroke(244, 82, 255);
beginShape();
for (var i = 0; i < nPoints; i++) {
var t = map(i, 0, nPoints, 0, TWO_PI);
x = a*cos(t)*(1-cos(t));
y = a*sin(t)*(1-cos(t));
vertex(x, y);
}
endShape(CLOSE);
pop();
}