Project – 11 – Landscape

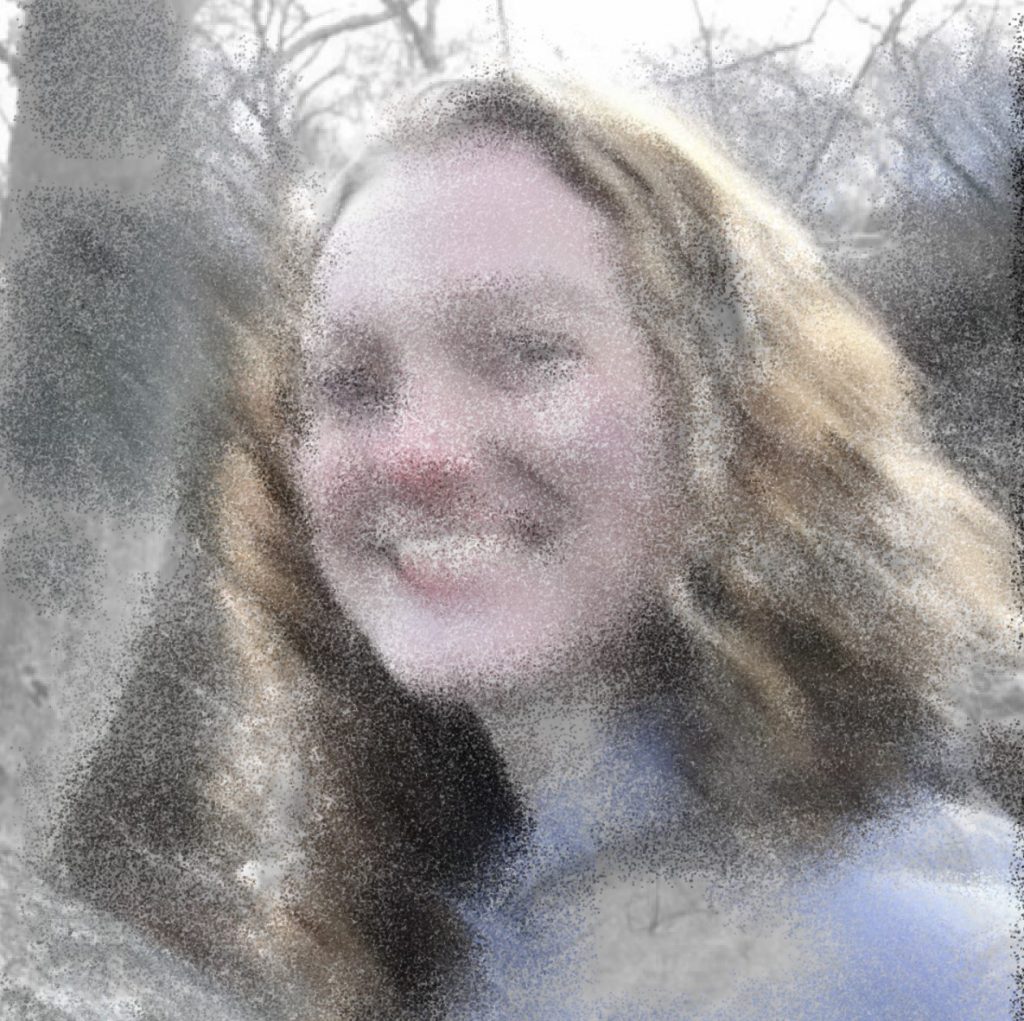
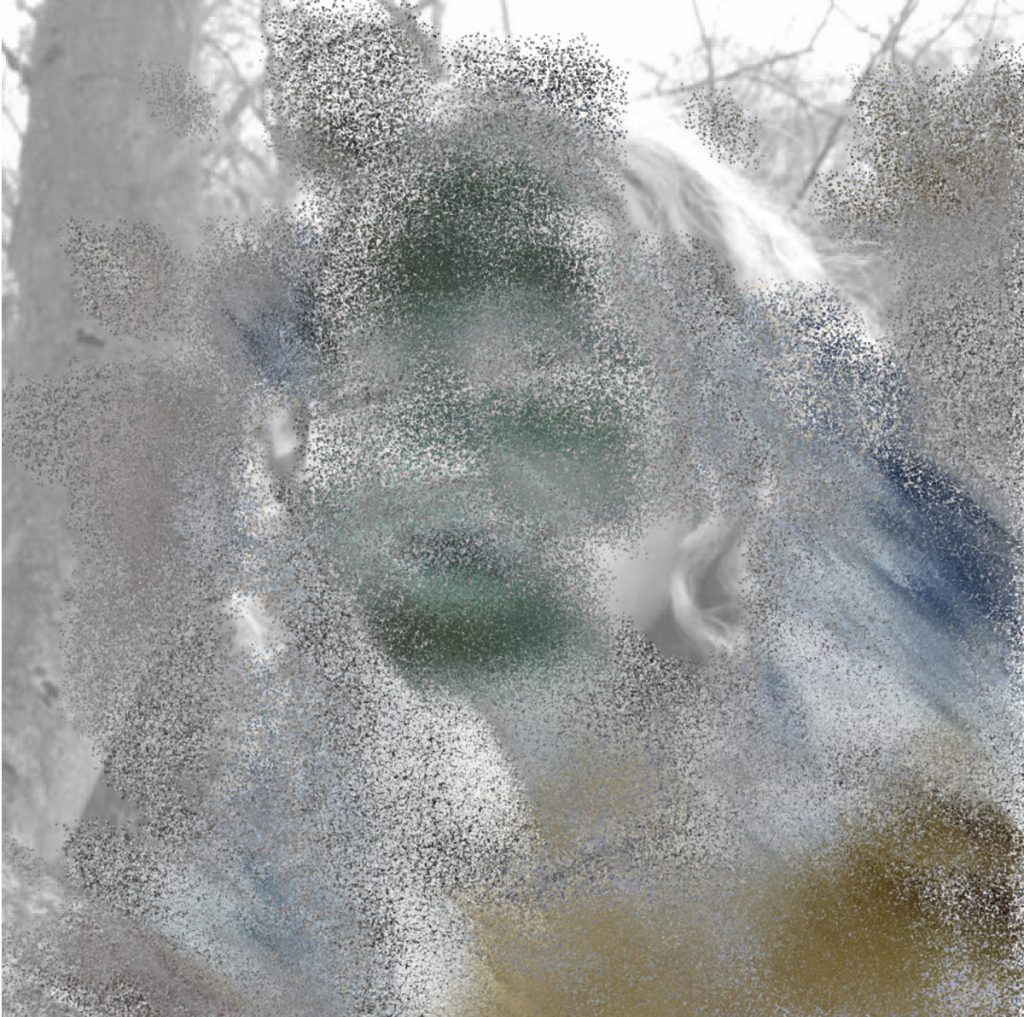
In this animation, I wanted to create a simple and playful but mysterious atmosphere. I choose to make it only with shades of purple and set the scene in the woods during a full moon.

sketch
// Emily Franco
// efranco
// Section C
// Project 11 


//CHANGING FEATURES
//verticle coordinates 
var hill = [];
var noiseParam = 0; 
//hill frequency
var noiseStep = 0.02; 

var tree;
var forest = []; 
var sky = [];

//state of person walking
var state = 0;

function moon(){
    var oMoon = 30;
    var dim = 100;
    noStroke();
    fill(252,250,252,230);
    circle(300,90,dim);
    //halo
    for(var i=0; i<3; i++){
        oMoon -= 5*i;
        dim +=30;
        fill(252,250,252,oMoon);
        circle(300,90,dim);
    }
}

//constructor for stars
function makeStar(){
    var star = {x:random(width),y:random(height),size:random(0.25,2), 
                opacity:random(100,255),
                drawFunction: drawStar};
    return star;
}

function drawStar(){
    stroke(252,250,252,this.opacity);
    strokeWeight(this.size);
    point(this.x,this.y);
}

function stepTree(){
    this.x++;
}

function drawTree(){
    noStroke();
    var side;
    var triangleY;
    var branchLen;
    
    fill(this.color);
    rect(this.x,0,this.w,height);
    //branches
    switch(this.side){
        case 0:
        triangle(this.x,this.triangleY,this.x-this.branchLen,this.triangleY-6,this.x,this.triangleY+10);
        break;
        case 1: 
        triangle(this.x+this.w,this.triangleY,this.x+this.w+this.branchLen,this.triangleY-6,this.x+this.w,this.triangleY+10);
        break;
    }  
}

//tree constructor
function makeTrees(tx,tw,treeColor){
    var tree = {x: tx, w:tw, color:treeColor, side:floor(random(2)), 
                triangleY:random(height-100), branchLen:random(10,55),
                drawFunction:drawTree, stepFunction: stepTree};

    return tree;
}

//center if person is center of face circle
function person(x, y,state){
    //LEGS
    //state 1
    if(state==0){
        strokeWeight(2);
        stroke(248,232,212);
        line(x-6,y+58,x-8,y+68);
        line(x+4,y+58,x+4,y+68);
        stroke(0);
        line(x-8,y+68,x-9,y+81);
        line(x+4,y+68,x+7,y+81);
        //shadow
        noStroke();
        fill(0,0,0,90);
        rect(x-10,y+81,30,5);
    }
    //state 2
    if(state==1){
        strokeWeight(2);
        stroke(248,232,212);
        line(x-3,y+58,x-8,y+67);
        line(x+5,y+58,x+6,y+68);
        stroke(0);
        line(x-8,y+67,x-6,y+81);
        line(x+6,y+68,x+9,y+81);
        //shadow
        noStroke();
        fill(0,0,0,90);
        rect(x-12,y+81,35,5);
    }
    //state 3
    if(state==2){
        strokeWeight(2);
        stroke(248,232,212);
        line(x-3,y+58,x-6,y+69);
        line(x,y+58,x,y+68);
        stroke(0);
        line(x-6,y+69,x+3,y+81);
        line(x,y+68,x,y+81);
        //shadow
        noStroke();
        fill(0,0,0,90);
        rect(x-5,y+81,15,5);
    }
    noStroke();
    //BODY
    //hair in back
    fill(43,28,28);
    rect(x-10,y,17.5,29.8);

    //head
    fill(248,232,212);
    circle(x,y,20);
    //neck
    rect(x-1,y+10,2,5);
    //hair
    fill(56,38,33);
    arc(x,y,20,20,radians(180),radians(0),CHORD);
    rect(x+4.6,y,5.4,29.9);
    //eye
    ellipse(x-6,y+2,1,2);
    //dress
    fill(33,30,45);
    beginShape();
    vertex(x-6.5,y+15);
    vertex(x-15,y+59);
    vertex(x+15,y+59);
    vertex(x+6.5,y+15);
    endShape(CLOSE);
}

function moveHill(){
    //hill.shift();

    //add new coordinate to hill arry
    n = noise(noiseParam); 
    val = map(n,0,1,height-100,height);
    hill.pop();
    hill.unshift(val);
    noiseParam = noiseParam + noiseStep;

}
function defineHill(){
    var n;
    var val;
    for(var i=0; i<(width/5)+1; i++){
        n = noise(noiseParam);
        //map noise output to height of canvas
        val = map(n,0,1,height-100,height);
        hill.unshift(val);
        //increment to change curve
        noiseParam = noiseParam + noiseStep;
    }
}

function setup(){
    createCanvas(400, 400);
    frameRate(5);

    //STARS 
    for(var i=0; i<200; i++){
        sky[i] = makeStar();
    }

    //TREES
    for(var i=0; i<=18;i++){
          //furthest back
        if(i<=4){
            c = color(50,36,81);
        }
        //middle
        if(i>4 & i<=10){
            c = color(35,29,71);
        }
        if(i>10){
            c = color(25,18,66);
        }
        //front
        tree = makeTrees(random(width),random(5,15),c);
        forest.push(tree);
    }

    //HILL
    defineHill();
    
}

function draw(){
    background(69,55,89);
    var drawSetBack = floor(random(30));
    //------BACKGROUND--------
    moon();
    for(var i=0; i<sky.length-1; i++){
        //make stars twinkle
        if(i%5==0){
            sky[i].size = random(0.25,3.5);
        }
        var str = sky[i];
        str.drawFunction();
    }
    //back hills
    fill(49, 34, 66);
    noStroke();
    beginShape();
    curveVertex(400,235);
    curveVertex(400,235);
    curveVertex(316,283);
    curveVertex(232,285);
    curveVertex(194,400);
    curveVertex(400,400);
    endShape(CLOSE);

    fill(62, 47, 79);
    noStroke();
    beginShape();
    curveVertex(0,245);
    curveVertex(0,245);
    curveVertex(35,204);
    curveVertex(87,273);
    curveVertex(192,258);
    curveVertex(272,320);
    curveVertex(400,400);
    curveVertex(0,400);
    endShape(CLOSE);

    //------MIDGROUND--------
    //find index of most right tree
    var currentX=0; 
    var xHigh=0;

    for(var i=0; i<=forest.length-1;i++){
        currentX = forest[i].x;
        if(currentX>xHigh){
            xHigh=currentX;
            furthestTree = i;
        }
    }

    //move last tree to start of canvas
    if(forest[furthestTree].x > width){
        forest[furthestTree].x = 0-forest[furthestTree].w;
    }

    for(var i=0; i<=forest.length-1;i++){
        var t = forest[i];
        t.drawFunction();
        t.stepFunction();
    }

    //------FOREGROUND--------
    //draw hill
    for(var i=0; i<(width/5);i++){
        fill(125, 104, 135);
        beginShape();
        vertex(i*5,hill[i]);
        vertex(i*5,height);
        vertex((i+1)*5,height);
        vertex((i+1)*5,hill[i+1]);
        endShape(CLOSE);
    }
    moveHill();

    //move person according to hill value
    person(260,hill[53]-79,state%3);
    state++;
}

LookingOutwards 11

In her article, Sohpie Davies sheds light on the increase of the “digital divide” during COVID-19 through two paintings; one of a woman reading an iPad and another of children dreaming of computers. The “digital gap” is the gap in accessibility to computers and the internet. Davies explains that during the pandemic when the use of the internet increased worldwide due to quarantine but only in the more-developed countries. While the internet allowed many people to sustain incomes and keep socially connected, it also needs to be said that computers and the internet can be as inclusive as they are exclusive. People who cannot access these technologies are quickly left behind, especially during COVID-19 when so much of the world went online for economic and social value. These people are minorities, often poor, and often in the least-developed countries. One such group is women. Worldwide, women are less likely to have and connect to technology because of gender inequality, and thus, in the workplace, which is swiftly becoming dominated by the internet, women are left with jobs of lesser value as they never learned skills to manage technology. The second painting Davis brings up explains how children during the pandemic were academically left behind because they could not afford the technology that would allow them to learn remotes. Both of these groups, due to discrimination or economic disadvantage are left behind in a world that is quickly moving past them. 

“Spanish art show spotlights ‘hidden’ digital divide in pandemic” by Sophie Davies

Vase depicting children dreaming of computers.

Project 09 – Portrait

With this project, I mainly wanted to create different color modes from the pixels. The background is black and white, the 1st set of selected pixels are the original colors, and when clicked the pixels become inverted.

sketch
// Emily Franco
// Section C
// efranco@andrew.cmu.edu
// Assignment-09

var sqr = [];
var sqrArrayLen = 150;

//true = original colors false = inverted
var colorStyle = true;

var count = 0; 
function preload(){
    face = loadImage("https://i.imgur.com/bu90lcN.jpg");
}

//constructor for square objects
function makeSquare(cx, cy, wdth){
    var c = {x:cx, y:cy, w:wdth}
    return c;
}

function setup(){
    createCanvas(480,480); 
    background("white");
    
    face.loadPixels(); 
    face.resize(480,600);
    greyscale(); 

    //define objects in sqr array 
	for(var i=0;i<=sqrArrayLen-1;i++){
	    var side1 = random(10,100);
	    var x = random(width);
	    var y = random(height);

	    var square = makeSquare(x,y,side1);
        sqr.push(square);
     }    
}

function draw() {   
    noFill();
    stroke("white");

    //draw 1st image only once
    if(count<=0){
    	drawAlterations()
    }
	
    count++;
	noLoop();
}

//draw changed made to image
function drawAlterations(){
	var opacity;
	var shift; 
	var c; 
	for(var i=0; i<=sqr.length-1;i++){
		noStroke();
		if(colorStyle){
			showColor(i);
		}else{
			invertColors(i);
		}
		print(colorStyle);
		
	}
}
//make image greyscale
function greyscale(){ 
	for (var i=0;i<=face.width;i++){
		for(var j=0;j<=face.height;j++){
			c = face.get(i,j);
			var grey = c[0]; 
			push();
			noStroke();
			fill(grey,150);
			square(i,j,1);
			pop();
		}
	} 
}

//change pixel color back to original only in boxed area
function showColor(index){
	var maxX = sqr[index].x + sqr[index].w;
	var maxY = sqr[index].y + sqr[index].w;

	for (var i=sqr[index].x;i<=maxX;i++){
		for(var j=sqr[index].y;j<=maxY;j++){
			c = face.get(i,j);
			opacity = random(50,150); 
			shift = random(-10,10);

			fill(c[0],c[1],c[2],opacity);
			square(i+shift,j+shift,1); 
		}
	} 
}

function invertColors(index){
	var maxX = sqr[index].x + sqr[index].w;
	var maxY = sqr[index].y + sqr[index].w;

	for (var i=sqr[index].x;i<=maxX;i++){
		for(var j=sqr[index].y;j<=maxY;j++){
			c = face.get(i,j);
			
			var r = 255-c[0];
			var g = 255-c[1];
			var b = 255-c[2];

			opacity = random(50,150);
			shift = random(-10,10);

			fill(r,g,b,opacity);
			square(i+shift,j+shift,1); 
		}
	} 
}
function mousePressed(){
	colorStyle = !colorStyle;
	drawAlterations();
}

LookingOutwards – 09

Heather Kelly, who also goes by Perfect Plum, is an indie game designer who currently works as an associate teaching professor at Carnegie Mellon University. She is a feminist and social justice advocate that aims to make video games and coding more accessible to everyone. Many of her programs focus on multi-sensory interactions or alternative methods of gameplay, such as her satiric, indie game “Guilty Smells”, in which the player takes the perspective of a police dog whose job it is to sniff out foreign food that is now outlawed in the USA. This game is connected to a console that emits smells relevant to the game in order for the player to determine if it’s American food or not. Kelly also designed “LikeLike”, a free website for independent game designers and artists to post their work without the hindrance of commodification. 

Gameplay of Guilts Smells
Guilt Smells Console

LoookingOutwards-08

Alexander Chen works at Google Creative Lab exploring his interest in visualizing and augmenting audio and music from human interaction. His goal is to not only discover different ways music works but to also create playful programs that question what can make music: in his opinion, anything, from instruments to subways maps.  In his presentation for Eyeo (2017), he displays various projects he created that all create sound differently; some respond to voice input and match it to a song pattern, and another visualized temporal lag in music. The one I found most interesting was one program that, linked to a mini keyboard, would display the colored dots with different transparencies and placements that represented the keys and the intensity of key press or volume. Beyond hearing the music, this program allowed people to see the music almost as a story with notes as strings of characters that interact in a complex dance; as the music gets more complex the characters multiply and move faster but in a pattern clear to those listening. This visualization also helps people hear the music better as they can see which sounds are made of multiple notes and where these notes are placed relative to each other. Another program I found very interesting is called Spectrogram, which is on his website, Chrome Music Lab, (which he designed as a playground of audio). Most programs he places on this website lack labels and encourages children to discover and explore how the audio in each program is manipulated. I think his work allows people of all ages to learn not only how sounds work but to think of it in different, unconventional ways.

Project 07 – Curves

Using a rose curve function I created two overlapping shapes. Moving the cursor to the left side of the canvas decreases the petal count and changes its rotation direction to counterclockwise; to the left, the petal count increases, and the rotation direction is clockwise. Clicking the canvas will pause its motion.

sketch
// Emily Franco
// Section C
// efranco@andrew.cmu.edu
// Project-07
 
//num of petals
var n=3;

//track move clickes
var state = 0;
//tracks when petals function runs
var petalState =0;

//store x and y cordinates of petal
var petalPointX = [];
var petalPointY = [];

function setup() {
    createCanvas(400, 400);
 }

function draw() { 
    background (0);

    //move origin to center canvas
    translate(width/2,height/2);

    //outter rose
    fill(167,1187,232,120);
    rose(n,200,5);

    //inner rose
    fill(252,219,3,120);
    rose(-n,120,3);


    petals();
} 

//only call petals mouse house is clicked    
function mousePressed(){
    if(petalState == 0){
        state = 1;
    }

    if(petalState == 1){
        state = 0;
        petalState = 0;
    }
}

//make rose shape
function rose(n,radius,rate){
    var x; 
    var y;
    var newRad;
    //make rose shape
    beginShape();
    for (var a=0; a<=360; a++){
        newRad = radius*sin(n*radians(a));
        x = newRad*cos(radians(a)); 
        y = newRad*sin(radians(a)); 
        petalPointX[a] = x;
        petalPointY[a] = y;
        vertex (x,y);
    }
    endShape();
    petalLines(rate);
}

//draw lines at determine increments from center to petal coordinate
function petalLines(rate){
    stroke("black");
    for(var i=0; i<=petalPointX.length;i = i+rate){
        line (petalPointX[i],petalPointY[i],0,0);
    }
            
}

//add or subtract petal depending on mouse location
function petals(){
    if(state==1){
        if(mouseX>=width/2){
             n=n+0.01;
        }if(mouseX<width/2){
             n=n-0.01;
        }
        
        petalState=1;
    }   
}


LookingOutwards-07

This program collected various data sets concerning COVID and its transmission. Studio NAND created this software to bring into perspective the true impact of COVID without false information or exaggerations. Using this application people can understand not only how quickly COVID can spread and how it spreads, but they can also see its effects on those who are vaccinated against those who are not. Users also have the option of choosing the vaccination rate to allow them to observe the influences of such a rate in a population.  Overall, I think this software is a great tool that allows people to understand COVID transmission and the importance of vaccination. With so much misinformation involved in this pandemic, along with those who are apathetic, I believe simulations such as this can bring light to how important it is to understand how much of an effect the decisions a single individual can have on the population.

Visualization of Infection and Death Rate

Project 06 – Abstract Clock

This abstract clock uses the number of vertices in the polygon to determine the hour. The minute is represented by verticle dots and seconds are represented by the rotation of the polygon.

sketch
// Emily Franco
// Section C
// efranco@andrew.cmu.edu
// Project-06
 

//twelve hr clock
var h;
var backColor;

function setup() {
    createCanvas(400, 400);

    //convert hour to 12hr cycle
    if (hour()>12){
        h = hour()-12;
    }else if (hour==0){
        h = 12;
    }else {
        h = hour();
    }

    //set background to white if daytime and black for night time
    if(hour()>=5 & hour()<=19){
        backColor = color(215,218,219);
    }else {
        backColor = color("black");
    }

    background (backColor);
 }


function draw() { 
    //draw minutes
    minuteDots();
    //draw hours and seconds
    polyRotate ();
    
} 


//-----HOUR-----
//draw polygon for hour - num of vertices = hour
function polygon(x,y,rad,points){
    noFill();
    strokeWeight(0.5);
    var newX = 0;
    var newY = 0;

    //find angle increments
    var angle = 360/points;

    //if hour is 0 than shape is an ellipse
    if(h==0){
        ellipse(0,0,rad*2,rad);
    }else {
        //if house is more than 1, shape has same num of vertices
        beginShape();
        for(var i=0; i<360; i+=angle){
            newX = x + rad * cos(radians(i));
            newY = y + rad * sin(radians(i));
            vertex (newX, newY);
        }
        endShape(CLOSE);
    }
}


//-----SECOND-----
//draw rotating shape - each shape is a second
function polyRotate (){
    push();
    translate (width/2, height/2);
    var angleIncrement = 6; 

    //map to 180 not 360 since shape has 2 sides
    var secMap = map(second(),0,60,0,360);
    for(var a=0; a<=secMap; a=a+angleIncrement){
        //marking poly - light blue
        //drawing "delay"
        if(a>0){
            push();
            rotate(radians(a-angleIncrement));
            stroke(12,222,245);
            polygon(0,0,100,h);
            pop(); 
        }

        //tracking poly - magenta
        push();
        rotate(radians(a));
        strokeWeight(1);
        stroke(255,13,223);
        polygon(0,0,100,h); 
        pop();
    }
    pop();
    //restart seconds
    if(second()==59){
        background(backColor);
    }
}


//-----MINUTE-----
//draw dot in line for every minute
function minuteDots(){
    push();
    translate (width/2, 0);

    //map minutes to height of minutes bar
    var minuteHeights = map(minute(),0,60,20,height-20);

    //draw dots
    for (var d=20; d<=minuteHeights; d= d +height/60){
        strokeWeight(4);

        //marking poly - yellow
        //drawing "delay"
        if(d>20){
            stroke(237,204,14);
            point(0,d-height/60); 
        }
        
        //tracking poly - magenta
        stroke(255,13,223);
        point(0,d); 
        
    }
    pop();

    //restart minutes
    if(minute()>=60){
        background(backColor);
    }
}

LookingOutwards – 06

Wilke is a biologist who became interested in abstracting representing his studies using t-distributed stochastic neighbor embedding (T-SNE) that allows his data to become 2D and 3D artworks. Wilke’s artwork, Eternal Connection (2022), uses randomness to generate forms that are all different, yet follow parameters of his code that allow them to appear similar enough to one another to be recognized as the same type of project. This collection, like many of his previous, is used as a learning opportunity to explore and expand his computational abilities; for this reason, his works are informal and playful compared to the strictness of his data collection. Most of his works, like this one use circles, dots, and spheres to generate images. 

Series 1

Project-05-Wallpaper

sketch
// Emily Franco
// Section C
// efranco@andrew.cmu.edu
// Project-05
 

var colorState; 

function setup() {
    createCanvas(500, 500);
    background (255,248,228);
}

function draw() { 
	var dim = 70;
	var rad = dim/2;
	colorState = 0; 

	for (var x=rad;x<=width-rad;x+=dim*2){
		for (var y=rad;y<=height-rad;y+=dim){
			cirColorOne(colorState);
			drawPiece(x,y,dim,rad);
		}
	}
	

	for (var x=dim+rad;x<=width-rad;x+=dim*2){
		for (var y=rad;y<=height-rad;y+=dim){
			cirColorTwo(colorState);
			drawPiece(x,y,dim,rad);
		}
	}


	noLoop();
} 

function drawPiece (x,y,dim,rad){
	var angleX;
	var angleY;

	//move origin
	translate (x,y);

	push();
	//random rotation angle from array
	randRot();

	push();
	noStroke();
	//draw semi circle
	arc(0,0,dim,dim,radians(90), radians(270),CHORD);
	pop(); 

	//draw lines in piece 
	for(var polarPos=85;polarPos>=10;polarPos-=5){
		angleX = rad*cos(radians(polarPos));
		angleY = rad*sin(radians(polarPos));

		strokeWeight(0.25);
		line(angleX,-angleY,angleX,angleY);

		//increase gap between lines so they dont blur together
		if(polarPos<=30){
			polarPos -=2;
		}
	}

	pop();

	//reset origin
    translate(-x,-y);
}

function randRot(){
	//rotate piece at one of 4 angles
	var rotateAngles = [0,90,180,270];

	//selec rand int
	var rotAngle = floor(random(0,4));
	rotate (radians(rotateAngles[rotAngle])); 
}

function cirColorOne(state){
	if(state==0){
		//yellow
		fill(255,206,109);
	}else if(state==1){
		//black
		fill(49,49,49);
		colorState = -1;
	}
	colorState+=1;
}

function cirColorTwo(state){
	if(state==0){
		//orange
		fill(255,105,33); 
	}else if(state==1){
		//blue
		fill(125,173,198); 
		colorState = -1;
	}
	colorState+=1;
}