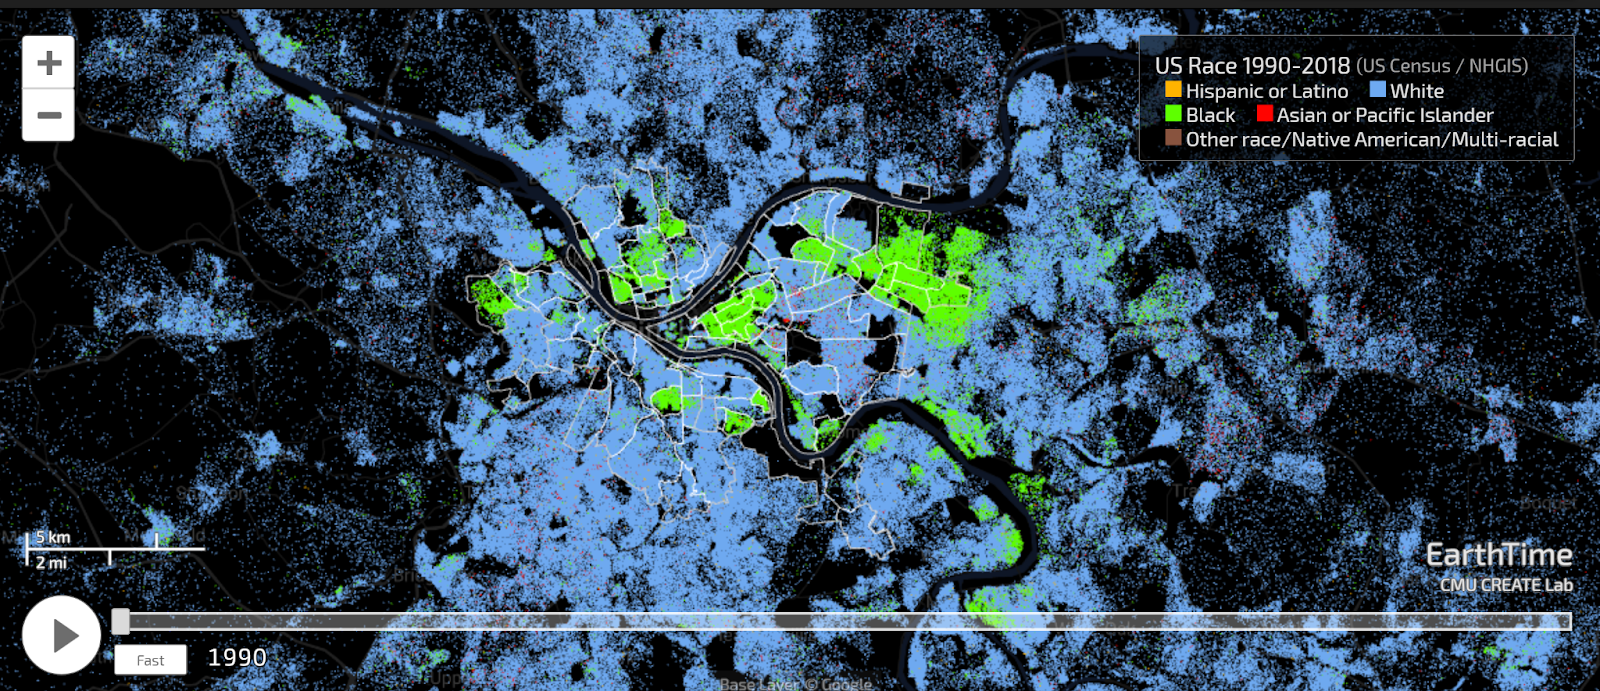
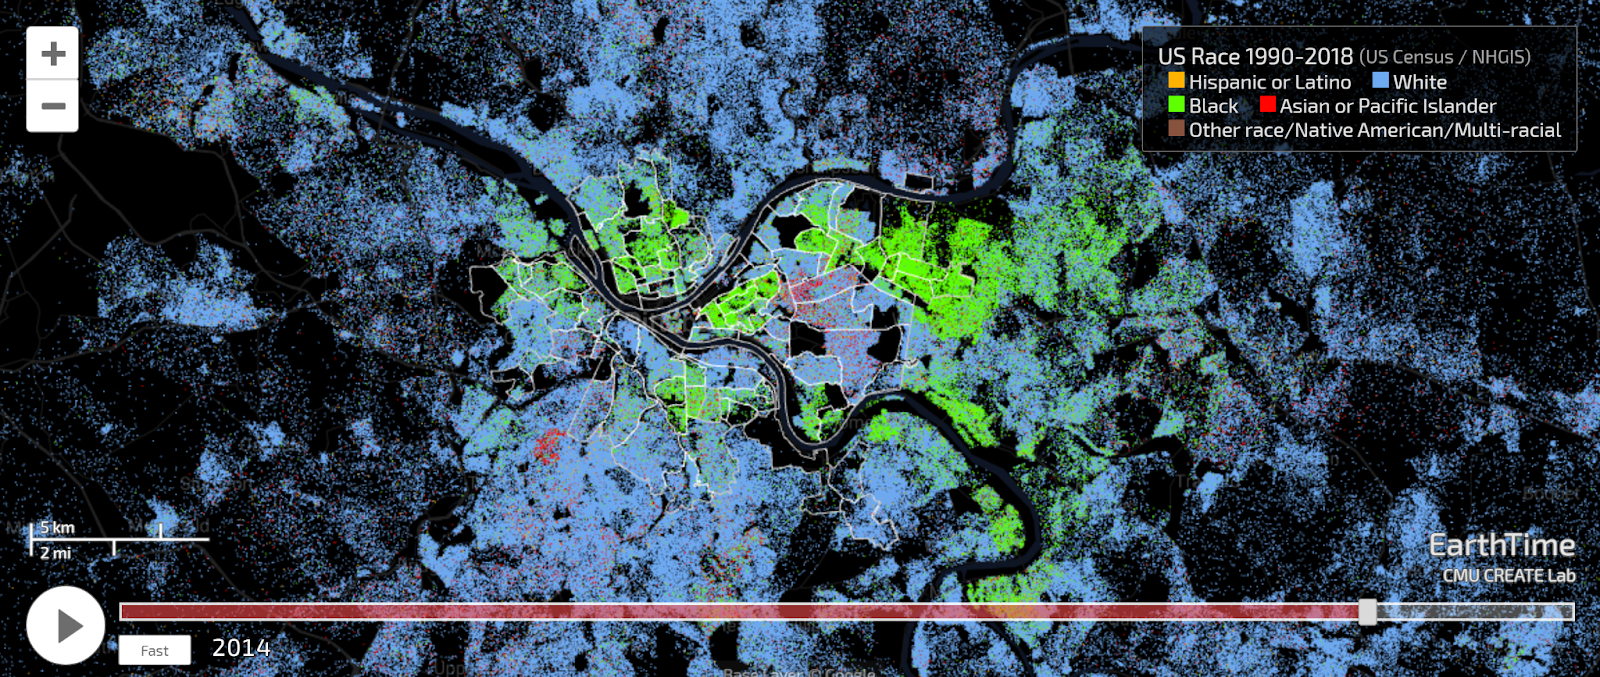
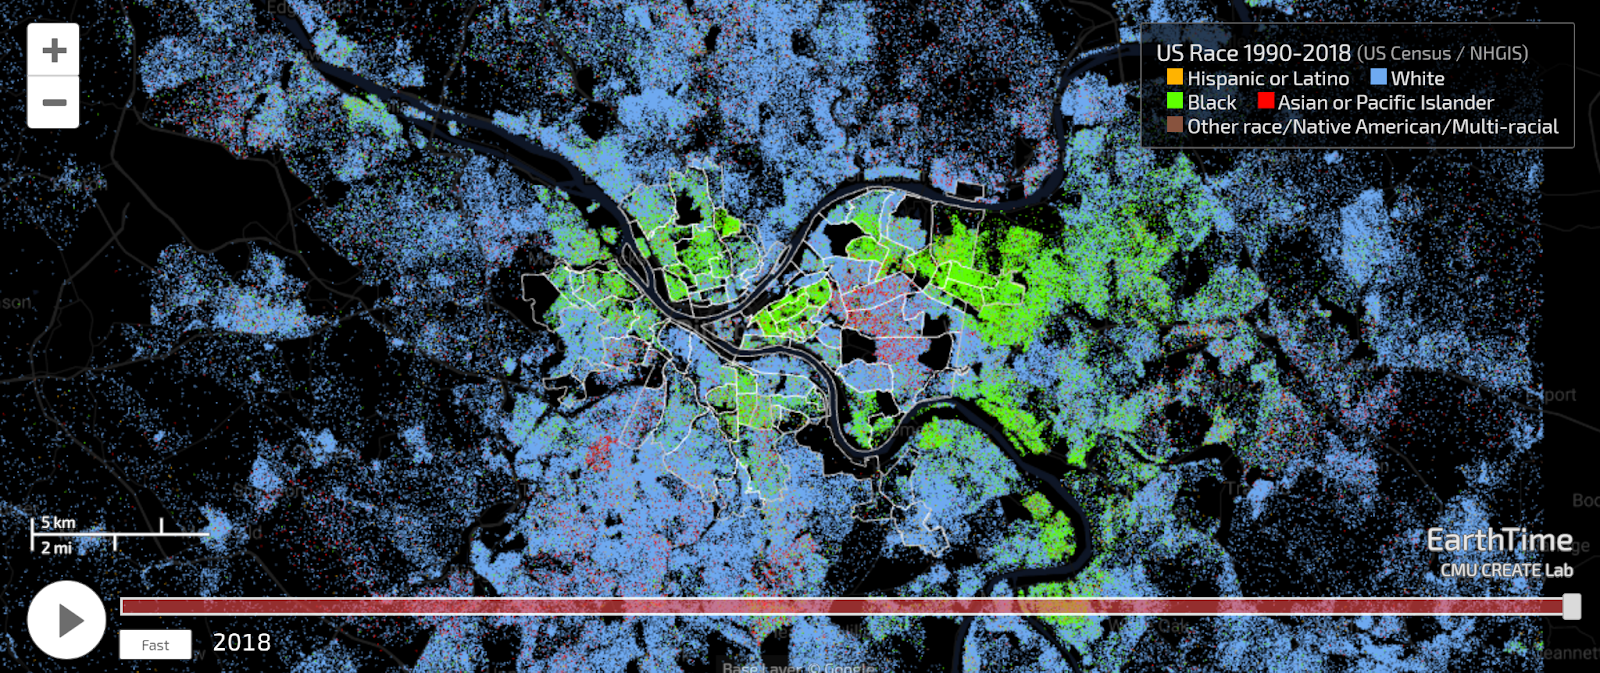
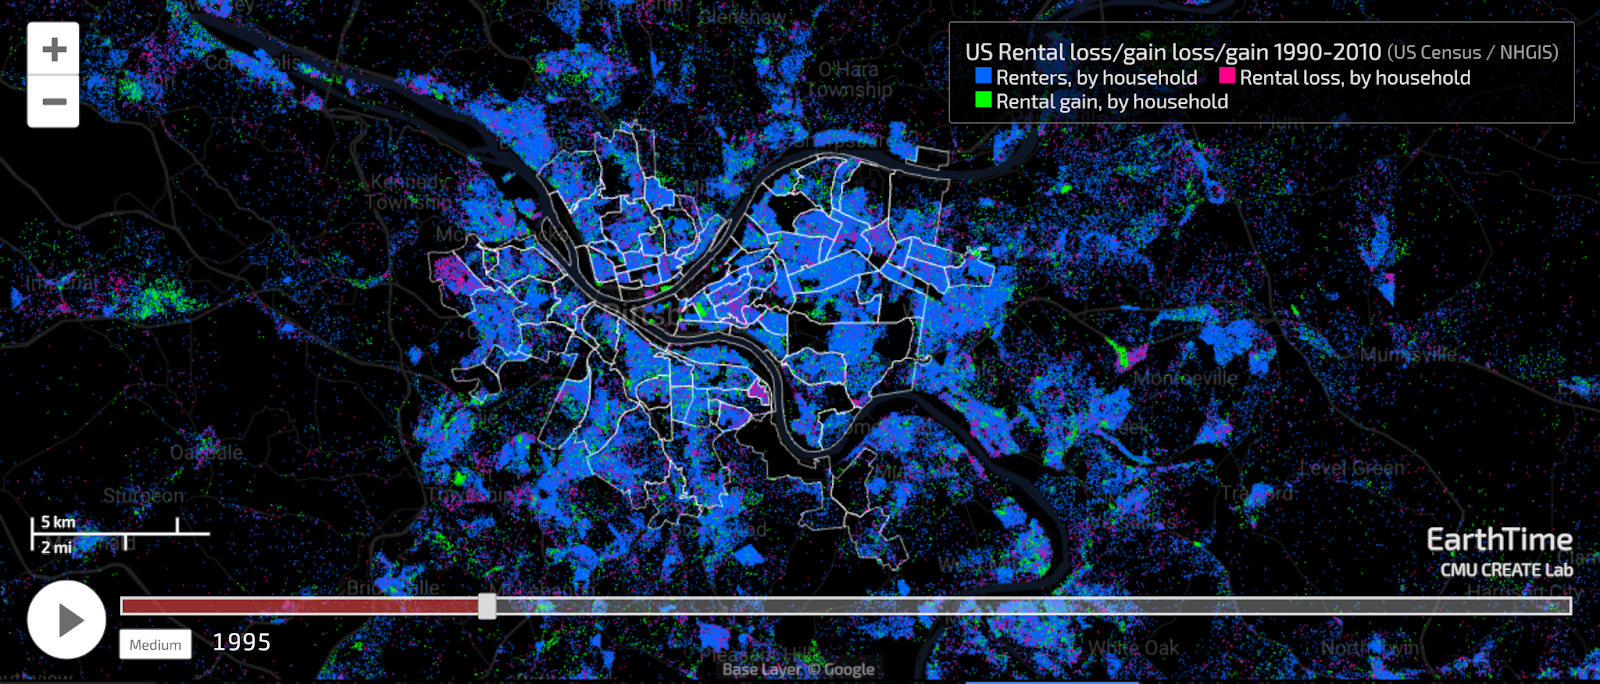
Core Concept
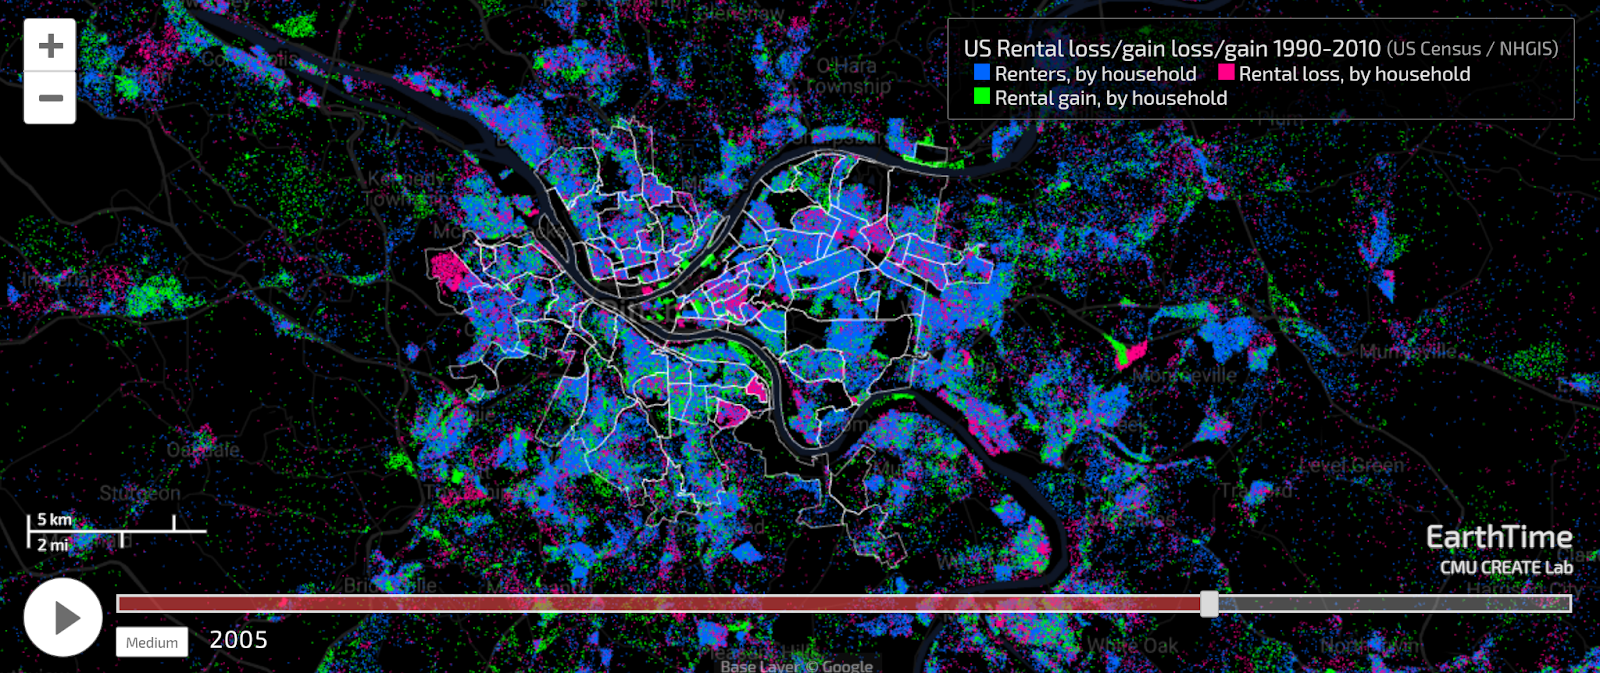
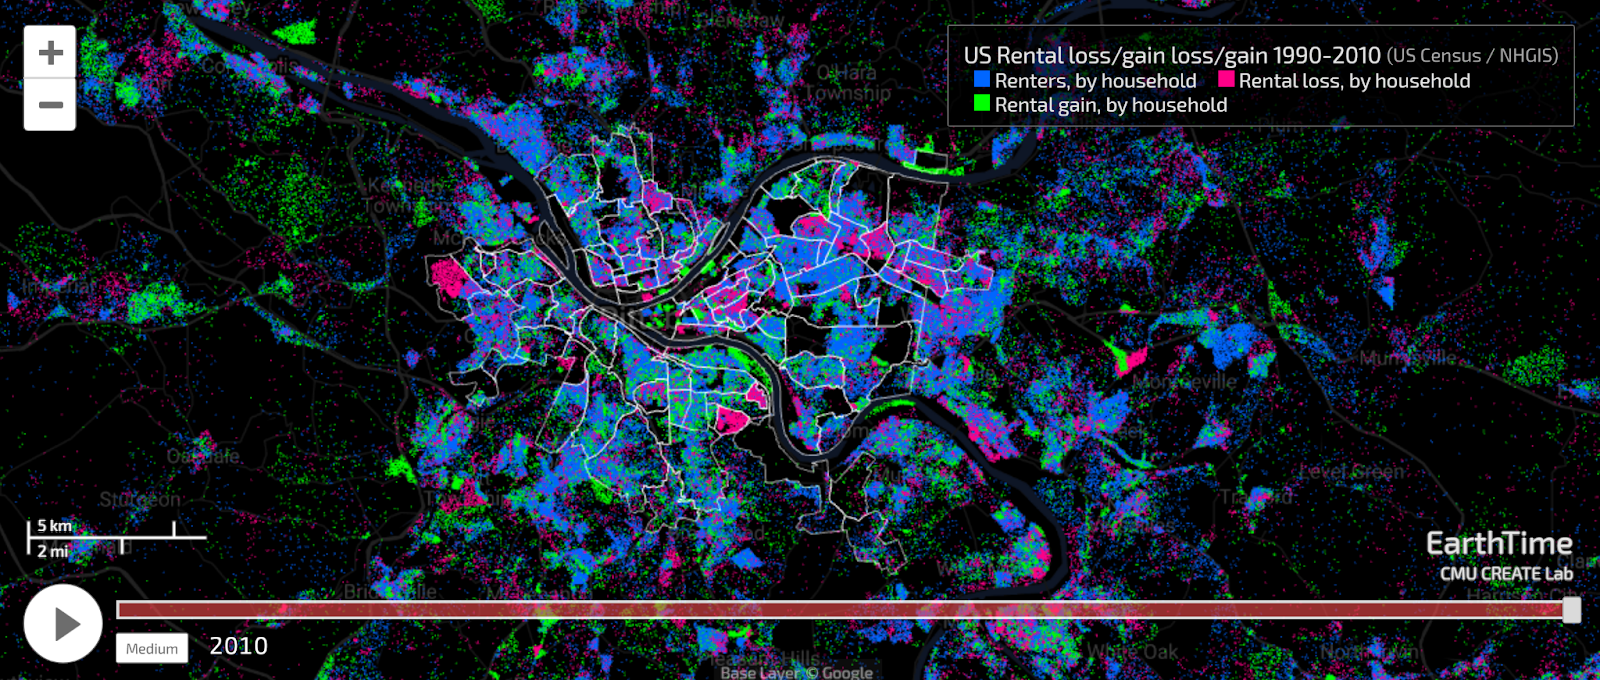
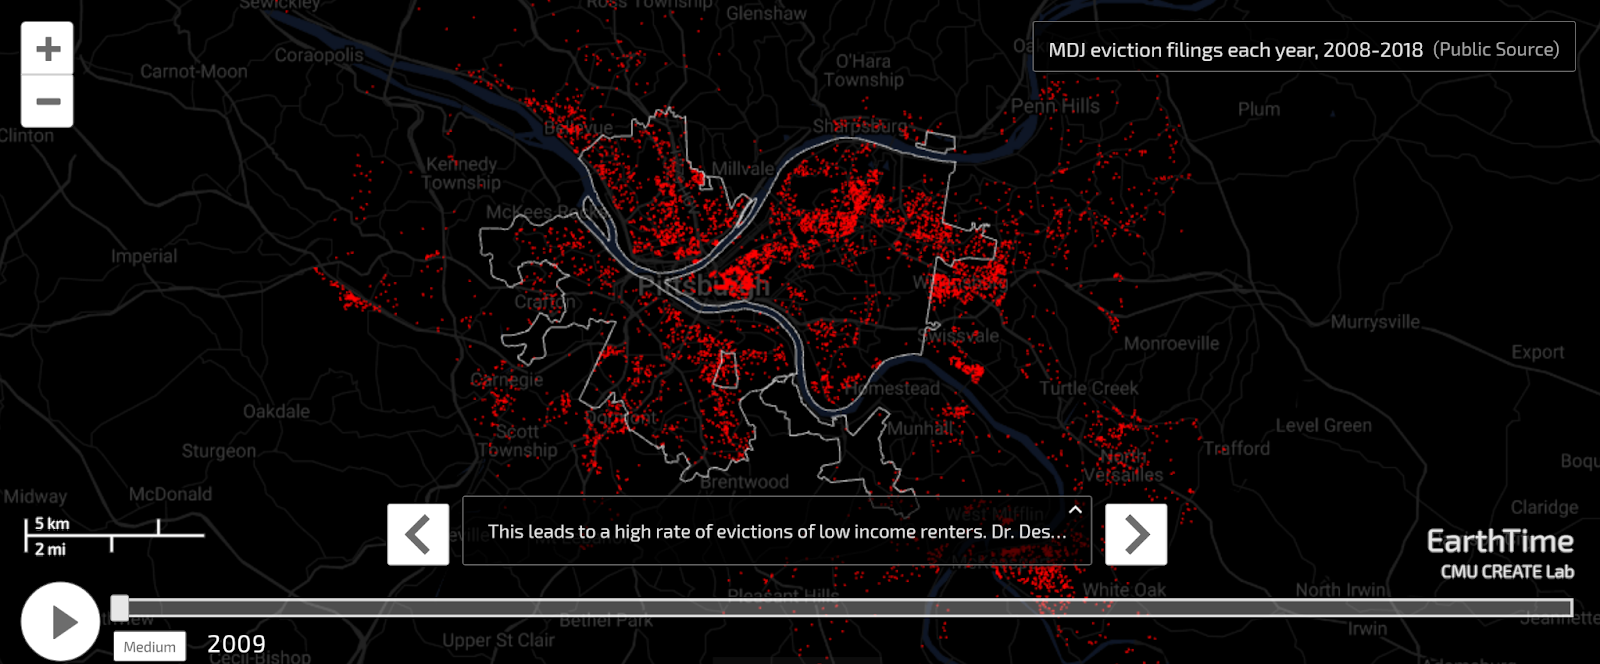
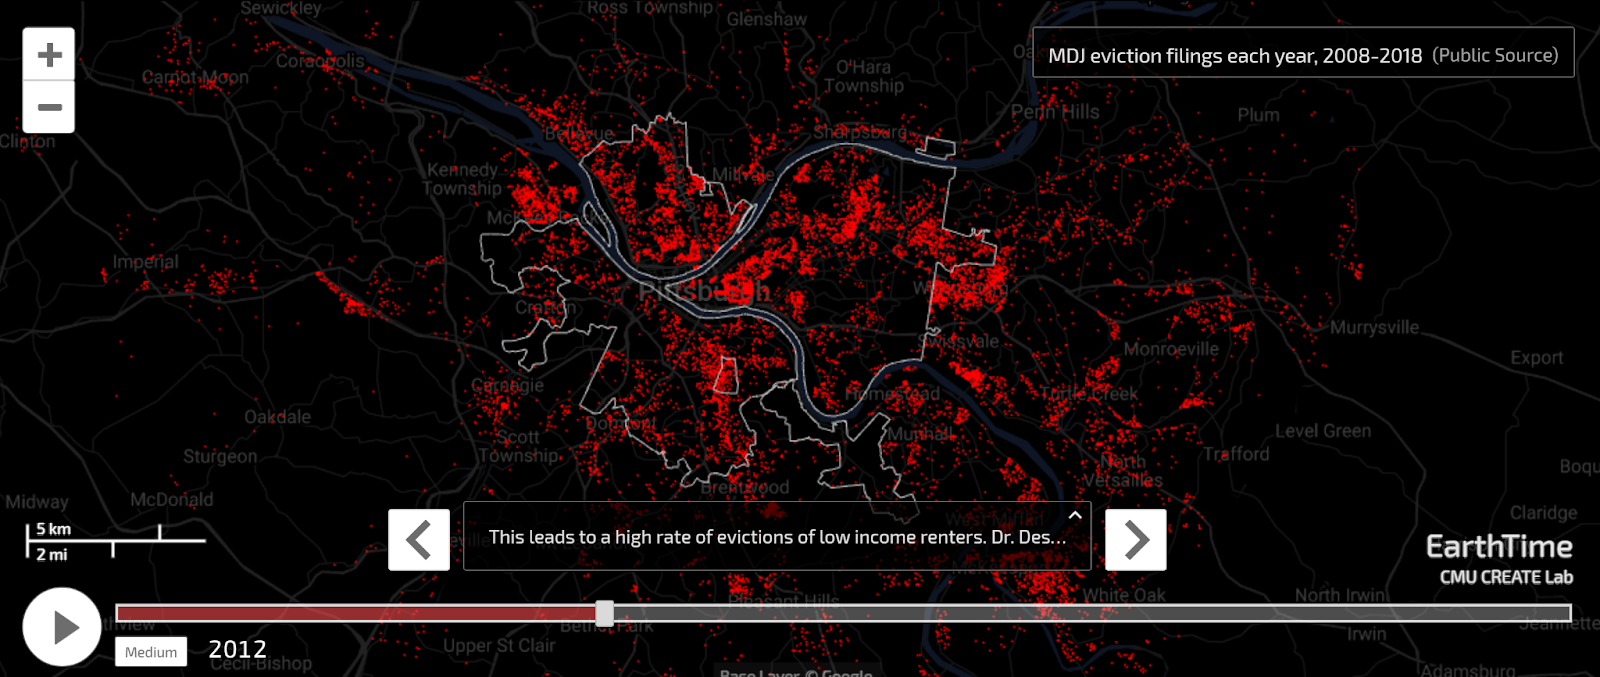
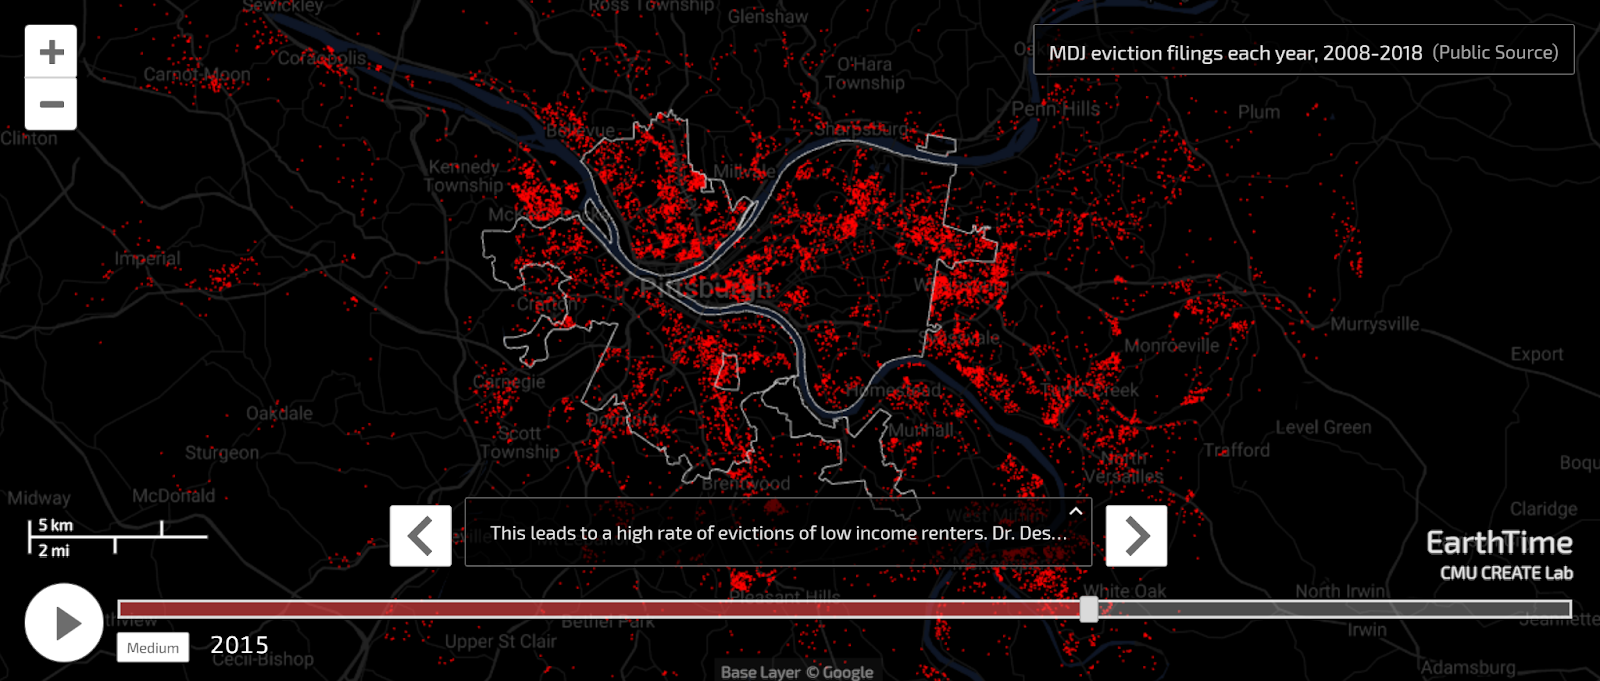
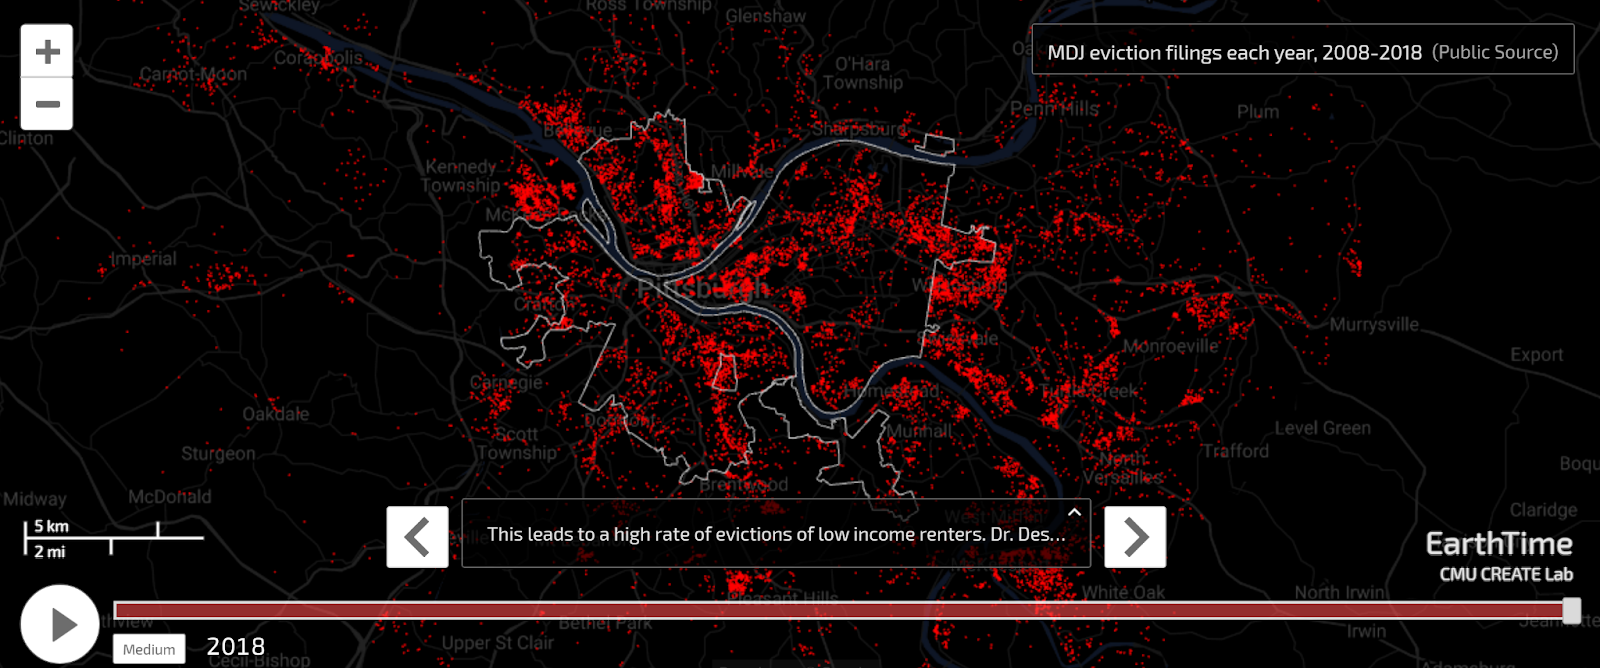
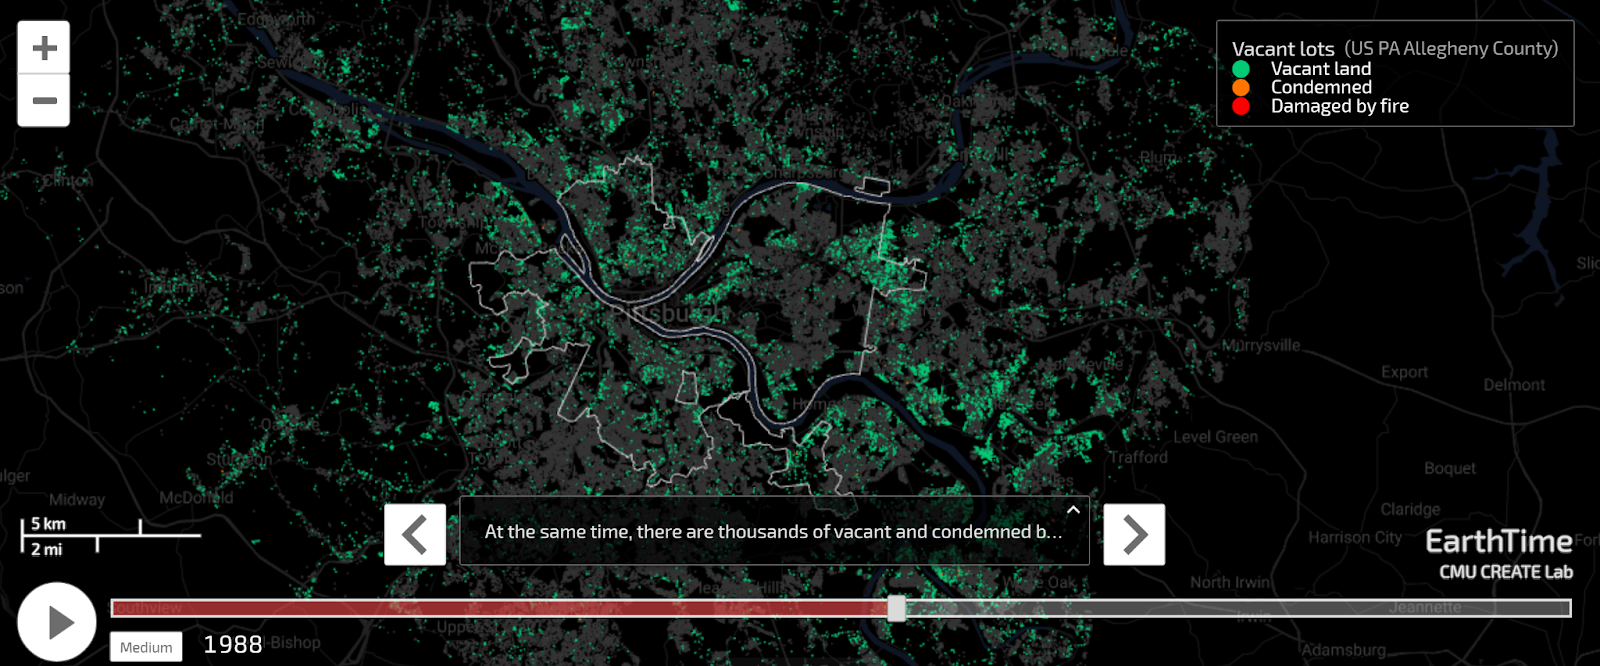
I plan to use captures from earthtime.org, a website created by the CREATE lab at CMU that compiles satellite data and various databases to visualize human impact and demographic shifts geographically. I will compile various images from the website that represent different data about Pittsburgh. To represent these images, I want to create a repeat pattern with a blank map of Pittsburgh with time on the x-axis and different measurements on the y-axis. By not immediately revealing what these graphs represent, I can probe the viewer to consider different aspects of the data (colors shifting and taking over other colors) and then later connect those to the real-life data they represent.
 |  |  |  |
 |  |  |  |
 |  |  |  |
 |  |  |  |
Choice of Materials
As it’s a screenprinting project, the materials are less important than what the visualization represents. I will likely use a cricut machine, tape, and other materials associated with screenprinting. I don’t plan to use very complicated colors, with a base of black maps with different data being represented with relatively easy to differentiate colors (red, blue, green, yellow, other stock colors).
Timeline
11/30 – final collection of all images in photoshop for cricut, full sketch of what I intend to make
11/30-12/6 – Repeated Studio Days of Cricut/Screen Printing, need one session for the base layer of maps. While that dries, preparing the screens for the next day
Overall, I need at least a few separate days of studio work to prepare all the screens and print them