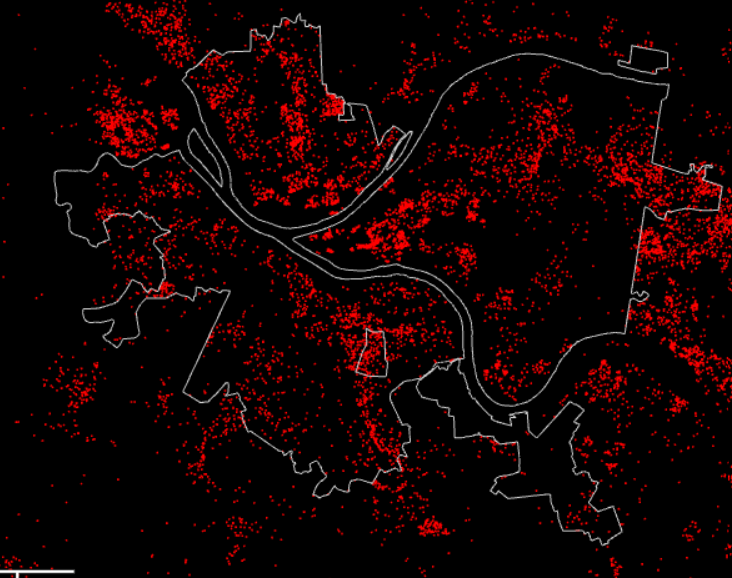
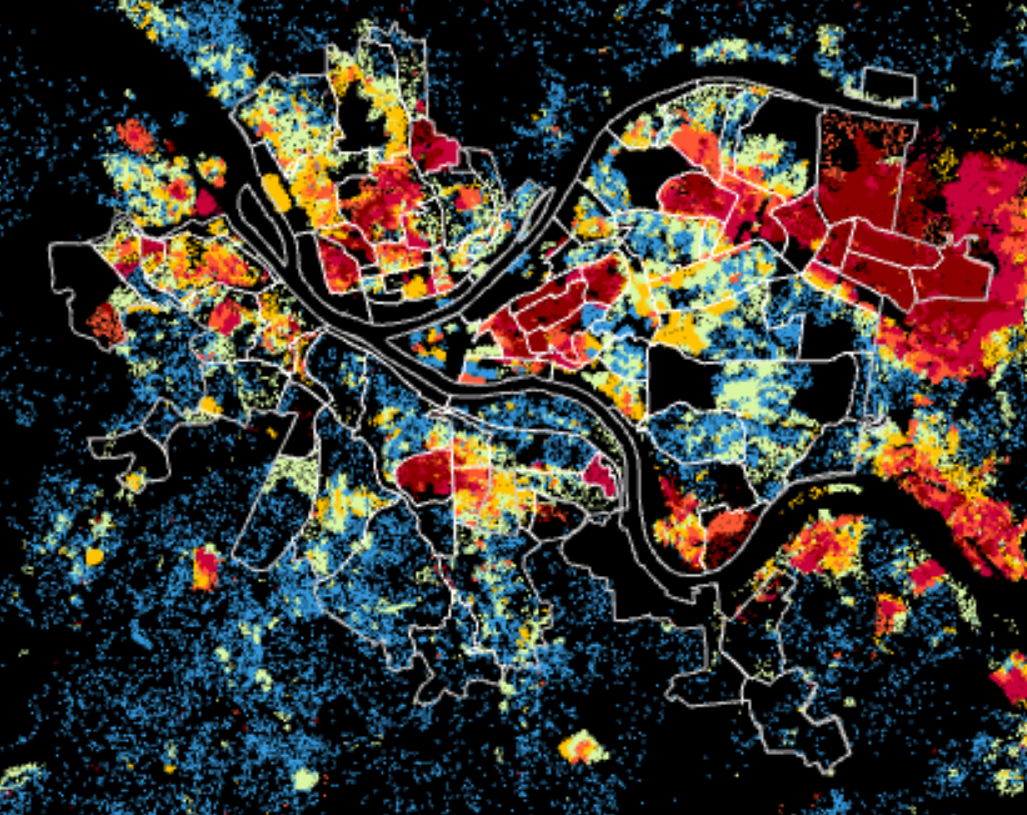
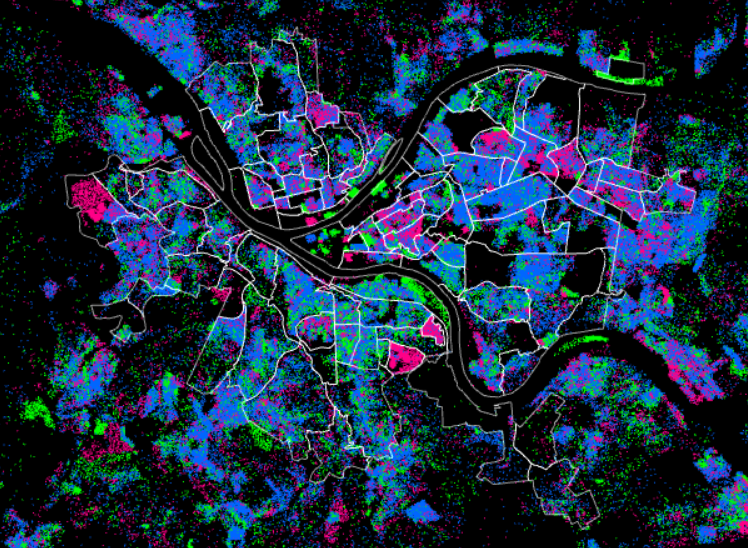
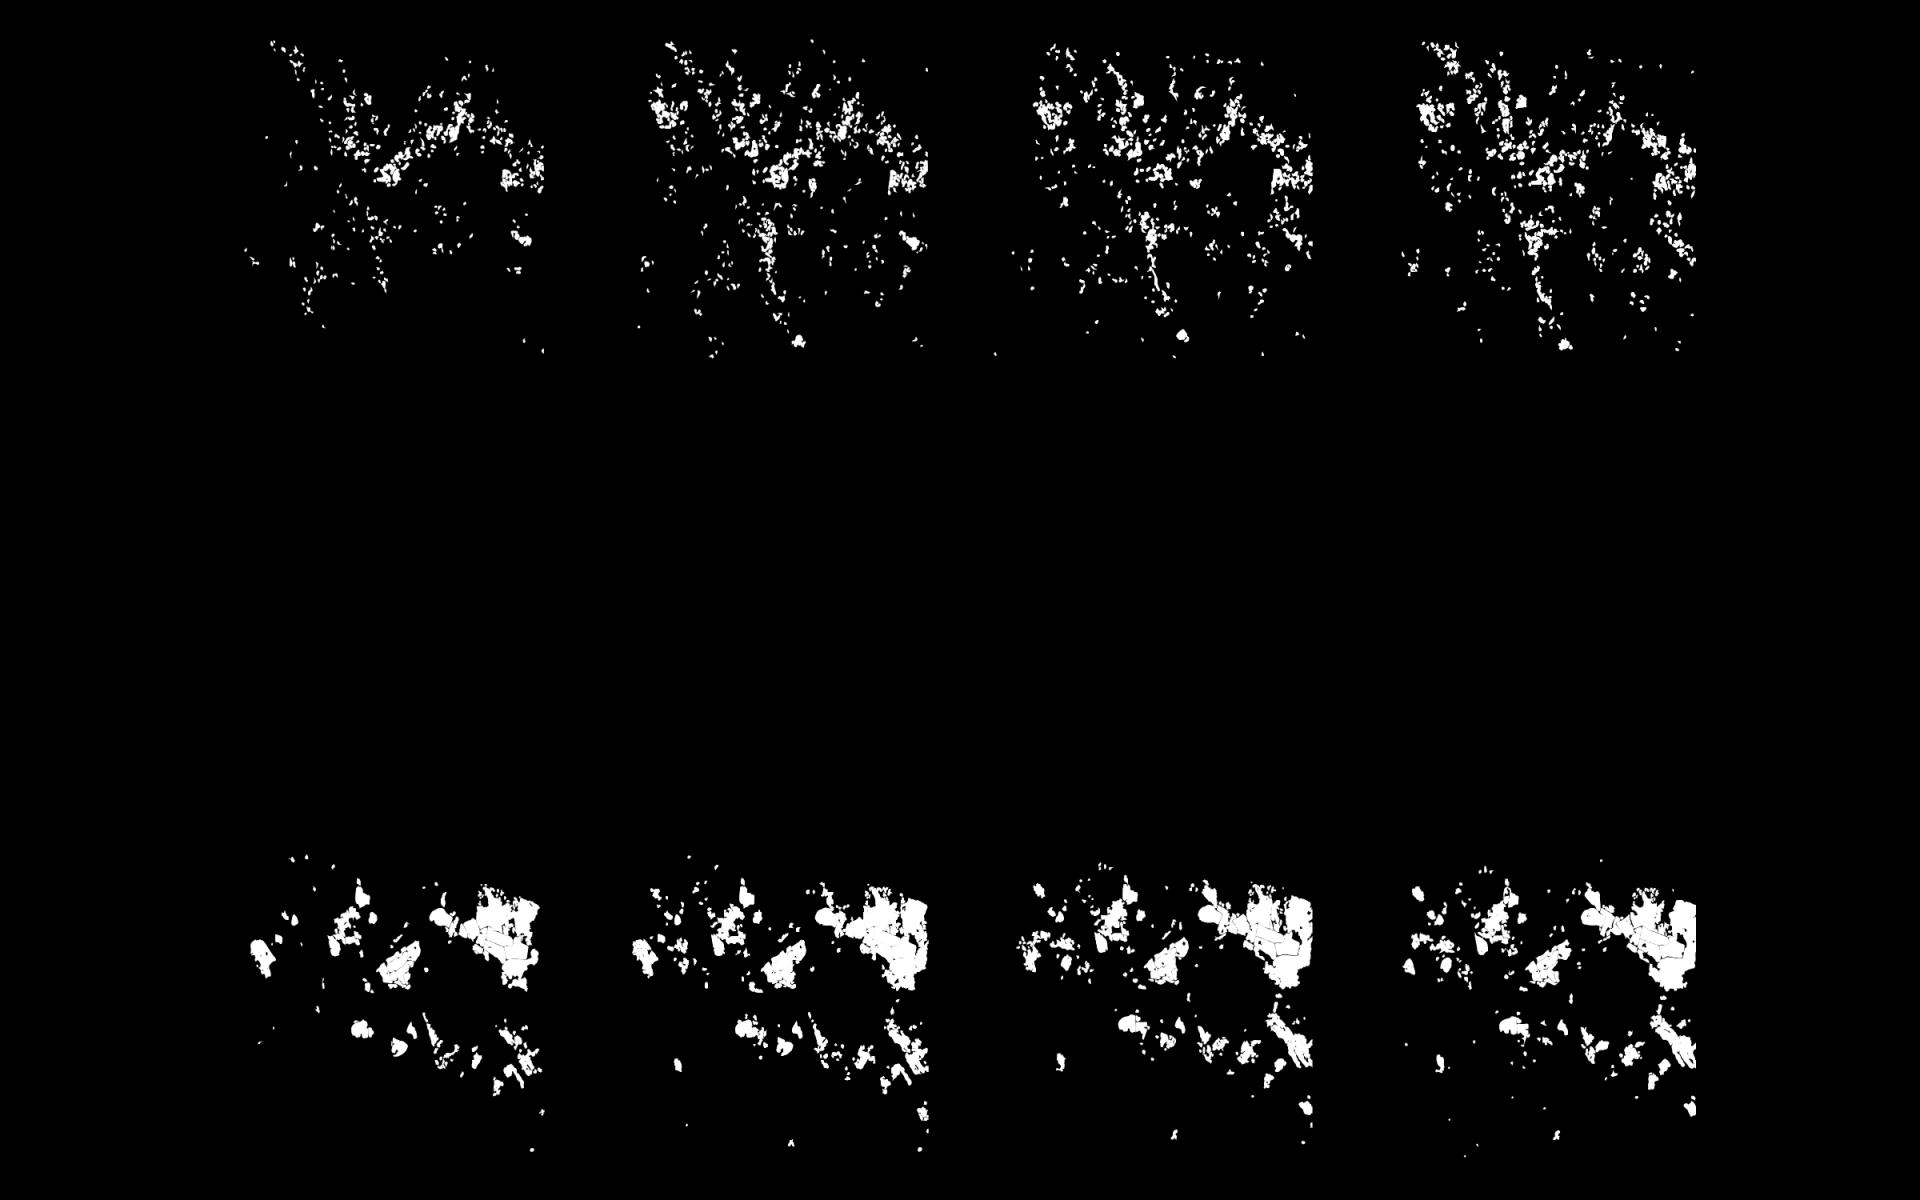
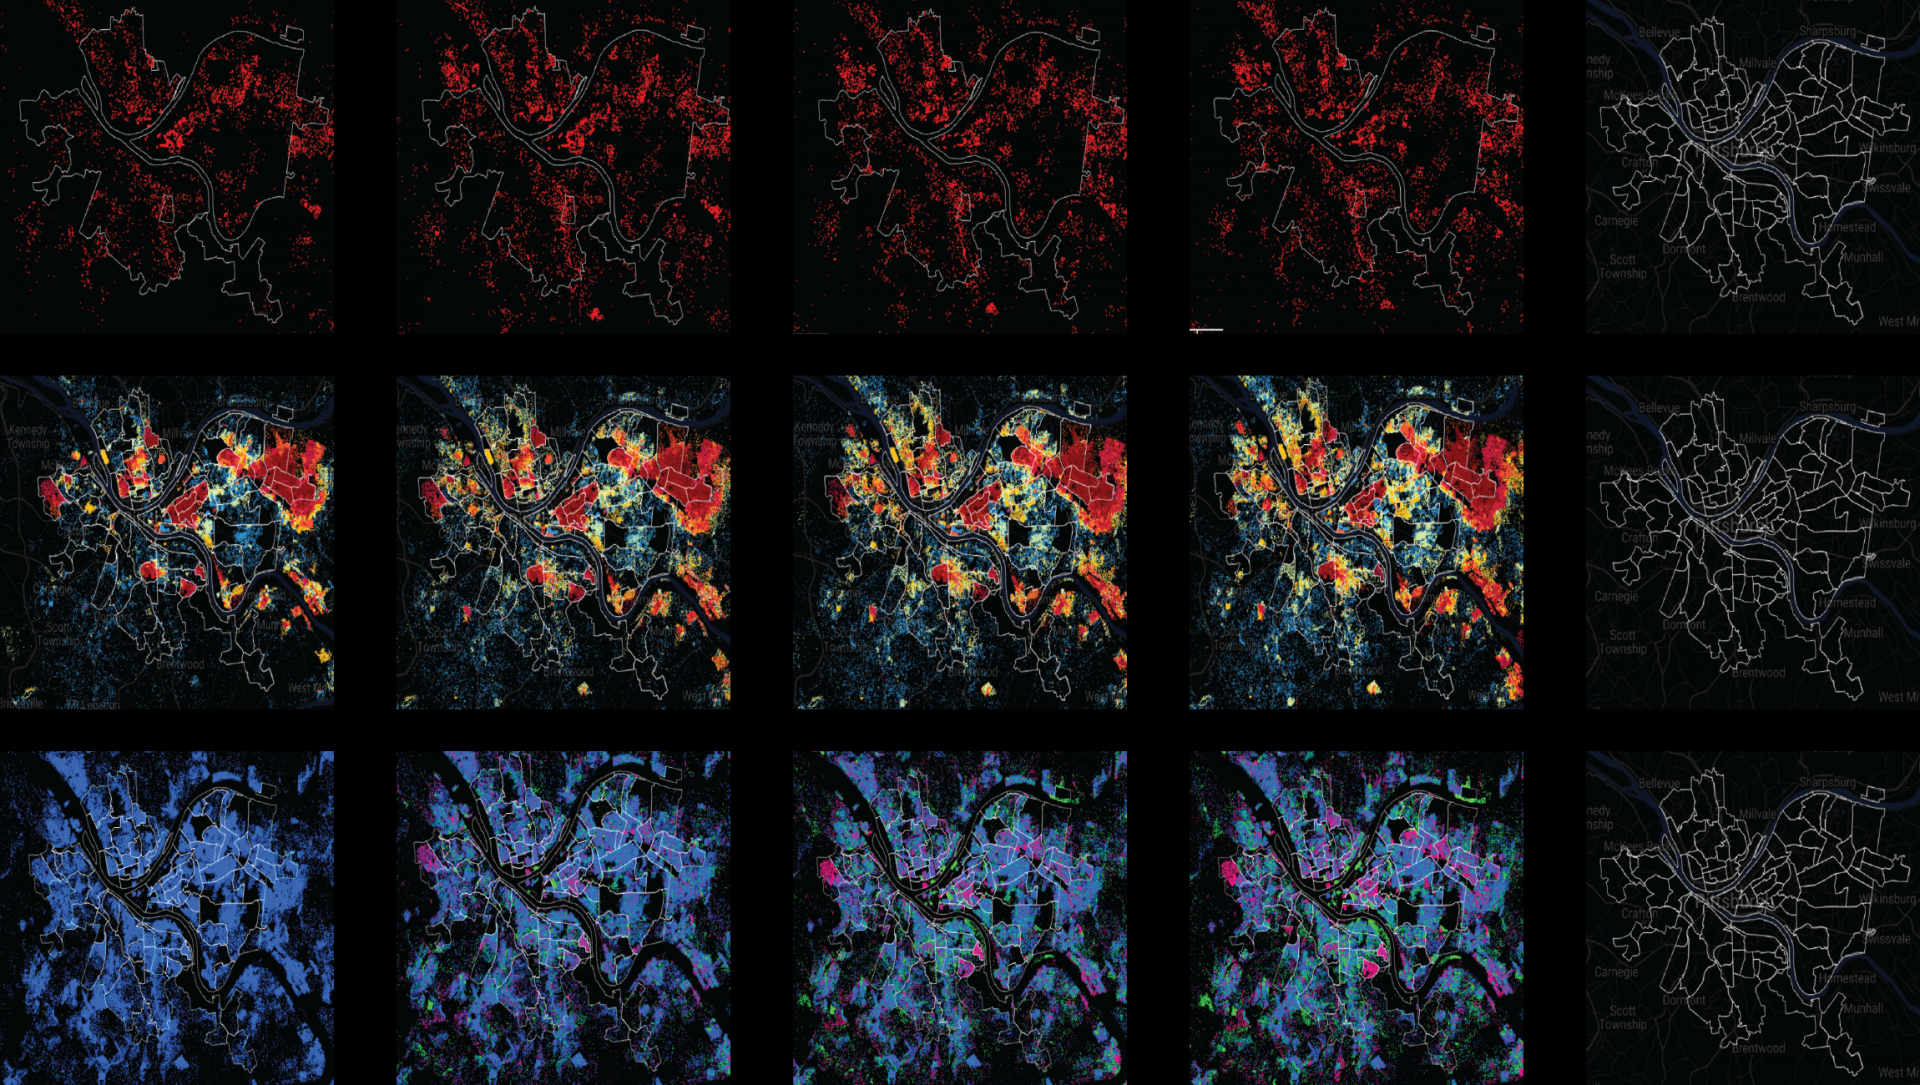
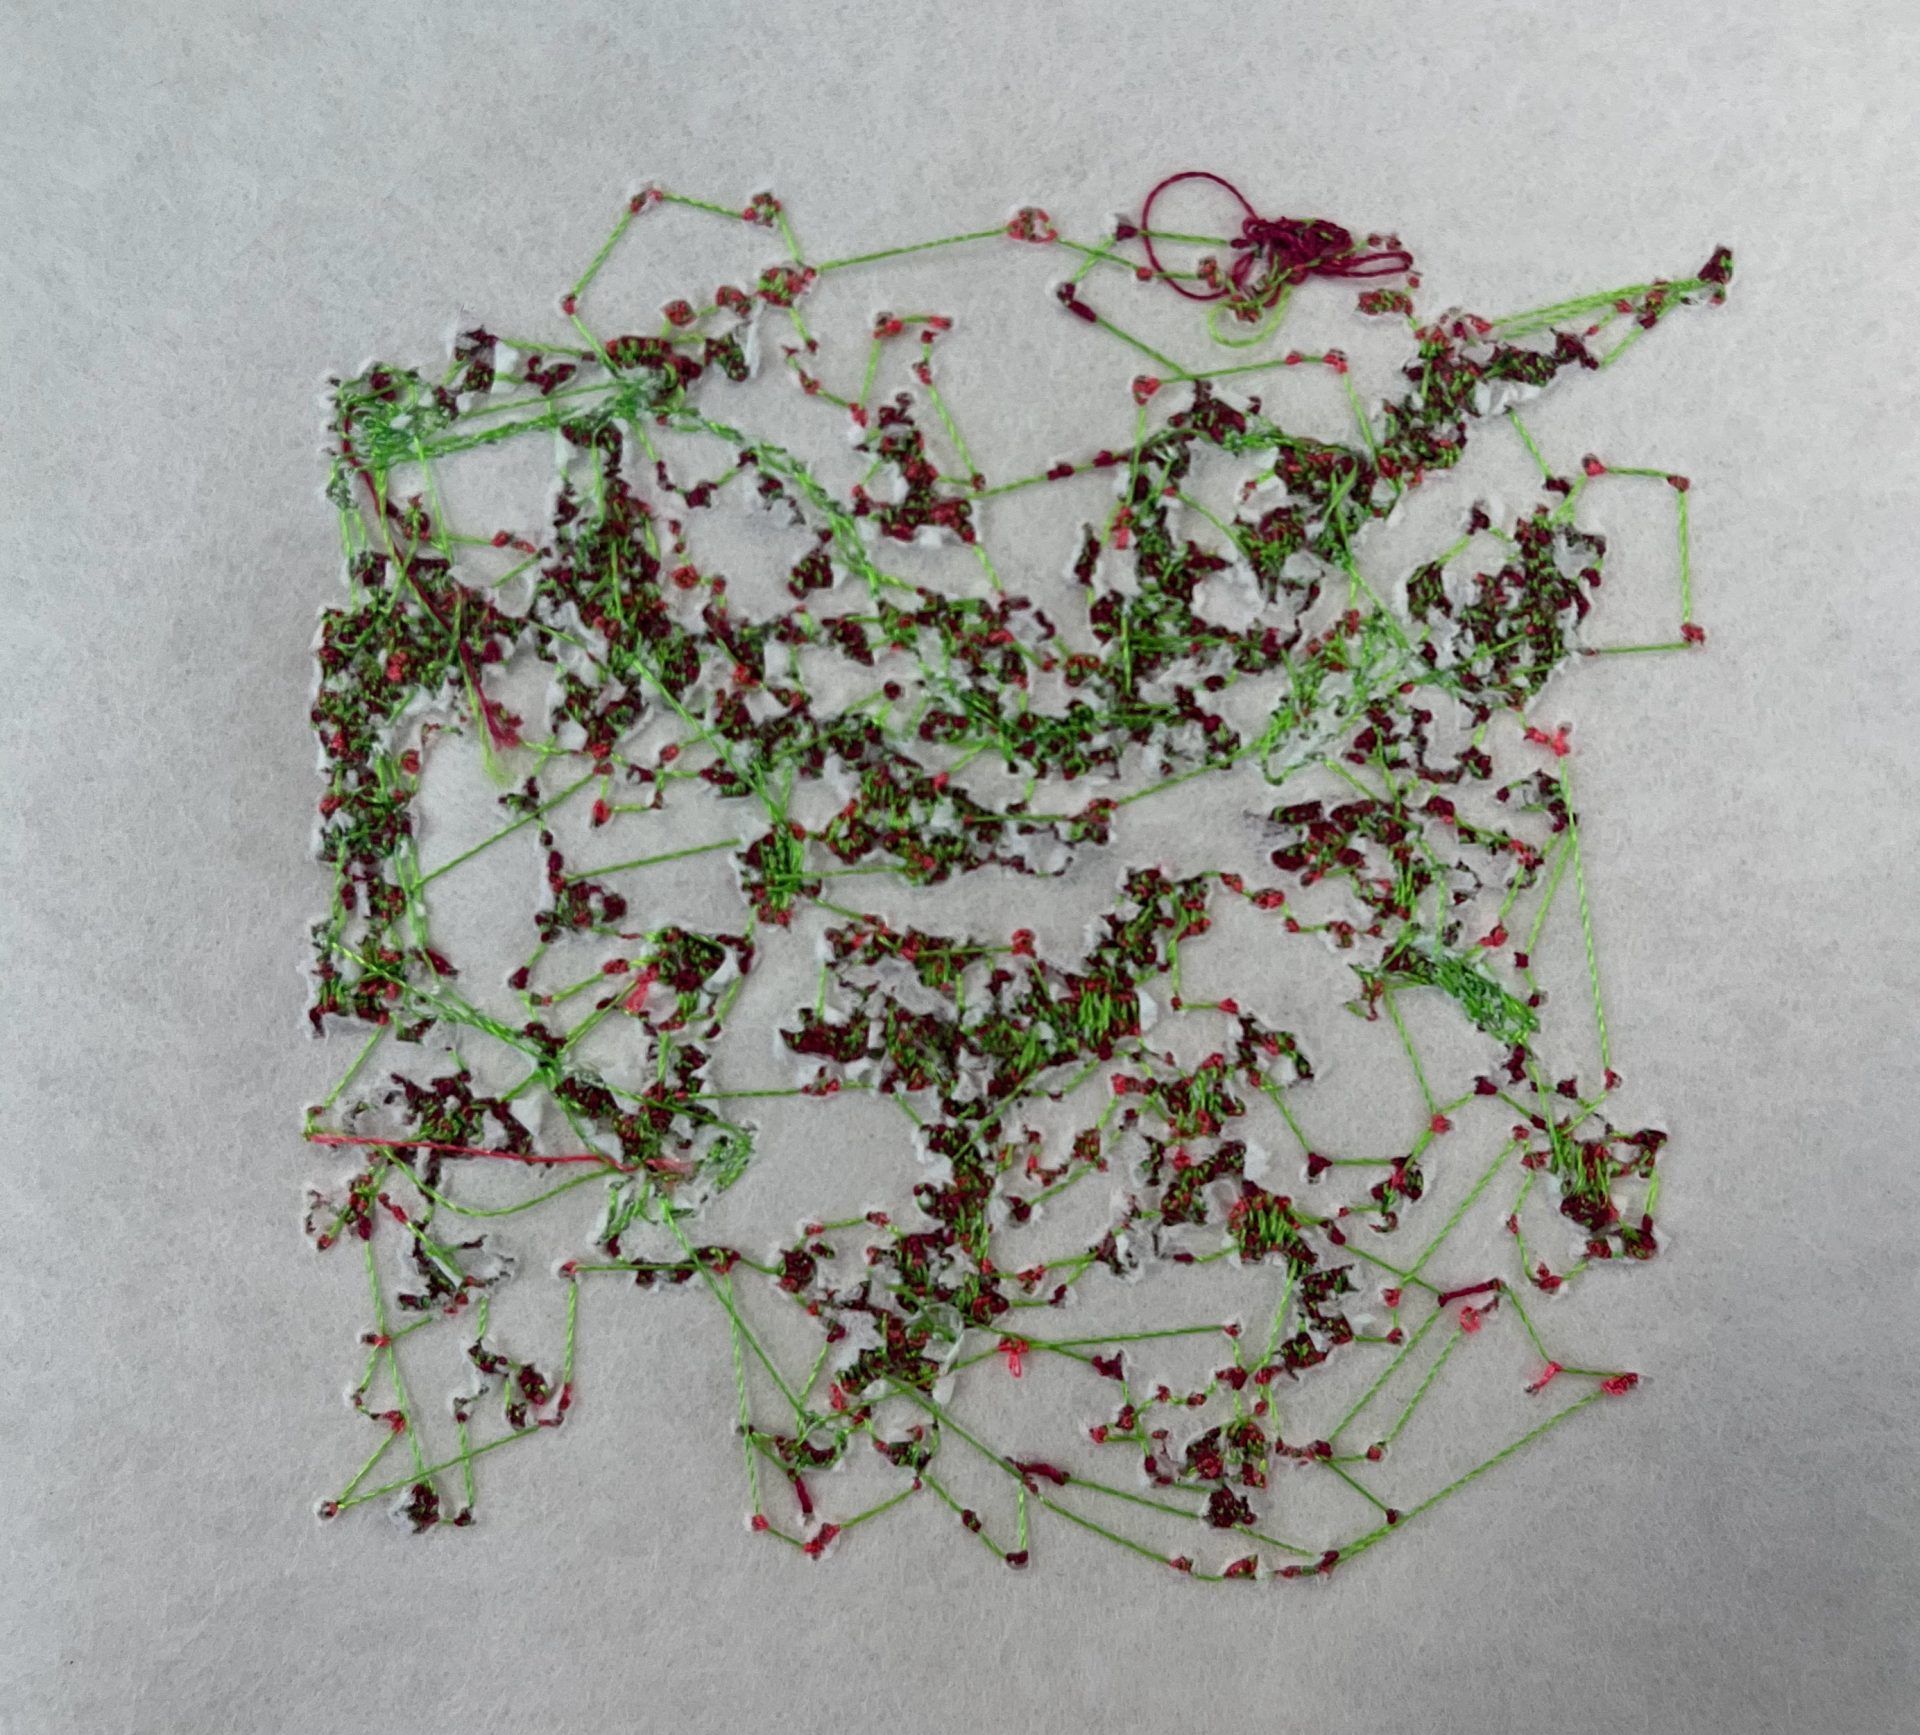
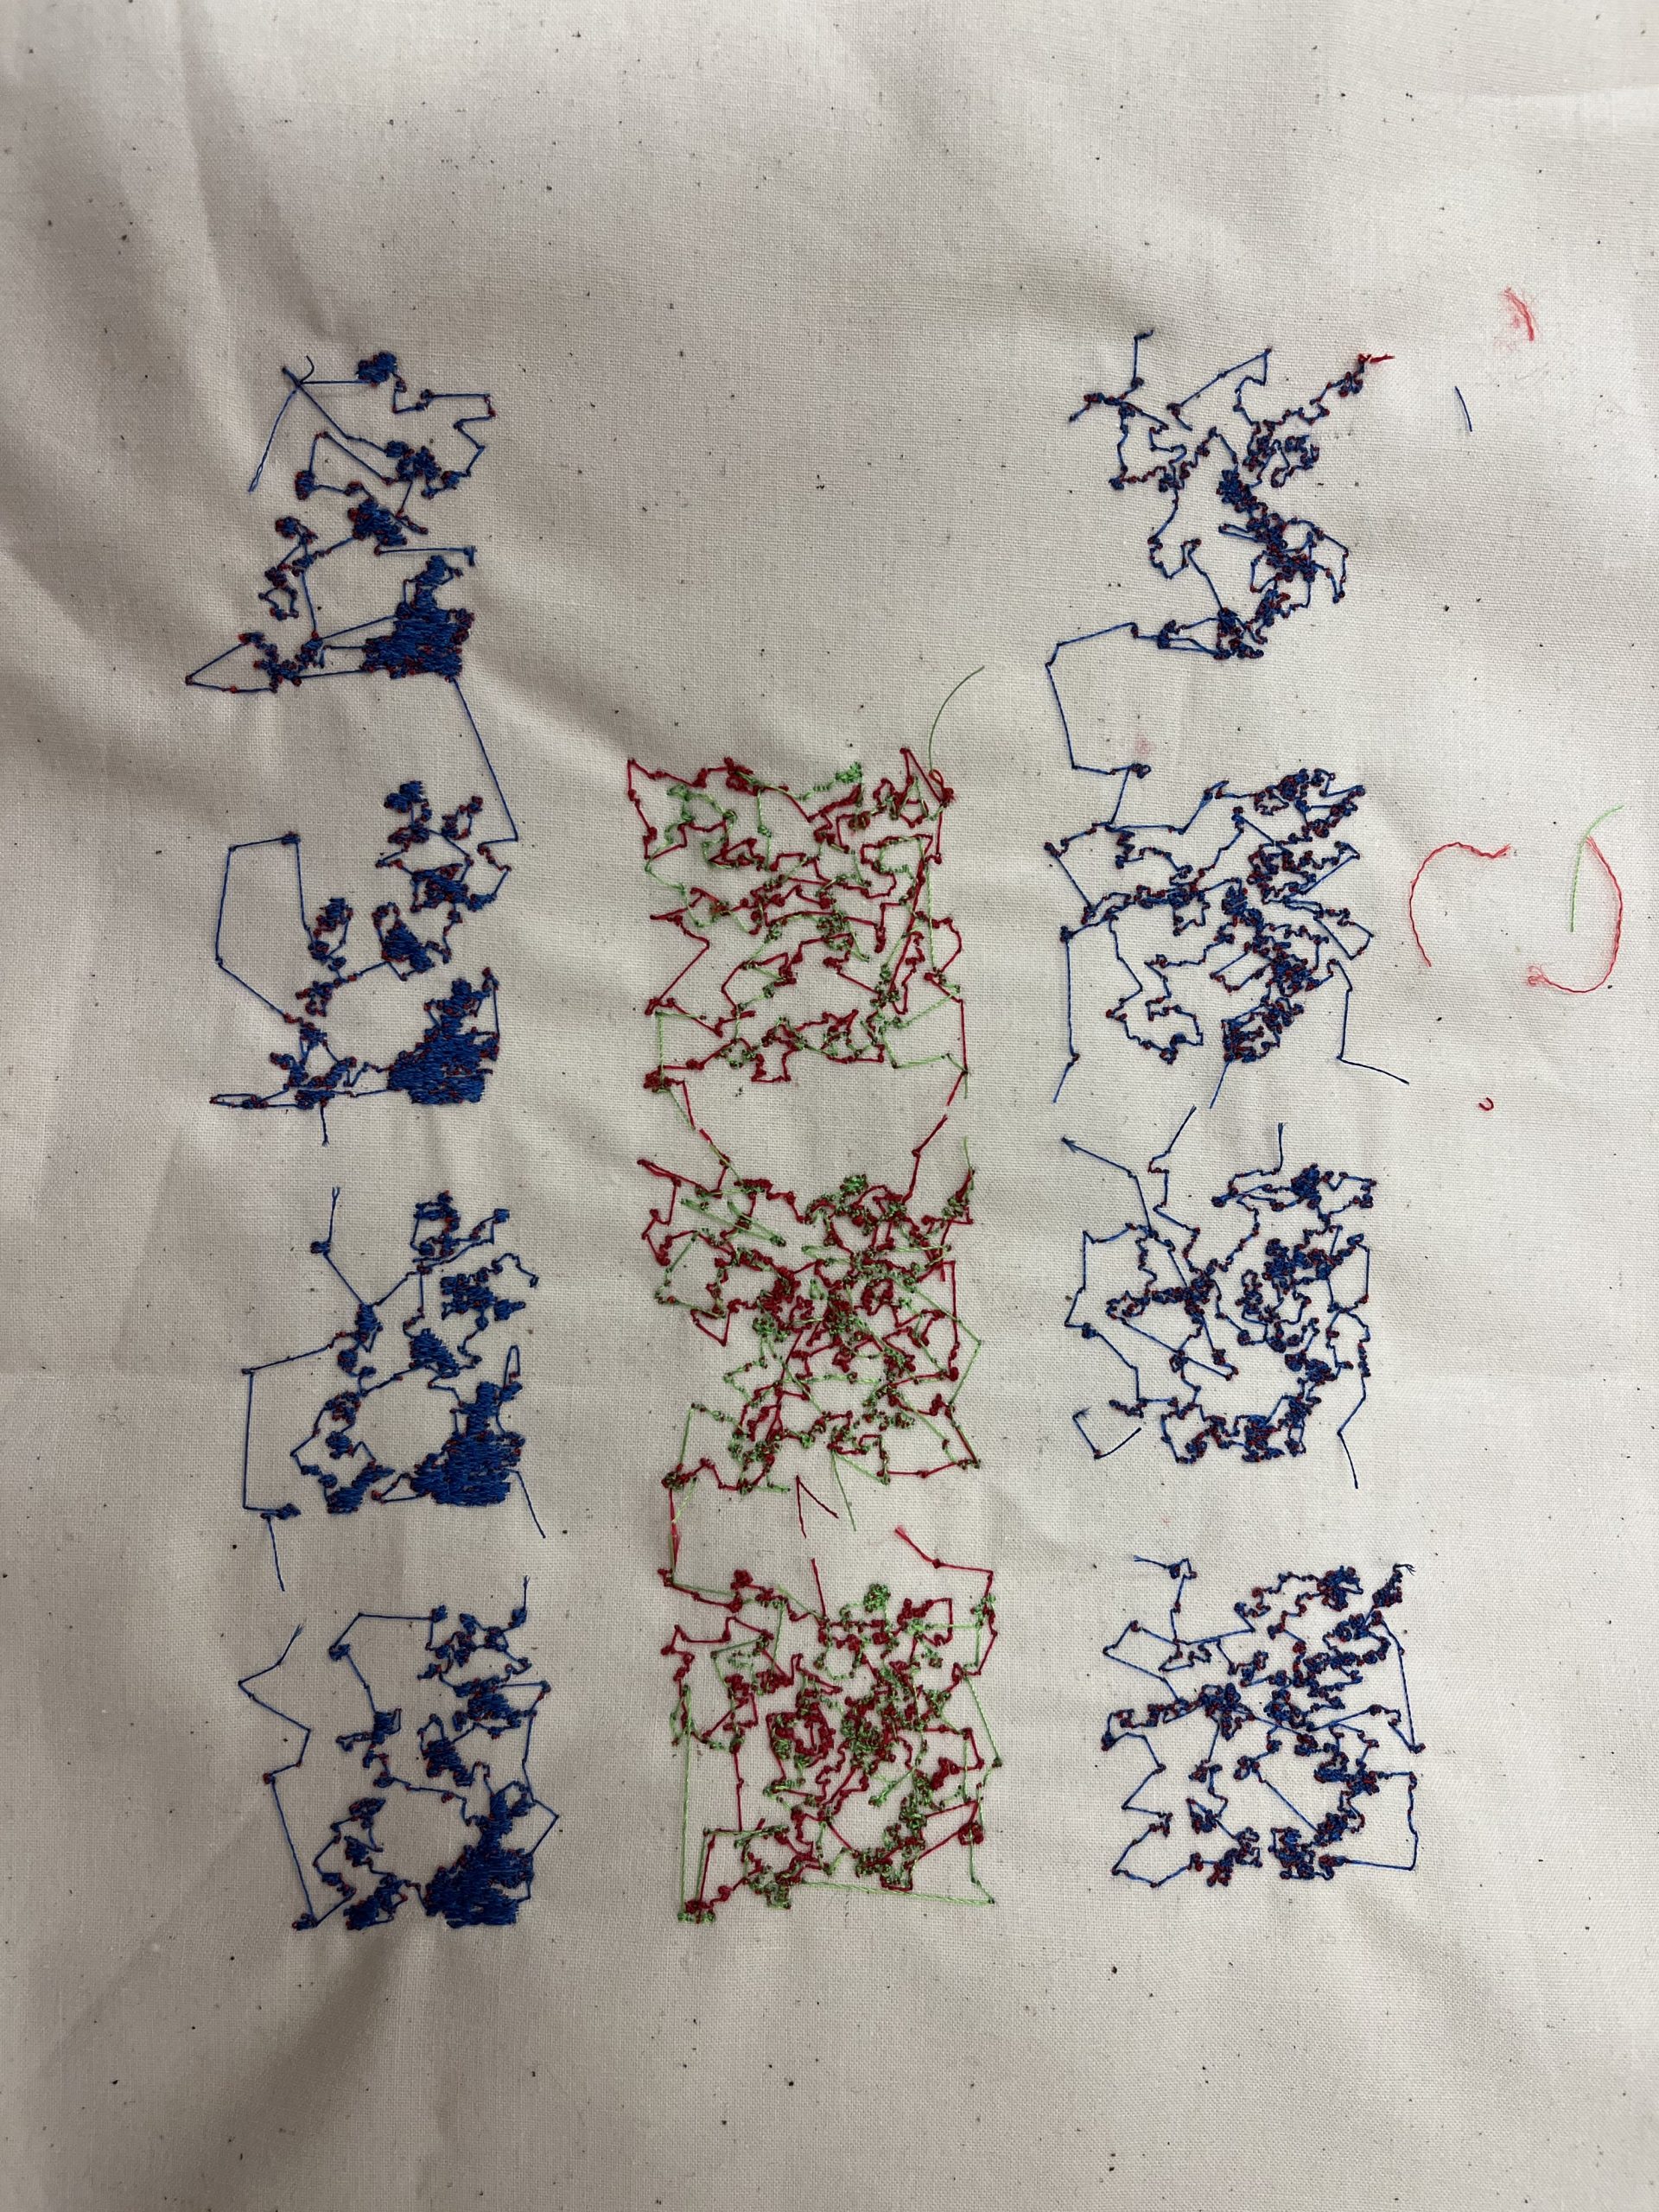
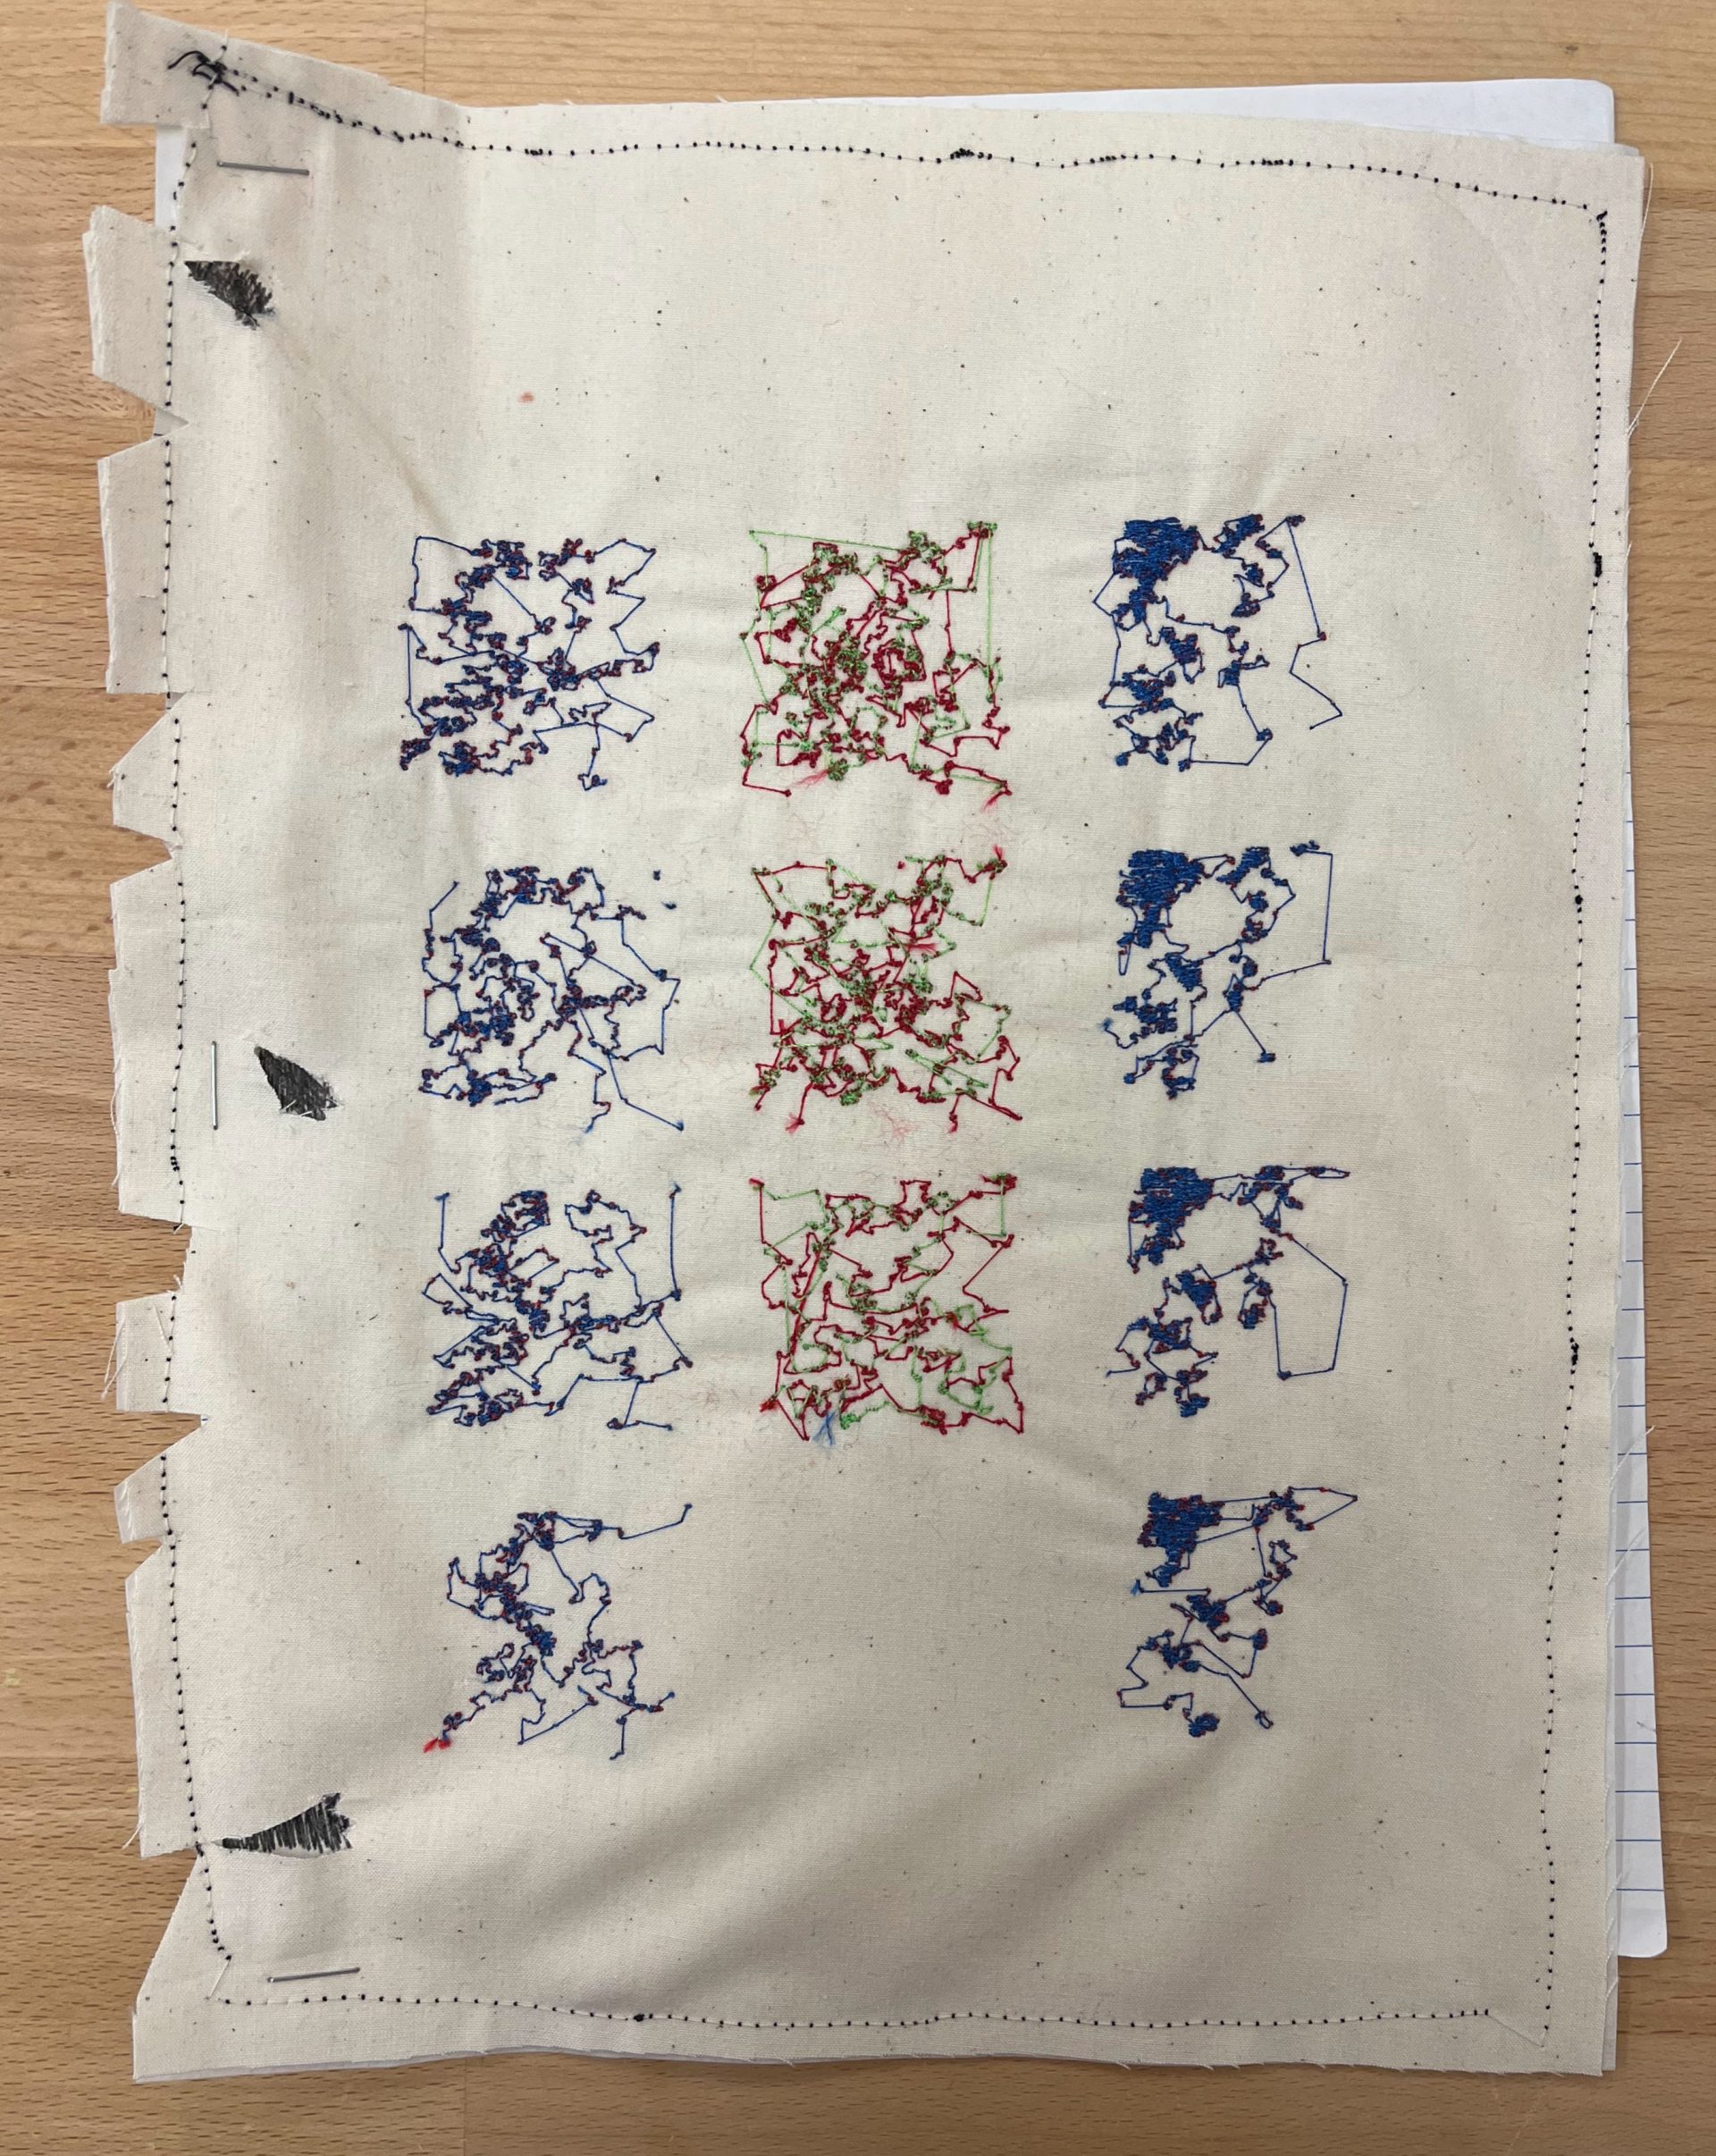
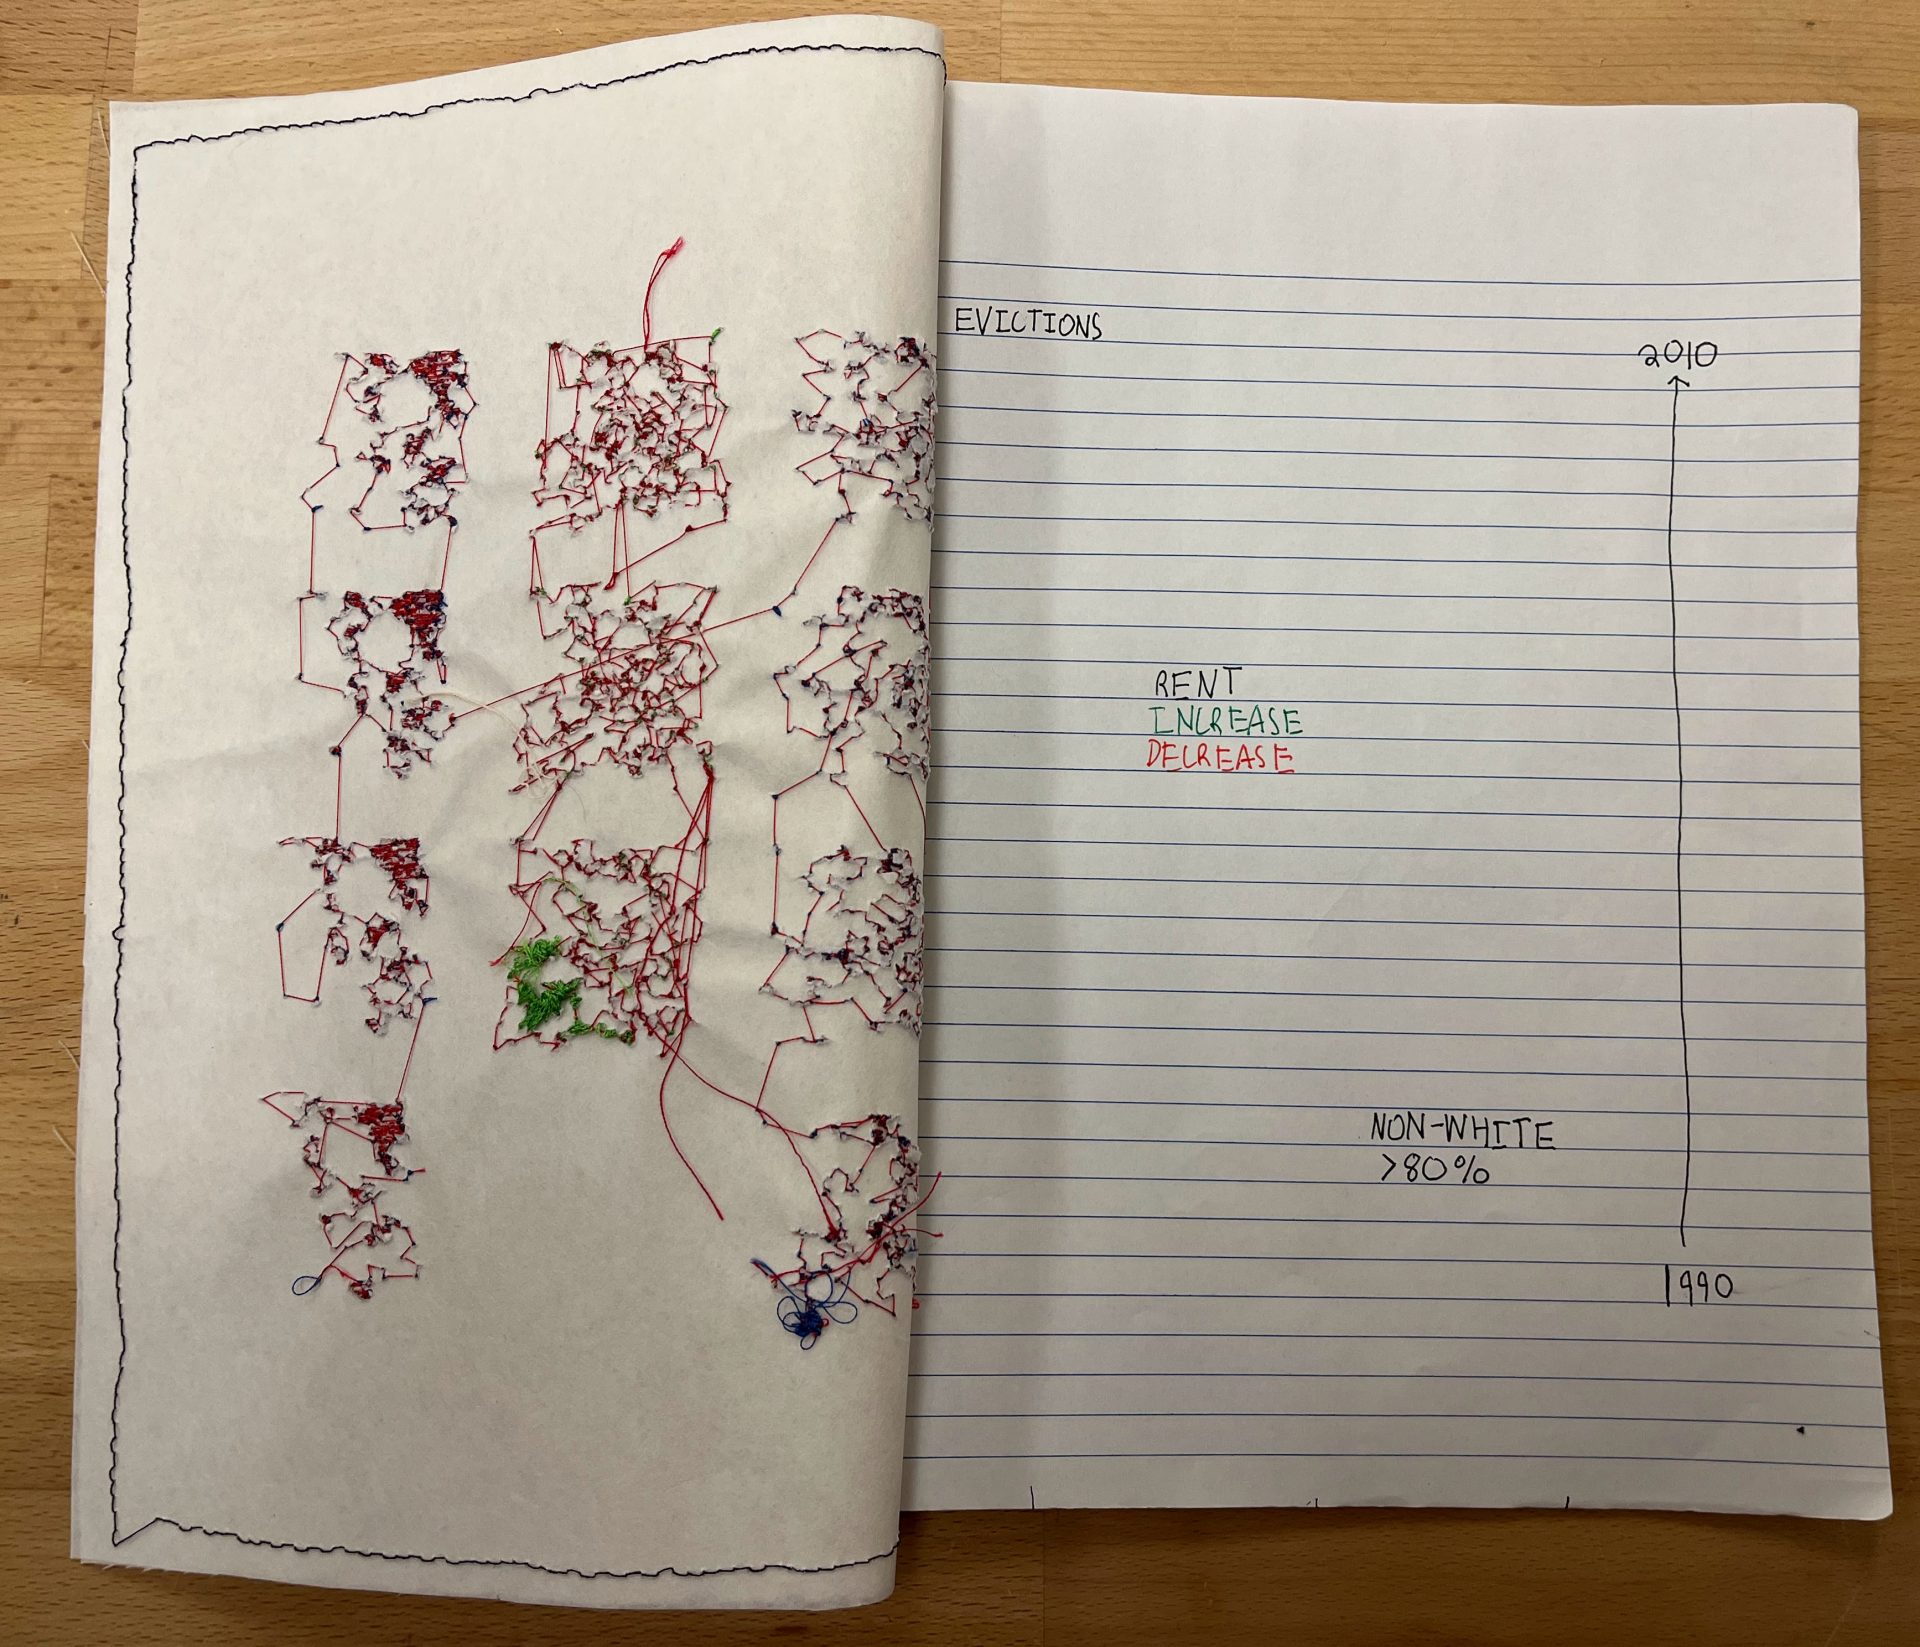
For my independent project, I gathered data from earthtime.org about Pittsburgh’s housing crisis. Specifically, I gathered snapshots between 1990-2010 of where evictions were filed, which areas saw rent increases and decreases, and the locations of areas with highest non-white populations. Then, using machine embroidery, I translated this data onto cloth. This was cut into an 8.5×11 sheet of “paper” and stapled to another sheet of notebook paper labeling and explaining the visualizations.
PEmbroider File Preparation


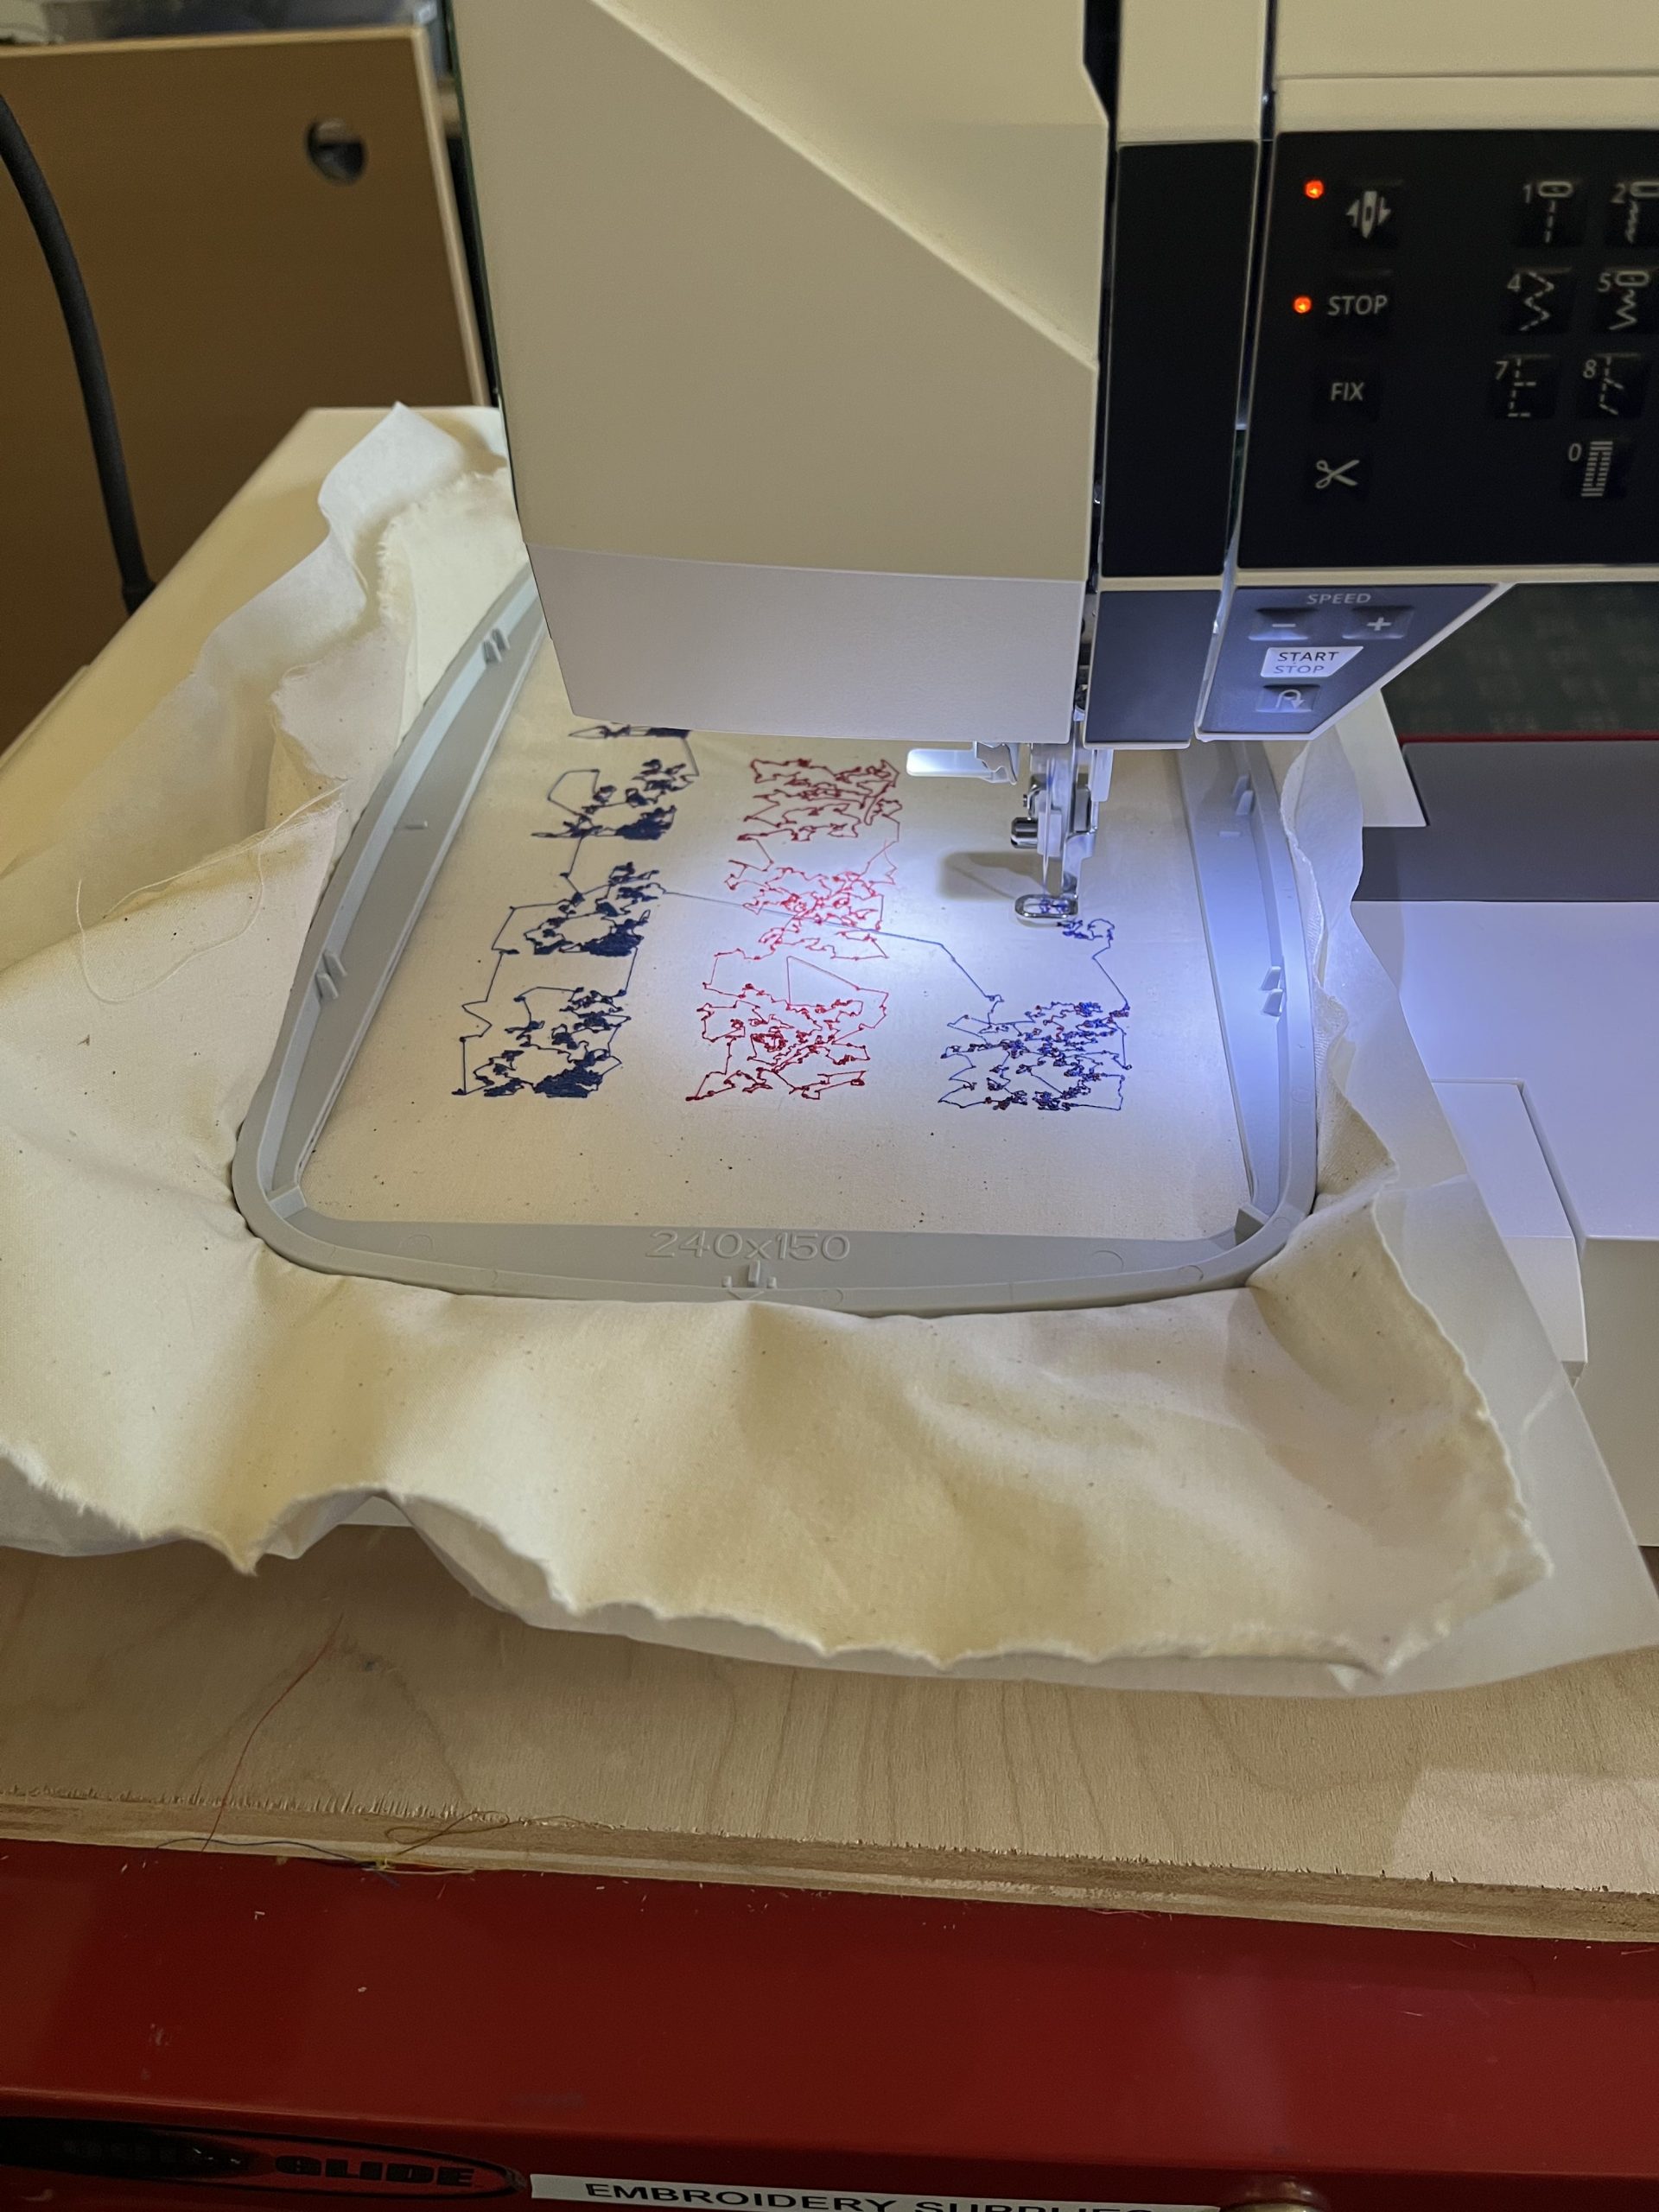
Fabrication
Reflection
Throughout this project, I familiarized myself with the relatively unintuitive PEmbroider and Adobe Illustrator software. Since I had little experience with both programs, initial work was slow. However, once I saw physical examples of some files and saw how the machine actually worked, I gained some more intuition and enjoyed the process more.
I’m happy with the final product, but if given more time would explore the topic more. I would like to see how layering data on top of each other (either on one piece of fabric or translucent layers that can be moved and arranged however you want) can further improve the visualization. I was surprised how manic the final product looked, almost unrecognizable as data. Finally, through using earthtime.org and PEmbroider (both created by CMU professors) to explore the housing crisis (an issue pushed along by gentrification encouraged by the spread of CMU), I think there’s an interesting level of irony in the piece.