![[OLD SEMESTER] 15-104 • Introduction to Computing for Creative Practice](https://courses.ideate.cmu.edu/15-104/f2022/wp-content/uploads/2023/09/stop-banner.png)
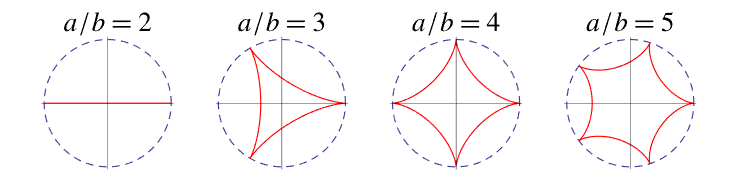
This is my curve project. I am using mouseX to control the rotation, scale, and color of curves while using mouseY to control the number of iterations. Also, when you click, the curve changes. I really like how Hypocychoid and Epitrochoid are constructed and how different iterations of them overlap one another.
//Jason Jiang
//Section E

//Setting up variables
var nPts = 200;
var a = 80;
var N;
var b
var x;
var y;
var crvMode = 1;


function setup() {
    createCanvas(400, 400);
    frameRate(10)
    colorMode(HSB);
    }


function draw() {
    //Mapping mouseY value to number of iterations
    N = map(mouseY, 0, height, 0, 25);
    b = a/N;
    background(0);

    //Draw Hypocychoid
    if (crvMode%2 == 0) {
    for(var i = 3; i <= N; i++) {
        //Decreasing strokeWeight each iteration
        strokeWeight(2-i*0.05)

        //Changing color according to mouseX
        stroke(255-mouseX*0.1, 100-i, 200-i*5)
        crv1(i);
        stroke(255-mouseX*0.1, 100-i, 100-i*5)
        crv1(PI+i);
    }
}
    //Draw Epitrochoid
    else {
        for(var i = 3; i <= N; i++){
            //Decreasing strokeWeight each iteration
            strokeWeight(2-i*0.05)

            //Changing color according to mouseX
            stroke(mouseX*0.1, 100-i, 200-i*5)
            crv2(i);
            stroke(mouseX*0.1, 100-i, 100-i*5)
            crv2(PI+i);
        }
    }
}

//Hypocychoid
function crv1(m) {
    //Changing scale and rotation according to mouseX
    h = map(mouseX, 0, width, 1, 2, true)*m*0.05;
    angle = map(mouseX, 0, width, 0, PI);

    push()
    translate(width/2, height/2);

    //Rotate curve according to mouseX
    rotate(angle + m);

    //Drawing curves
    noFill();
    beginShape()

        for(var i = 0; i < nPts; i++){
            var t1 = map(i, 0, nPts, 0, TWO_PI)
            var t2 = t1*(a-b)/b
            x = h*((a-b)*cos(t1)+b*cos(t2))
            y = h*((a-b)*sin(t1)-b*sin(t2))

            //Adding random movement to the curve
            vertex(random(x+4, x-4), random(y+4, y-4));
        }
    endShape(CLOSE);
    pop();
}

//Epitrochoid
function crv2(m) {
    //Changing scale and rotation according to mouseX
    h = map(mouseX, 0, width, 1, 2, true)*m*0.05;
    angle = map(mouseX, 0, width, 0, TWO_PI);

    push()
    translate(width/2, height/2);

    //Rotate curve according to mouseX
    rotate(angle + m);

    //Drawing curves
    noFill();
    beginShape()

        for(var i = 0; i < nPts; i++){
            var t1 = map(i, 0, nPts, 0, TWO_PI)
            var t2 = t1*(a-b)/b
            x = h*((a-b)*cos(t1)+b*sin(t2))
            y = h*((a-b)*sin(t1)-b*cos(t2))
            vertex(x, y);
        }
    endShape(CLOSE)
    pop();
}

//Change curves when press mouse
function mousePressed(){
   crvMode++
   print(crvMode);
}