![[OLD SEMESTER] 15-104 • Introduction to Computing for Creative Practice](https://courses.ideate.cmu.edu/15-104/f2022/wp-content/uploads/2023/09/stop-banner.png)
The project I choose is about visualizing several food searches on the Internet. The designer Moritz Stefaner investigates how people change preferences for particular food over months and years and how it creates a rhythm to showcase the seasonality of food queries. I love how they investigate this topic from many aspects, such as among different countries, different food, or different time.
Stefaner also puts a lot of effort into visualizing how food queries change monthly and yearly. He designed a circle with bars surrounding it clockwise to show different months. Each bar represents the number of times a keyword is searched. After that, he overlayed bars on one another with different colors across different years. Furthermore, he creates an animation to visualize the process more clearly. The rigidity in the structure of the data and clarity in its presentation makes me admire his effort.
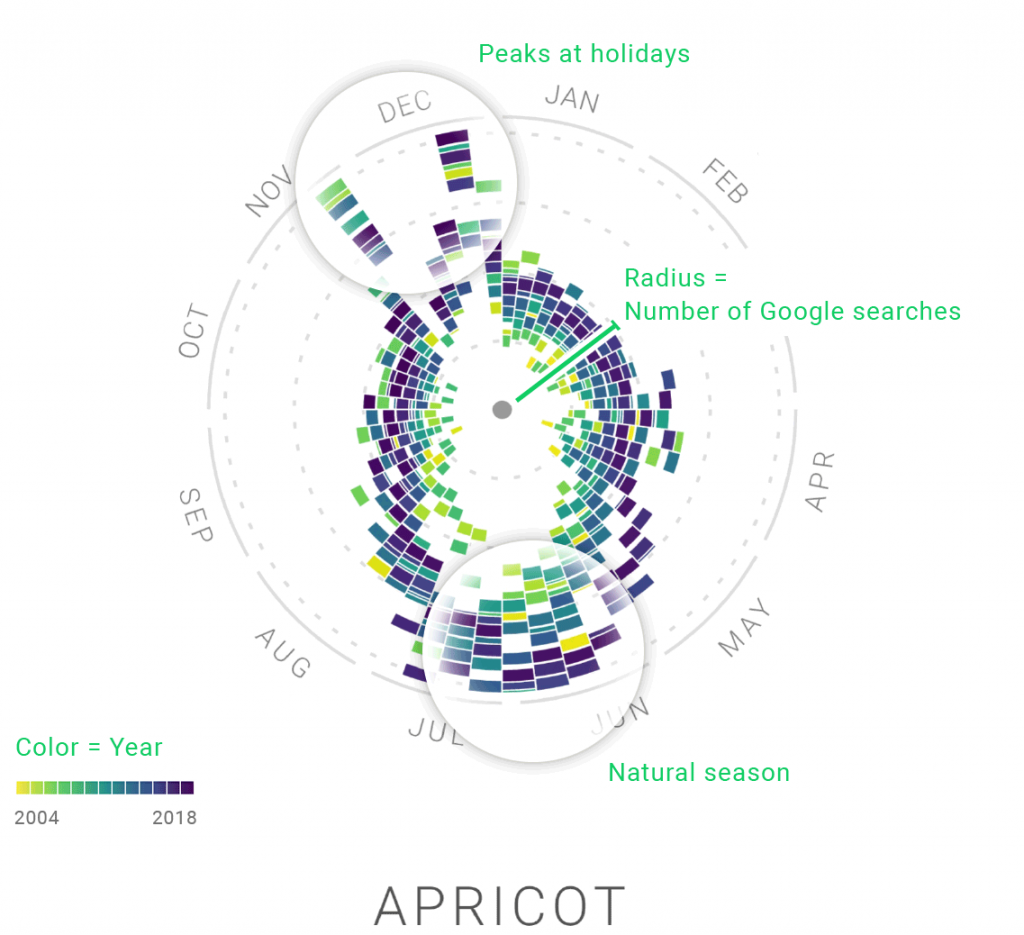
Finally, Stefaner also provides clues to help the audience understand patterns in data. For example, in months with holidays like Halloween and Christmas. He puts a marker on that day in the graph to show how the frequency of food searches might change around that day.