Blog 11

in the reading “NFTs and Copyright”, Jonathan Bailey discusses problems surrounding the recent rise in NFT popularity, especially ones concerning copyrights. One of the main problems he brings up is the instance where artists had their designs and art pieces stolen and turned into NFT’s without their consent. Moreover, Bailey discusses ways NFT auction sites have been trying to combat this with a stricter verification and certification process that removes everything that does not pass. After discussing the problems surrounding NFT’s, Bailey moves on to the positive and much more intended side of NFT’s – its ability to help creators’ public exposure. NFT’s recent popularity helps people spot truly special or meaningful designs when tons of NFT’s are arrayed with each other. To finish, Bailey takes about the circumstances that surround NFT, discussing the unsureness of its future and the sustainability of the system as it gets more and more easily accessible.

Bailey, Jonathan. “NFTs and Copyright.” Plagiarism Today, 16 Mar. 2021, https://www.plagiarismtoday.com/2021/03/16/nfts-and-copyright/.

Project 09

sketch
//Paul
//kengpul
//Section A

var img;
var newImg;

function preload() {
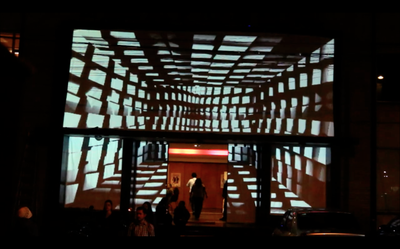
  img = loadImage('https://i.imgur.com/pqOHKd9.jpg');
}

function setup() {
  createCanvas(300, 400);
    image(img,0,0,300,400);

    for (var y = 0; y < img.height; y++) {
    for (var x = 0; x < img.width; x++) {
      // Read the pixel's color
      var ogCol = img.get(x, y);

      //creates interesting effects with the color with inversion and similar ieffects
      var r = red(ogCol);
      var g = 210 - green(ogCol);
      var b = 255 - 90 - blue(ogCol);

      var newCol = color(r, g, b);

      // Set the new pixel's color
      img.set(x, y, newCol);
    }
  }
  img.updatePixels();
  
    image(img, 0, 0, width, height);
}

function draw() {
    noStroke();
    if(mouseIsPressed){
        randomPixels();
    }
  
}


function randomPixels(){ // creates random sized magnification 
  //of wherever the mouse is on while pressed scattered across the screen
    
    var newImg = img.get(mouseX,mouseY,random(30,70),random(30,70));
    img.updatePixels();

    image(newImg, random(-10,width), random(-10,height), random(10,20),random(10,20));
}

function keyPressed(){
    //when key pressed reset
    //when key pressed reset the small square samples created wit mouse click
  if(key == "r" || key == "R"){
      image(img,0,0,300,400);
      var r = 255 - 90 - red(ogCol);
      var g = 210 - green(ogCol);
      var b = blue(ogCol);
  }


///!!! the program takes a whille to load between each filters so it might take a few sec.


//filter a
    if(key == "A" || key == "a"){

    image(img,0,0,300,400);

    for (var y = 0; y < img.height; y++) {
    for (var x = 0; x < img.width; x++) {
      // Read the pixel's color
      var ogCol = img.get(x, y);

      //creates interesting effects with the color with inversion and similar ieffects
      var r = 255 - 90 - red(ogCol);
      var g = 210 - green(ogCol);
      var b = blue(ogCol);
      var newCol = color(r, g, b);

      // Set the new pixel's color
      img.set(x, y, newCol);
    }
  }
  img.updatePixels();
    image(img, 0, 0, width, height);
  //filter b
  }else if(key == "B" || key == "b"){
    //when key pressed reset
    //background(100);
    image(img,0,0,300,400);

     image(img,0,0,300,400);

    for (var y = 0; y < img.height; y++) {
    for (var x = 0; x < img.width; x++) {
      // Read the pixel's color
      var ogCol = img.get(x, y);

      //creates interesting effects with the color with inversion and similar ieffects
      var r = 255 - 90 - (ogCol);
      var g = 210 - green(ogCol);
      var b = blue(ogCol);
      var newCol = color(r, g, b);

      // Set the new pixel's color
      img.set(x, y, newCol);
    }
  }
  img.updatePixels();
    image(img, 0, 0, width, height);
  //filter C
  }else if(key == "C" || key == "c"){
    //when key pressed reset
    //background(100);
    image(img,0,0,300,400);

     image(img,0,0,300,400);

    for (var y = 0; y < img.height; y++) {
    for (var x = 0; x < img.width; x++) {
      // Read the pixel's color
      var ogCol = img.get(x, y);

      //creates interesting effects with the color with inversion and similar ieffects
      var r = 255 - red(ogCol);
      var g = 0- green(ogCol);
      var b = 50- blue(ogCol);
      var newCol = color(r, g, b);

      // Set the new pixel's color
      img.set(x, y, newCol);
    }
  }
  img.updatePixels();
  
    image(img, 0, 0, width, height);
  }


}


Blog 09

This week’s blog, I studied the works of Laura Ramirez, aka Optika VJ. Her work explores a lot of the performative and aesthetic sides of live events like music concerts and festivals with more than 90,000 attending. She is very much about experimenting with projections and lighting effects in connection to spaces, public and private. What really interested me was her ability to create such a direct connection between computation and architecture, in a way that transforms facades and elevates ordinary spaces after dark. Moreover, her work engages the visuals on a level that becomes very “trippy” and creates a sense of elevation through a use of rhythmic patterns that I assume is combined with generative softwares that combines and creates intricate and eye-catching patterns. A great example of this is her project “EQUILIBRIUM” that was produced under one of her many labs that she has created under her brand, Optikal Ink Lab. Link to her website: http://optikalink.weebly.com/about.html 

Looking-Outwards-08

In this blog, I looked at Adam Harvey’s work and presentation. Harvey is a Interactive Telecommunications graduate of NYU with experiences in engineering and photojournalism at Penn State. In the presentation, he discusses his current projects, frame.io and megapixels.cc. Lots of his work deals with computations that are related to computer vision algorithms. For this specific presentation, it was a lot about the bias involved in surveillance and face recognition. I was really interested in the connection he makes within face recognition. In the lecture, Harvey also makes the unexpected connection between generic heat sensor camera softwares and ITA to aid his introduction. What I found very helpful was the examples he shows, especially short clips that demonstrate how their algorithms work through camera and imaging. Sections of the lecture like the one about the Brainwash Cafe were very helpful in demonstrating the risks in publicizing face recognition datasets and how they can be problematic. I really admired the way he not only showed us precedents of instances of problematic datasets, but he goes beyond to track where these datasets remerges and ends up in, to really demonstrate the risk involved.

(videos could not be embedded)

https://courses.ideate.cmu.edu/15-104/f2022/wp-content/uploads/2022/10/Eyeo-Festival-2019-on-Vimeo.html

VFRAME

Project 7

sketch
//Paul
//kengpul
//Section A
var x;
var y;
var circ = [];
// determines the line and size of the circle creating the circle w line inside
var drawingLine;
var lineDeg = 0;
var circleDeg = 0;
var colorStep = 0;
var colorStep2 = 0;

function setup() {
    createCanvas(480, 480);
    background(random(50,70),100,random(150,256));
}


function draw() {
    //creating perilin colors
    //cghanges size of the elements based on mouse y
    drawingLine = map(mouseY,0,height,20,height/5)
    //background(240,170,20);
    push();
    translate(width/2,height/2);
    rotate(radians(circleDeg));
    bigCirc();
    pop();
    circleDeg += map(5,0,width/2,0,drawingLine)*1.5;

    
    colorStep = colorStep += 0.01;
    colorStep2 = colorStep2 += 0.005;

}


//two functions under creates a line that spins 
//according to the center of the circle created in bigCirc(), this is done to replicate 
//the effect of an Astroid but with an interactive twist

function insideLine(){
    push();
    stroke(100,255,100);
    strokeWeight(1);
    //moves origin to center and top so the lines can rotate as it should
    translate(width/2-drawingLine,drawingLine/2+drawingLine*2);
    rotate(radians(lineDeg));
    line(0,0,0,drawingLine/2);
    strokeWeight(7);
    var pointCol = 255 * noise(colorStep2);
    stroke(pointCol,10,10);
    point(0,drawingLine*2);
    pop();
    //changes how "circular" the dots are printed 
    lineDeg += map(mouseX,0,width,0,5);
}

function bigCirc(){
    noFill();
    strokeWeight(1.5);

    //rgb value created with noise so each color doesnt vary too much circle to circle
    var r = 255 * noise(colorStep+5);
    var g = 255 * noise(colorStep+15);
    var b = 255 * noise(colorStep+20);
    stroke(r,g,b);
    circle(width/2-drawingLine,drawingLine/2+drawingLine*2,100);
    insideLine();
    //rotates the insideLine inside the circ
}
//when clicked , canvas resets with diff background so the program doesnt over crowd
function mousePressed(){
   background(random(50,70),100,random(150,256));
}


Blog 07

For this week’s blog about information visualization, I found the work by the Stamen Studio very compelling, especially the “OneBayArea Map” that mapps transit ranges around the entire bay area in one program. Besides the eye-catching and interactive homepage, their works include very strategic methods of making useful maps that get straight to the point without sacrificing information. The “OneBayArea Map” not only lets commuters understand commute time and distance, it directly relates this information with housing prices, helpful for homebuyers to find ideal homes to commute from. Moreover, it also encourages commuting methods like bussing, biking, and walking by showing how little time they actually take in some cases, comparable to single person vehicles. It also suggests concepts relating to socioeconomic status and access to public transportation systems. To do so, I think this project includes layering many different types of maps and consolidating the data of these, which is then transferred into codes to revisualize these data into an interactive map. The map’s aesthetics not only generates a nice looking program, but it also creates simplicity and clarity that is very important to an info-packed map.

https://stamen.com/work/onebayarea/

<img source=”https://courses.ideate.cmu.edu/15-104/f2022/wp-content/uploads/2022/10/oakland-30-2.png”>

Project 06

l

sketch
//Keng Pu (Paul) Li
//section A 

var minuteX = [];
var minuteY = [];
var minuteColor = [];
var sec;
var mnth;
var hr;

function setup() {
    createCanvas(300,400);
    rectMode(CENTER);
    //assigns array for minute fn

}

function draw() {
    background(40,10,10);
    sec = second()+1;

    //allows minute circles to produce jittering effect
     for(var i = 0; i<=minute(); i++){
        minuteX[i] = min(56+i*random(2.5,3),245);
        minuteY[i] = max(340-i*random(3,5),100);
        minuteColor[i] = minute()*4;
    }

    timeMonth();
    timeHours();
    timeMinutes();
    frameRate(sec); //higher the second faster the frame-> quickker jitters
}

function timeMonth(){
    mnth = month();
    noStroke();
    //changes color depending to season, fall = orange, winter =  blue, spring =  pink, summer = green, code in that order
    //also places circle on diff corner of that color depending on the season
    if(mnth>=9 & mnth<12){
        fill(255,160,70);
        circle(20,20,30);
    } else if(mnth>=12 & mnth<3){
        fill(18,130,210);
        circle(width-20,20,30);
    } else if(mnth>=3 & mnth<6){
        fill(255,100,220);
        circle(width-20,height-20,30);
    }else{
        fill(30,230,70);
        circle(20,height-20,30);
    }
    rect(width/2,height/2,200,300);
}


// draws a strike every hour and resets every 12 hr on top of the orange cube,, resets to 0 strikes each 24 hr

function timeHours(){
    hr = hour();
    var strikeW = (200/24) - 13;
    var strikeH = 30;
    fill(255,40,40);
    stroke(0.5);
    if(hr<24){
        for (var i = 0; i<hr; i++){
            rect((55+strikeW/2)-i*(strikeW-200/48),50-strikeH/2,strikeW,strikeH);
        }
    }else{
        var i = 0;
        for (var i = 0; i<hr; i++){
            rect((55+strikeW/2)-i*(strikeW-200/48),50-strikeH/2,strikeW,strikeH);
        }
    }
}

//for every minute, a ball is added into the orange box, and as time goes on the color of the balls get lighter, the spread also goes further ddepending on time

function timeMinutes(){
    noStroke();
    fill(0,0,0,0);
   for(var i = 0; i<=minute(); i++){
        circle(minuteX[i],minuteY[i],10);
        fill(minuteColor[i]);
    }
   

}

Randomness Blog

For this blog, I found “Eternal Connection” by Claus O.Wilke very interesting. In the series of work, he dives not only a generative method using parameters, but he also employs randomness to aid his iterations that are now available as NFT’s. His method of creating these included Javascript and WebAssembly that allows for the art to “run live in the browser”. Moreover, there were multiple strategies of generating these connections, including Perplexity progression, Random seed progression, and color palette progression. Each of these variates one single starting piece that progresses step by step in very different ways. For the random seed progression, it uses a code very similar to noise in Java, meaning between every step in the 2D or 3D noise, taking different combination of input data types Each version is different but still very closely related, creating gradual but powerful changes over a “randomizer’’ that remains constant over the course of a loop. Through combining the different progressions, the system can alter the shape, concentration, and color of the patterns. Wilke uses this to generate grids that show similar variations side by side to create interesting patterns, whether it is the changing colors, shapes, or density.

https://clauswilke.com/art/project/eternal-connection

Blog 5

For this Looking Outward blog I came across Nikola Damjanov’s “Protist Florist A01”, which is a surrealistic 3D object that resembles an alien flower/mushroom that has bloomed. In fact, the Nikola was inspired by “microfossils and radiolaria”The actual result was 3D printed but in the digital model, it is rendered and colored, showcasing its intricacy and strangeness. In this project, I really enjoy the use of patterns, while creating something very odd and irregular. I also really like how robust and bold the final result is, while contrasted with the delicate nature and attention involved to create it. It reminds me of the flora in Avatar, a movie that I am fascinated with. The process of making this was a combination of AI and Digital modeling, using very powerful machines that could get into all the fine details. More specifically, it used a “ NVIDIA Quadro RTX 6000 GPU”. While it is generative and there are endless possibilities, he creates sets of rules to create a cohesiveness between each iteration so the process is more controlled by him.

https://www.artstation.com/artwork/zDGLzm

Project 5

sketch
//Keng Pu (Paul) Li
//section A 
//9/27/22
var numLines = 50;
var dx3;
var dy3;
var dx4;
var dy4;

function setup() {
    createCanvas(500,500);
   
}

function draw() {
    var backG = random(100,200);
    background(250,0,20,random(50,backG));
    for(var w = 0; w<7; w++){
        for(var i = 0; i<18; i++){
            push();
            scale(0.15);
            translate(390+w*525,-350+i*510);
            stringArt();
            pop();
        }

         for(var i = 0; i<18; i++){
            push();
            scale(0.15);
            translate(290+w*525,350+i*510);
            stringArtFlipped();
            pop();
        }
    }
    noLoop();
}

function stringArt(){
//string art like the ones from week 4 but tranformed
//most left
    dx3 = 5;
    dy3 = 1;
    dx4 = 5;
    dy4 = 5;

//most left 
    x3 = 0;
    y3 = width/2+100;
    x4 = width/2;
    y4 = width/2+100;
    for(var i = 0; i<40; i++){
        strokeWeight(4);
        stroke(255,90,180);
        line(x3,y3,x4,y4);
        x3 += dx3;
        y3 += dy3;
        x4 -= dx4;
        y4 += dy4;
    }
    push();
    translate(0,200);
     for(var i = 0; i<40; i++){
        strokeWeight(2);
        stroke(25,255,100);
        line(x3,y3,x4/4,y4/5);
        x3 -= dx3;
        y3 += dy3;
        x4 -= dx4;
        y4 += dy4;
    }
    pop();
}


function stringArtFlipped(){
//string art like the ones from week 4 but tranformed
//most left
    dx3 = 5;
    dy3 = 1;
    dx4 = 5;
    dy4 = 5;

//most left 
    x3 = 0;
    y3 = width/2+100;
    x4 = width/2;
    y4 = width/2+100;
    push();
    rotate(radians(180));
    for(var i = 0; i<40; i++){
        strokeWeight(2);
        stroke(0,90,180);
        line(x3,y3,x4,y4);
        x3 += dx3;
        y3 += dy3;
        x4 -= dx4;
        y4 += dy4;
    }
    push();
    translate(0,200);
     for(var i = 0; i<40; i++){
        strokeWeight(1);
        stroke(255,20,10);
        line(x3,y3,x4/4,y4/5);
        x3 -= dx3;
        y3 += dy3;
        x4 -= dx4;
        y4 += dy4;
    }
    pop();
    pop();
}