![[OLD SEMESTER] 15-104 • Introduction to Computing for Creative Practice](https://courses.ideate.cmu.edu/15-104/f2022/wp-content/uploads/2023/09/stop-banner.png)
This article discusses the issue of copyright and the high value being placed on digital art which in itself is a controversial subject on whether or not it is considered art. The new trend of digital art or as the author argues “a marketable digital product” rather than referring to it as art, is being sold for very high prices to signify ownership. The idea that art has become a commodity that will significantly increase in value over time seems to be the main incentive. In this article, the author criticizes the work of Beeple, who is a digital artist who recently sold a digital file titled “Everydays: The First 5000 Days” for $69.3 million which was sold for significantly more than Titan or Raphael’s paintings. The author talks about how there isn’t a rule to determine the value of art but rather no nowadays, marketing and desire have overtaken art.
Author: Sandy
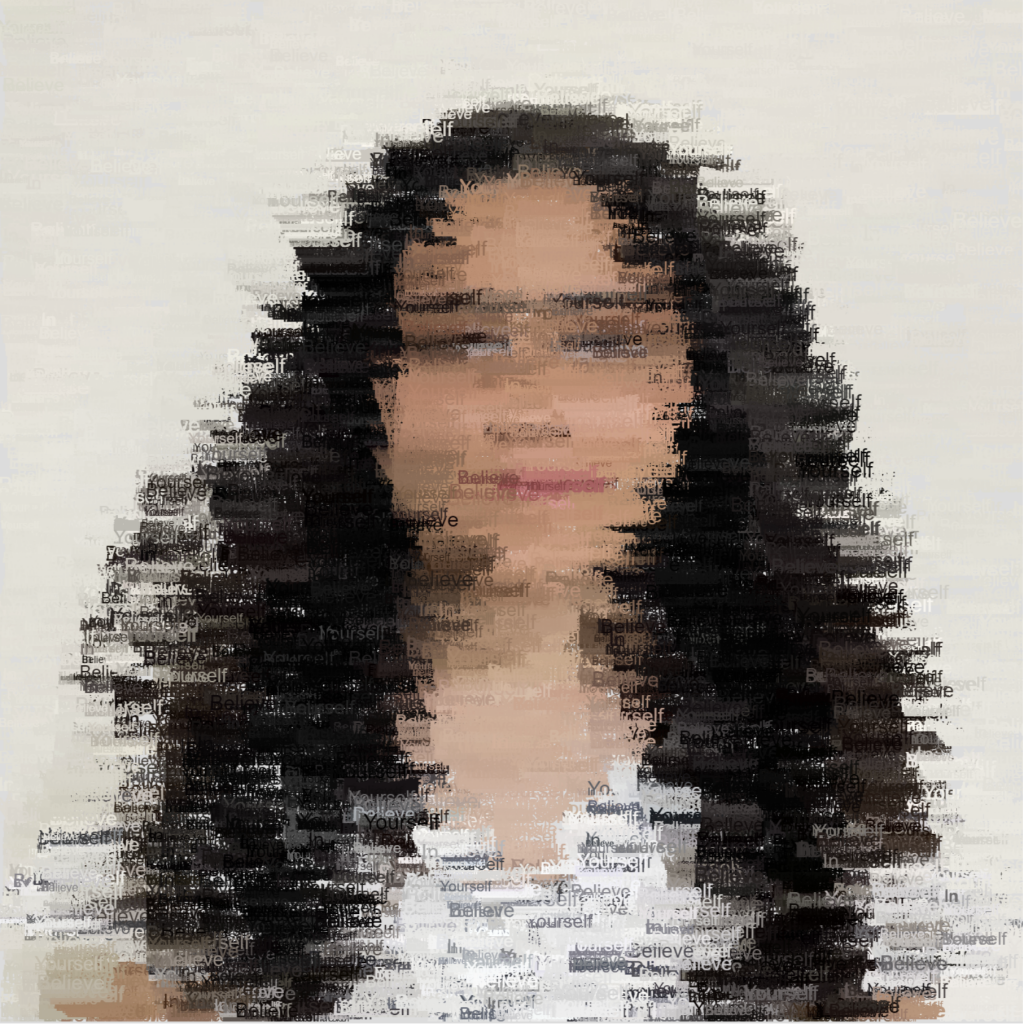
Project 09: Computational Portrait (Custom Pixel)
This process took me a while to figure out and understand. I wanted it to be interactive in some way and thought, what if you get to “paint” it?”. To my surprise, I was able to figure out the painting portion quite easily. I also wanted the pixels to be more than just squares or circles so I decided to use a phrase that I constantly need to be reminded of: “Believe in yourself”.
sketch my portraitDownload
/*
Sandy Youssef;
section D;
syoussef@andrew.cmu.edu;
Project-09;
*/

// loads portrait of my face
function preload () {
    face = loadImage ("https://i.imgur.com/47iZQND.jpeg");

}


function setup() {
    createCanvas(480, 480);
    background(220);
    face.resize(480,480); // resizes image proportionally to the canvas
    face.loadPixels(); // loads pixels data
}

function draw() {

    // pixels appear at the position of the mouse
    var ColorPixel = face.get(mouseX,mouseY);  // returns text that corresponds to the color of the image at the location of the mouse
    noStroke();

    // Array that contains words of a phrase. This allows the individual words to
    //be displayed on the canvas as opposed to the phrase as a whole to
    //create shorter sized "pixels"
    word = ["Believe", "In", "Yourself"];
    // loop that continues to iterate over the words
    for(var i = 0; i < 3; i ++) {
        //draws text random size wherever your mouse is on the canvas
        // allows you to paint the portrait!
        fill(ColorPixel);
        textSize(random(1,10));
        text(word[floor(random(word.length))], mouseX,mouseY);


    }


}

// This process took me a while to figure out and understand.
// I wanted it to be interactive in some way and I thought "what if you get to "paint" it?"
//  To my surprise, I was able to figure out the painting portion quite easily. I also wanted the
//  pixels to be more than just squares or circles so I decided to use a phrase that I constantly need to be reminded of: "Believe in yourself"
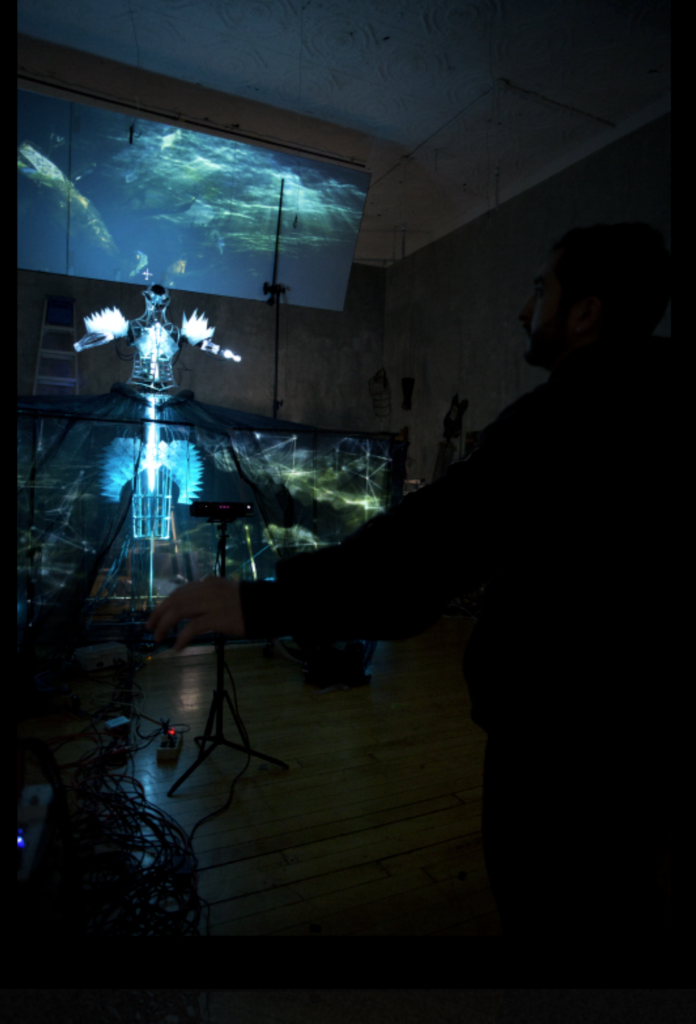
Looking Outwards 09: A Focus on Women and Non-binary Practitioners in Computational Art
Creator’s Name: Toni Dove
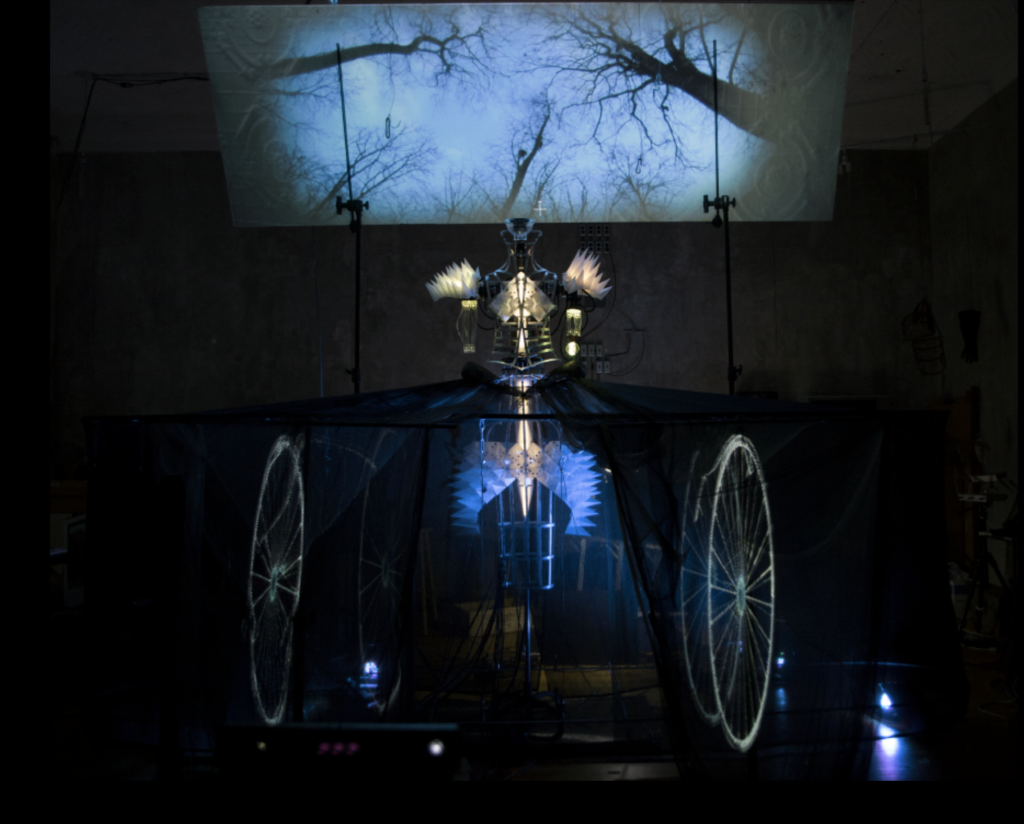
Title of Work: The Dress That Eats Souls
Year of Creation: Feb 2018
This eerie yet beautiful piece of art is incredible to look at and the experience of interacting with it seems to be quite as impressive. While many concepts are spoken about through this dress with a robotic bodice, it explores our interaction with technology, so powerful, it has the potential to consume us and our experiences. When an individual stands in front of this dress, it mimics their motion, and POV video allows the person to watch through the eyes of those who have worn the dress and hear their inner thoughts. To create this dress it must not only be built physically to make certain movements but programmed to replicate the movements of others which is quite impressive.
Toni Dove works in New York to make interface technologies that create interactive performances. She has worked on many installations and she describes The Dress That Eats Souls as “an interactive cinema and robotics installation”
https://tonidove.com/the-dress-that-eats-souls/text/
Looking Outwards 08: The Creative Practice of an Individual
Sands Fish’s website: https://www.sandsfish.com/
Sands Fish’s lecture video: https://vimeo.com/channels/eyeo2017/page:2
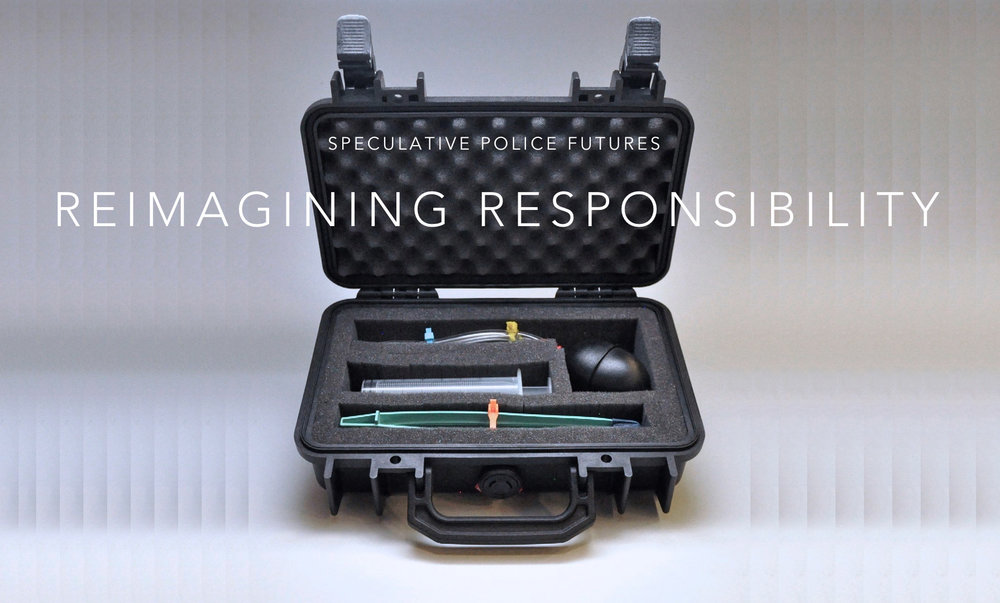
Sands fish is an Experience Designer that integrates technology to design services, interfaces, and experiences. He has previously worked with Nike to design an interactive game installation names the Joyride Experience along with MIT’s “Space Exploration Initiative”, working with NASA astronauts to design a musical instrument made to work in zero-gravity environments. Sands uses quotes, storytelling, and many visuals, other’s work that he admires, and transitions smoothly from one topic to another to present his work. Sands discusses a Futures thinking approach of thinking beyond the present and instead contemplating the possible, potential, and probable. A large emphasis of his lecture is discussing speculative design which is the idea of thinking beyond the systems, objects, etc. that already exist and asking questions. Sand’s presentation style is very effective and engaging due to the many visuals and examples he incorporated within his lecture. Since I want to be an Industrial designer, the concepts he raised and provoking design exercises, especially within the future of police are very intriguing to me and got me to think about design from a different approach.
Project-07: Composition with Curves
sketch curveDownload
/*
Sandy Youssef;
section D;
syoussef@andrew.cmu.edu;
Project-07;
*/

function setup() {
    createCanvas(480, 480);
    frameRate(6);

}

function draw() {
    // Epicloid Curve
    //https://mathworld.wolfram.com/Epicycloid.html
    background(255);
    drawEpicloid1();
    drawEpicloid2();
    drawEpicloid3();
    drawEpicloid4();
    drawEpicloid5();
    drawEpicloid6();
    drawEpicloid7();
    drawEpicloid8();


}

function drawEpicloid1() {
//curve located at the top right that moves according to mouse Y
push();
    translate( width/2-100, height/2-100);
    var x;
    var y;

    var a = 20;; // radius of smaller circle that moves around bigger circle to create points
    var b = a * 3;  // radius
    var theta = 30;
    var move = mouseY/50
    fill(255, 0, 0, 50); // transparent pink
    beginShape();
    for (var i = 0; i < 100; i ++) {
        var theta = map ( i , 0, 100, 0, TWO_PI);
        x = (a + b) * cos(theta) - b * cos (theta * (a + b) /b * move);  // mathematical formula for the curve
        y = (a + b) * sin (theta) - b * sin (theta * (a + b) /b * move);
        vertex(x,y);
    }
    endShape(CLOSE);
    pop();

}

function drawEpicloid2() {
// same curve as drawEpicloid1 but moves in opposite direction
push();
    translate( width/2-100, height/2-100);
    var x;
    var y;

    var a = 20;; // radius of smaller circle
    var b = a * 3;  // radius
    var theta = 30;
    var move = mouseY/50
    fill(200, 210, 0,50); //transparent yellow
    beginShape();
    for (var i = 0; i < 100; i ++) {
        var theta = map ( i , 0, 100, 0, TWO_PI);
        x = (a + b) * cos(-theta) - b * cos (-theta * (a + b) /b * move);  // mathematical formula for the curve
        y = (a + b) * sin (-theta) - b * sin (-theta * (a + b) /b * move);
        vertex(x,y);

    }
    endShape(CLOSE);
    pop();

}

function drawEpicloid3() {
// curve located at top right that moves according to mouse X
push();
    translate( width/2+100, height/2-100);
    var x;
    var y;

    var a = 20;; // radius of smaller circle
    var b = a * 3;  // radius
    var theta = 30;
    var move = mouseX/50
    fill(200, 210, 0,50); // transparent yellow
    beginShape();
    for (var i = 0; i < 100; i ++) {
        var theta = map ( i , 0, 100, 0, TWO_PI);
        x = (a + b) * cos(theta) - b * cos (theta * (a + b) /b * move);  // mathematical formula for the curve
        y = (a + b) * sin (theta) - b * sin (theta * (a + b) /b * move);
        vertex(x,y);
    }
    endShape(CLOSE);
    pop();

}

function drawEpicloid4() {
// same curve as drawEpicloid3 but moves in opposite direction according to mouse X
push();
    translate( width/2+100, height/2-100);
    var x;
    var y;

    var a = 20;; // radius of smaller circle
    var b = a * 3;  // radius
    var theta = 30;
    var move = mouseX/50
    fill(200, 0, 0,100); // brighter pink
    beginShape();
    for (var i = 0; i < 100; i ++) {
        var theta = map ( i , 0, 100, 0, TWO_PI);
        x = (a + b) * cos(-theta) - b * cos (-theta * (a + b) /b * move);  // mathematical formula for the curve
        y = (a + b) * sin (-theta) - b * sin (-theta * (a + b) /b * move);
        vertex(x,y);
    }
    endShape(CLOSE);
    pop();

}

function drawEpicloid5() {
// curve located in bottom right corner that moves according to mouse Y
push();
    translate( width/2+100, height/2+100);
    var x;
    var y;

    var a = 20;; // radius of smaller circle
    var b = a * 3;  // radius
    var theta = 30;
    var move = mouseY/50
    fill(200, 210, 0,50); // transparent yellow
    beginShape();
    for (var i = 0; i < 100; i ++) {
        var theta = map ( i , 0, 100, 0, TWO_PI);
        x = (a + b) * cos(theta) - b * cos (theta * (a + b) /b * move);  // mathematical formula for the curve
        y = (a + b) * sin (theta) - b * sin (theta * (a + b) /b * move);
        vertex(x,y);
    }
    endShape(CLOSE);
    pop();

}

function drawEpicloid6() {
// same curve as drawEpicloid5 but moves in opposite direction according to mouse Y
push();
    translate( width/2+100, height/2+100);
    var x;
    var y;

    var a = 20;; // radius of smaller circle
    var b = a * 3;  // radius
    var theta = 30;
    var move = mouseY/50
    fill(0, 210, 0,50); // transparent green
    beginShape();
    for (var i = 0; i < 100; i ++) {
        var theta = map ( i , 0, 100, 0, TWO_PI);
        x = (a + b) * cos(-theta) - b * cos (-theta * (a + b) /b * move);  // mathematical formula for the curve
        y = (a + b) * sin (-theta) - b * sin (-theta * (a + b) /b * move);
        vertex(x,y);
    }
    endShape(CLOSE);
    pop();
}

function drawEpicloid7() {
// curve located in bottom left corner that moves according to mouse X
push();
    translate( width/2-100, height/2+100);
    var x;
    var y;

    var a = 20;; // radius of smaller circle
    var b = a * 3;  // radius
    var theta = 30;
    var move = mouseX/50
    fill(0, 250, 0,130); // brighter transparent green
    beginShape();
    for (var i = 0; i < 100; i ++) {
        var theta = map ( i , 0, 100, 0, TWO_PI);
        x = (a + b) * cos(theta) - b * cos (theta * (a + b) /b * move);  // mathematical formula for the curve
        y = (a + b) * sin (theta) - b * sin (theta * (a + b) /b * move);
        vertex(x,y);
    }
    endShape(CLOSE);
    pop();

}

function drawEpicloid8() {
// same curve as drawEpicloid7 but moves in opposite direction according to mouse X
push();
    translate( width/2-100, height/2+100);
    var x;
    var y;

    var a = 20;; // radius of smaller circle
    var b = a * 3;  // radius
    var theta = 30;
    var move = mouseX/50
    fill(200, 210, 0,50); //transparent yellow
    beginShape();
    for (var i = 0; i < 100; i ++) {
        var theta = map ( i , 0, 100, 0, TWO_PI);
        x = (a + b) * cos(-theta) - b * cos (-theta * (a + b) /b * move);  // mathematical formula for the curve
        y = (a + b) * sin (-theta) - b * sin (-theta * (a + b) /b * move);
        vertex(x,y);
    }
    endShape(CLOSE);
    pop();
}
Looking Outwards 07: Information Visualization
Creator’s name: Stamen
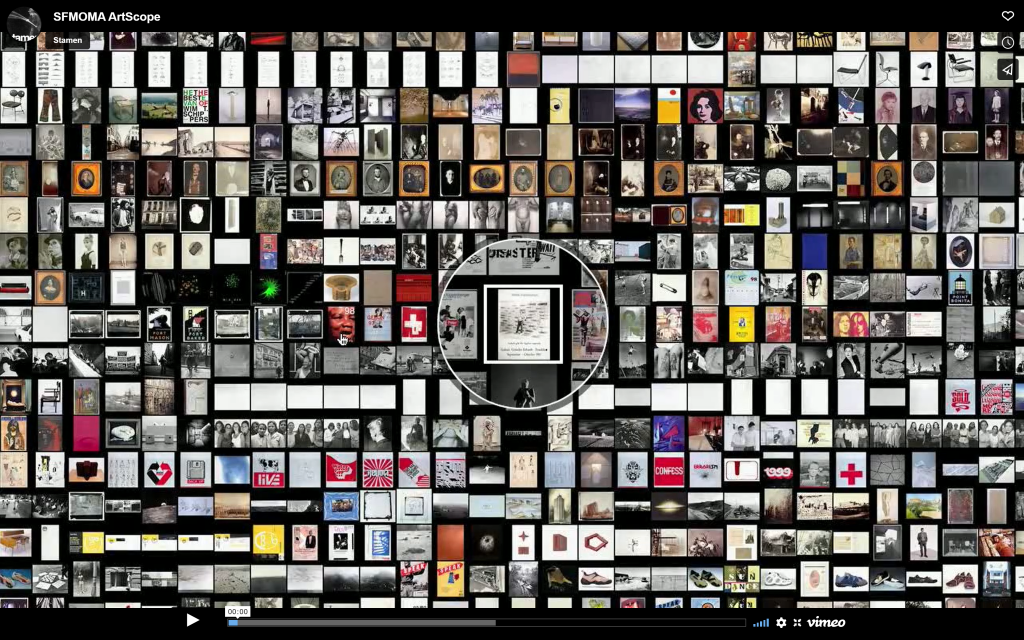
Title of work: SFMoMA Artscope
Year of Creation: 2020
This project by Stamen is an interesting take on a museum map. It maps everything in the San Francisco Museum of Modern Art’s collection through images of the displays that are currently in the museum. Using an interactive mapping technology known as “Modest Maps ”, this software creates a virtual environment where individuals can zoom and pan through artworks that are arranged depending on when and where they were bought to be displayed in the museum. I find this design to be quite a unique way of displaying information organized chronologically. As opposed to a website where the user scrolls down, this format instead creates a much more interactive and easy-to-understand approach. I would assume that the algorithm used to generate this work involves arrays that organize the works by date of purchase. In addition, I would assume that there is another array that considers where the artworks were bought since there must be a way to store such a large amount of information in order to organize it. The designer’s artistic sensibilities are present in this work since it complements their other work to create a cohesive style and approach to visual communication. This style is even present in the design of the website itself.
https://stamen.com/work/sfmoma-artscope/
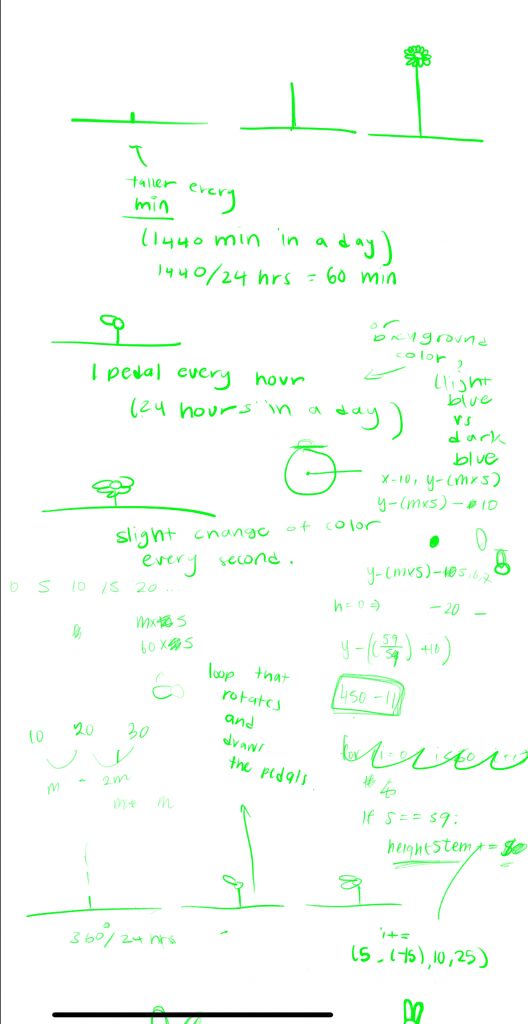
Project 06 – Abstract Clock
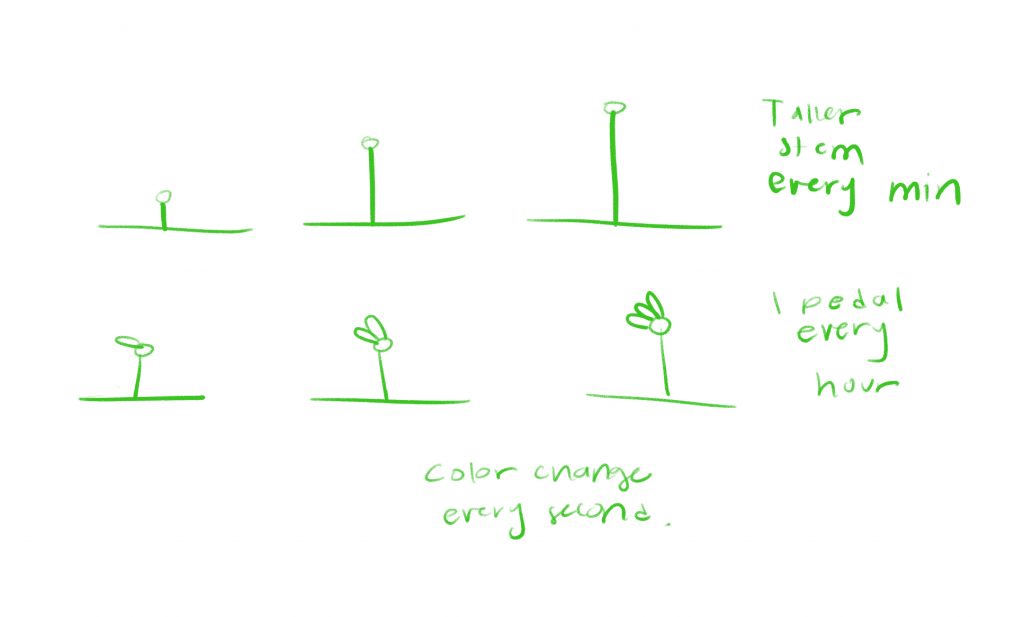
For this project, I thought about the growth of plants as a representation of time. However, I decided to combine that concept by creating a method where by looking at the image, one can know in a more literal sense what time of day it is while still being an abstract representation.
The stem grows a little longer each minute and refreshes from the bottom once it reaches 59. This allows the viewer to know what minute of the hour it is. The number o pedals is representative of the hour and the shade change of the pedals represents the seconds. The background also changes from night to day depending on the typical times when the sun and moon are out.
clock sketch
// Sandy Youssef
// syoussef@andrew.cmu.edu
// section D
//Assignment 6
var x;
var y;

function setup() {
    createCanvas(400, 480);


}

function draw() {
    x = width/2;
    y = 450;


    // draw sun or moon depending on time of day where sun or moon are typically out
    var h = hour(); // current hour of day 0-23

    if ( h > 6 & h < 17) {
        background(205,236,255);
        //sun
        fill("yellow");
        ellipse(70, 70, 70);

    } else  {
        background(32,58,131);
        // draw moon
        fill("white")
        ellipse(330,70,70);
        fill(32,58,131);
        ellipse(310, 70,70);

    }
    //clouds
    var xc = 100; // x cloud
    var xy = 100; // y cloud

    fill("white");
    //left cloud
    ellipse(xc + 25, xy +15, 50,25);
    ellipse(xc+ 55, xy + 35, 50,33);
    ellipse( xc, xy + 35, 60, 40);
    ellipse(xc +35, xy + 37, 50, 50);
    //right cloud
    push();
    translate(190,90);
    ellipse(xc + 25, xy +15, 50,25);
    ellipse(xc+ 55, xy + 35, 50,33);
    ellipse( xc, xy + 35, 60, 40);
    ellipse(xc +35, xy + 37, 50, 50);
    pop();

    //dirt
    noStroke();
    fill("brown");
    rect(0, 460, width, height);


    //stem
    var m = minute(); // current minute in hour 0-59
    fill(74,115,69);
    rect(x-10,y-10- (m *5), 5, 300); // every minute the stem will grow and once it reaches 59 it will start over.


    var s = second(); // current seconds 0-59
    var h = hour(); // current hour of day 0-23
    for (var i = 0; i < h; i ++) { // loop that creates a new pedal at each hour to count hour
        push();
        translate(x-10 +3, y-10- (m*5)); // translates pedals to the center of flower
        rotate(radians(360/24)*i);
        stroke("yellow")
        strokeWeight(1);
        // count seconds by changing shade of pedals at each second
        if (s %2) { // if second is odd make light pink
           fill(227,180,242);
        } else {
            fill(225,154,246); // if second is even make dark pink
        }
        ellipse(5 , (-15), 10, 25);
        pop();

    }


    // center of flower
    fill(243,255,131); // yellow
    ellipse(x-10 + 3 , y-10- (m *5) , 20);


    // grass
    for (var x = 1; x < width; x = x+ 4) {
        fill(0,240,0);
        triangle(x,480, x+ 5 , 480, x +2.5, 440);
    }


}
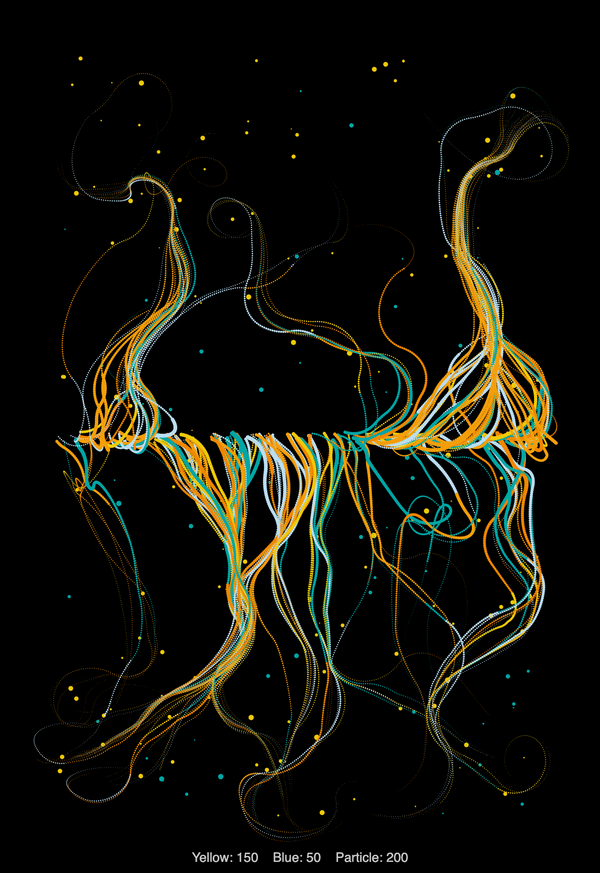
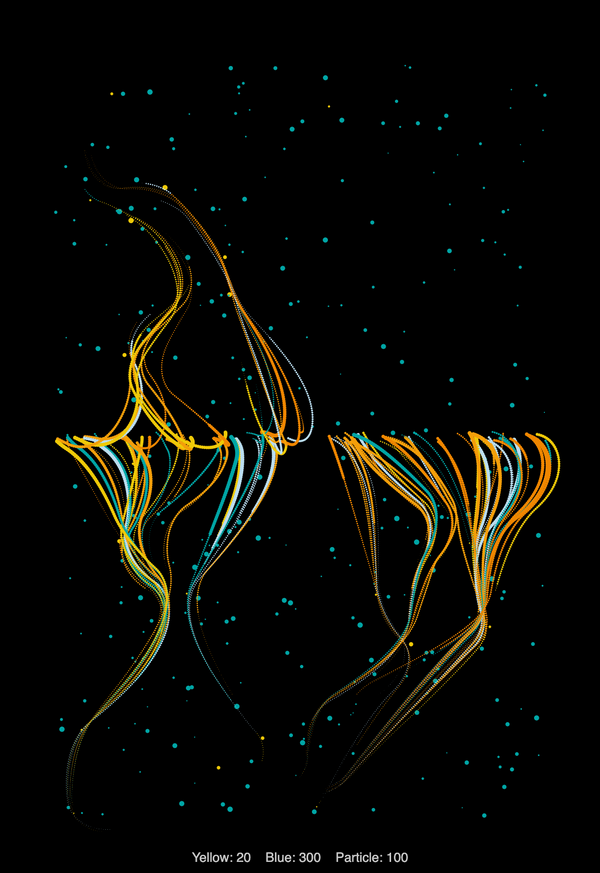
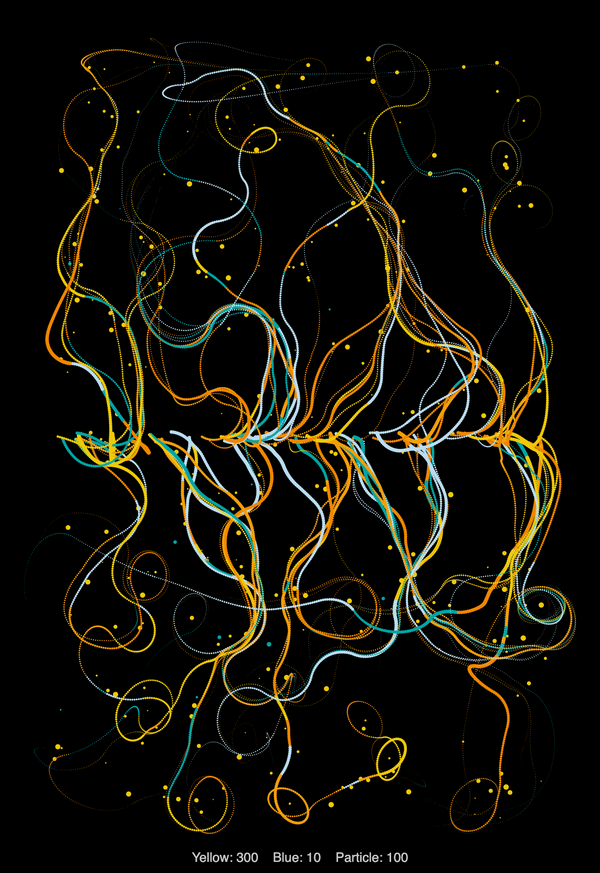
Looking Outwards 06: Randomness
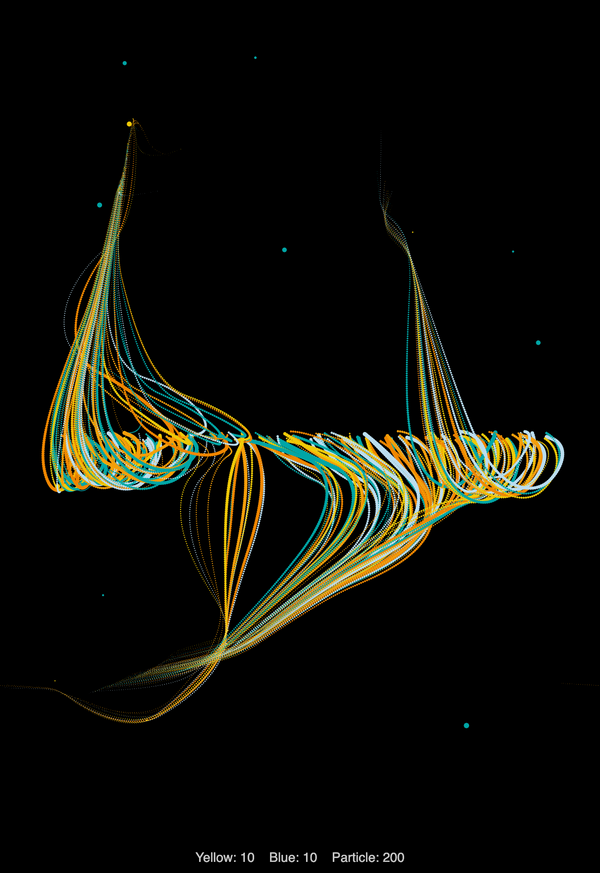
Creator’s name: Wenran Zhao
Title of work: Random waLK & particles, vehicles system
Year of Creation: Unknown
This series of artwork uses randomness to create captivating variations of protrusions that resemble squid tentacles. I love the motion depicted in these pieces and the water-like and fluid quality that they have. The computation relies on wavy lines that extrude from a center-horizontal line of the canvas made up of random strings of yellow and blue as well as a circle spread across the canvas. I highly doubt that these works are generated in a “truly” random sense since it is much more likely that a sequence with certain bounds is used to generate these variations. I believe it is so as a result of the loose observable pattern or similar quality from one piece to the other. The artist’s artistic sensibilities portray a very fun and playful essence.
Project 5: Wallpaper
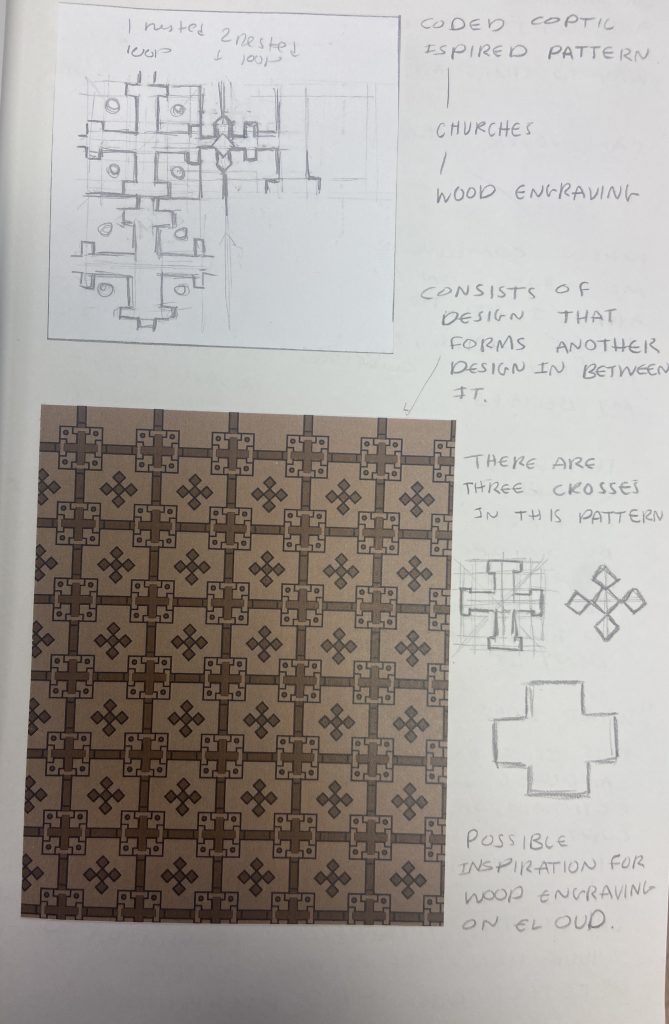
I was inspired to design a Coptic-inspired pattern for this project. I am Coptic Orthodox Christian. Coptic means Egyptian and our art and our churches are filled with beautiful wooden engravings. I wanted to design a pattern inspired by these wooden engravings and see what I could learn about how they are created. I realized that Coptic patterns consist of one design that when placed next to itself creates another design. This pattern forms three different crosses!
Coptic wallpaper sketch
// Sandy Youssef;
//section D;
//syoussef@andrew.cmu.edu;
//Project-05;
function setup() {
    createCanvas(500, 600);
    background(156, 121, 90);

}

function draw() {
    crossOne(0, 0); // calling the function
    // loop to create crossOne pattern, since crossOne calls crossTwo, they are linked
    for (var y = 1; y <= height; y += 90) {
        for (var x = 1; x <= width; x += 90){
           crossOne(x-1, y-1);
    }
    }


}
function crossOne (x, y) {
    push();
    translate(x,y);
    fill(156, 121, 90);
    stroke(5);
    var x = 50;
    var y = 29;
    push();
    rectMode (CENTER);
    rect(50, 50, 50, 50);
    rect(x, y, 20, 8)
    // left rect
    pop();
    push();
    translate(33,40);
    rotate(radians(90));
    rect(0, 0, 20, 8);
    // right rect
    pop();
    push();
    translate(75,40);
    rotate(radians(90));
    rect(0, 0, 20, 8);
    //bottom rect
    pop();
    push();
    translate(40,67);
    rect(0, 0, 20, 8)
    pop();
    // top pointy rect
    fill(115,75,42); //HEREEEEE
    noStroke();
    rect(45, 20, 10, 6);
    stroke(5);
    line(45, 20, 45, 25);
    line(55, 20, 55, 25);
    // left pointy rect
    push();
    translate (45, 0);
    rotate(radians(90));
    noStroke();
    rect(45, 19, 10, 6);
    stroke(5);
    line(45, 20, 45, 25);
    line(55, 20, 55, 25);
    pop();
    // right pointy rect
    push();
    translate (100, 0);
    rotate(radians(90));
    noStroke();
    rect(45, 20, 10, 6);
    stroke(5);
    line(45, 20, 45, 25);
    line(55, 20, 55, 25);
    pop();
    // bottom pointy rect
     push();
    translate (0, 54.3);
    noStroke();
    rect(45, 20, 10, 6);
    stroke(5);
    line(45, 20, 45, 25);
    line(55, 20, 55, 25);
    pop();
    // vertical bottom line in center
    push();
    translate(0,0);
    stroke(5);
    line(45,34, 45, 67);
    line(55, 34, 55, 67);
    pop();
    // horiz line in center
    line(33,45, 67, 45);
    line(33, 55, 67, 55);
    // same color rectangles to hide lines in center
    push();
    noStroke();
    rect(30,45, 40,9);
    rotate(radians(90));
    rect(30,35, 40,9);
    pop();

    // little circles
    fill(115,75,42);
    push();
    stroke(5);
    translate(25,25);
    ellipse(7,7, 5);
    translate(35,35);
    ellipse(7,7,5);
    pop();
    push();
    stroke(5);
    translate (60,25);
    ellipse(7,7,5);
    pop();
    push();
    stroke(5);
    translate(25, 60);
    ellipse(7,7,5);
    crossTwo (0,0); // calling crossTwo function
    pop();
    pop();

function crossTwo (x2, y2) {
    rectMode(CENTER);
    //noStroke();
    fill(115,75,42);
    rect(25, 35, 10, 30); // vertical bottom connection
    push();
    translate (x-50,y-119); // vertical top connection
    rect(25, 35, 10, 30);
    pop();
    push();
    translate(15, -35);
    rotate(radians(90)); // horizontal connectinon
    rect(25, 35, 10, 30);
    pop();
    // diamond cross in center
    push();
    stroke(5);
    rotate(radians(45));
    rect(13,40, 10,10);
    translate(10,10);
    rect(13,40, 10,10); // bottom
    translate(-20,-20);
    rect(13,40, 10,10); // top
    translate(0,20); // left
    rect(13,40, 10,10);
    translate(20, -20);
    rect(13,40, 10,10);
    pop();

}

}
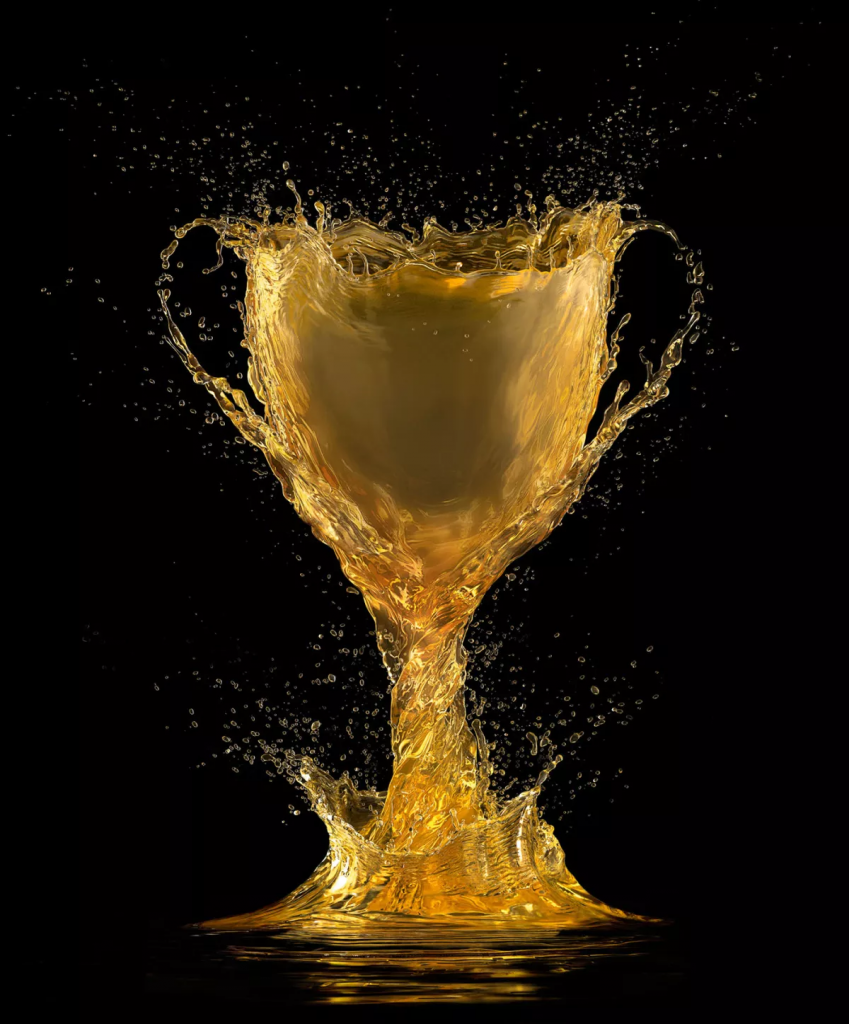
Looking Outwards 05: 3D Computer Graphics
Creator’s Name: Together Design UK
Title of Work: “Make your own cider:
Year of Creation: unknown
This project is an incredible example of 3D Computer Graphics applied in graphic design. This graphic is extremely intriguing to look at. The motion portrayed in this still image makes it very visually interesting and it looks like the liquid created a splash that is shaped like a wine glass. This graphic serves the purpose of promoting a “make your own cider” brand and it is done quite well. I believe these types of graphics are created with a type of 3d rendering program and that program is designed using algorithms to achieve this purpose. I am not exactly sure of the exact algorithms, but that is my guess. It is apparent that the creator’s purpose is to communicate a certain message about the brand and I think the company did a good job.