Looking Outwards 07

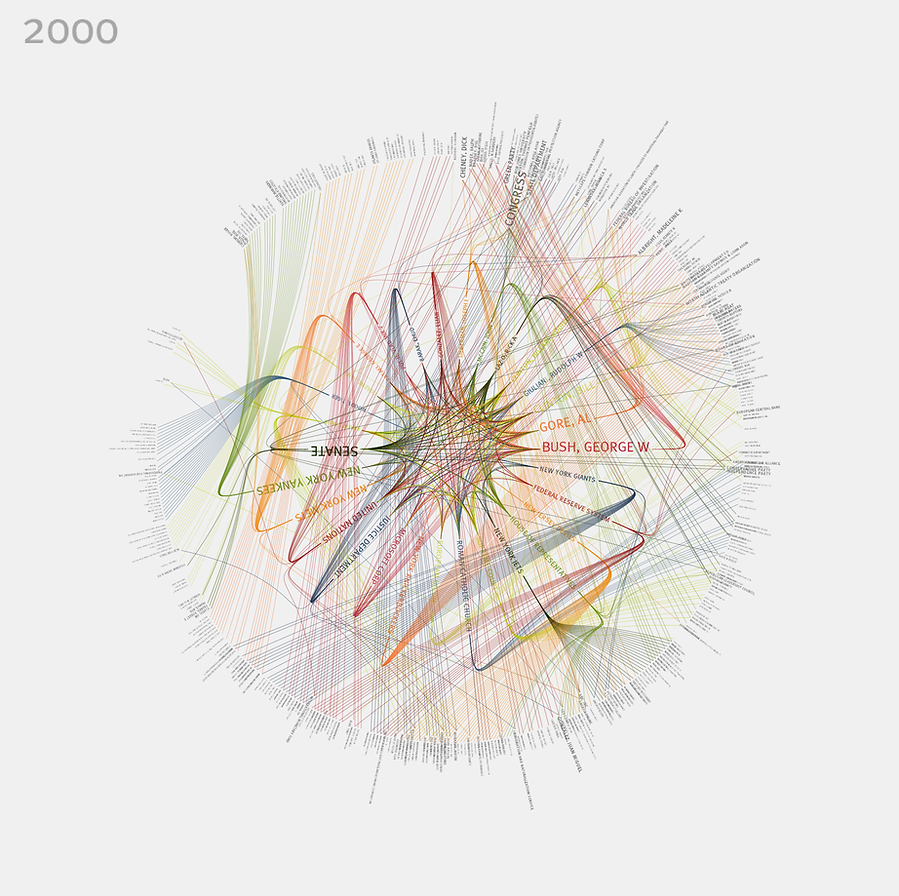
The work I selected is 365/360 by Jer Thorp . The work is a visualization that shows the top organizations and personalities every year from 1985 to 2001. The work was created for the New York Times and links people, organizations and events. I selected this work because I was interested in the way Thorp used color and font size as a form of connection in addition to simply lines of connection. This makes the representation of data feel quite dynamic and life like. The piece of work is also circular which shows just how interconnected seemingly different topics are. The work also gives us a sense of Thorp’s sensibilities when it comes to representation and color and font use.

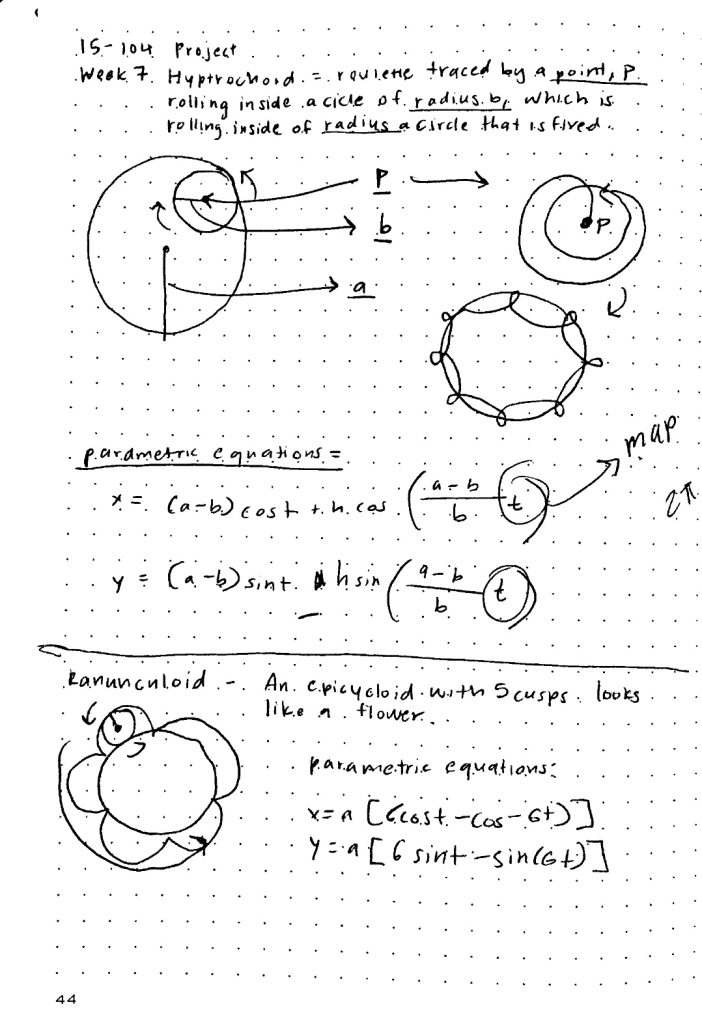
Project 7 Curves – Flower Blossom

sketch
//SRISHTY BHAVSAR
//15-104 SECTION C
//PROJECT 7

var nPoints = 500;

function setup() {
    createCanvas(400, 400);

}


function draw() {
    createCanvas(480, 480);
    background(0);
    // draw the curve

    fill(154,205,40,70); // yellow green color
    ranunculoid(10,20);
    hypotro();
    noFill();
    ranunculoid(30,50);
    ranunculoid(40,60);


}

//--------------------------------------------------
function hypotro() {
    // Hypotrochoid
    // https://mathworld.wolfram.com/Hypotrochoid.html
    
    push();
    noFill();
    stroke('magenta');
    strokeWeight(1);
    translate(width/2 , height/2);
    var x = constrain(mouseX, 0, width);
    var y = constrain(mouseY, 0, height);
    var a = map(x, 0, width, 60, 160); //radius of still circle
    var b = map(y, 0, height, 1, 8); // radius b of rolling circle inside still circle
    var h = constrain(a/2, 100, 100); //
    beginShape();
    for (var i = 0; i < nPoints; i++) {
        var t = map( i, 0, nPoints, 0, TWO_PI); // tangent?
        //PARAMETRIC EQUATIONS
        x = (a - b) * cos(t) + (h * cos(((a-b)/b)*t)); 
        y = (a - b) * sin(t) - (h * sin(((a-b)/b)*t));
        vertex(x,y); // connected to center vertex

    }
    endShape();
    pop();
}

//--------------------------------------------------

function ranunculoid(xsize,ysize) {
    // https://mathworld.wolfram.com/Ranunculoid.html
    push();
    stroke('green');
    strokeWeight(1);
    translate(width/2 , height/2);  
    var x = constrain(mouseX, 0, width);
    var y = constrain(mouseY, 0, height);
    var a = map(mouseX, 0, width, xsize, ysize); 
    beginShape();
    for (var i = 0; i < nPoints/10; i++) {
        var t = map(i, 0, nPoints/10, 0, TWO_PI);

        x = a * (( 6 * cos(t)) - cos(6*t))
        y = a * (( 6 * sin(t)) - sin(6*t))
        vertex(x, y);
    }
    endShape();
    pop();
}

equations

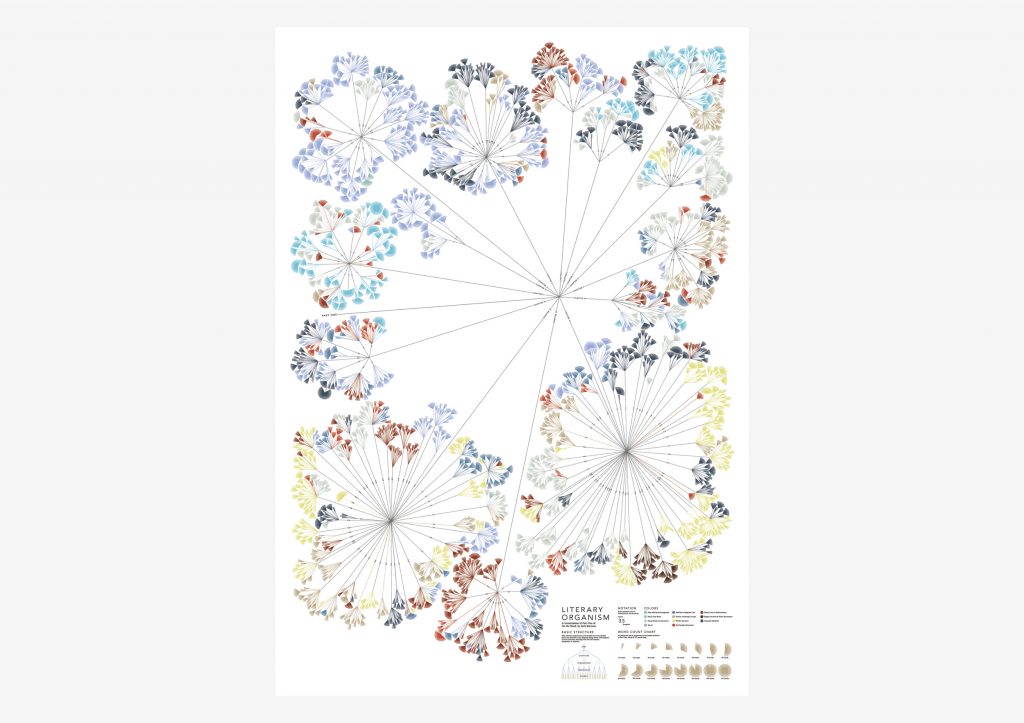
Looking Outwards 7: Information Visualization – Stefanie Posavec

Writing Without Words

Drawing The Dictionary

Stefanie Posavec is an artist and designer experimenting and researching ways to visualize and communicate computational data to all ages and audiences. What I like and find most special about Stefanie’s work is that it is very colorful, fun, and visually appealing. Usually when I think of computational data, I don’t necessarily imagine something animated, cartoon-like, or age friendly. Stefanie’s visualizations deliver themselves like artwork in a children’s book.
In her work, “Drawing the Dictionary,” Stefanie responds to a theme of collections including parts of speech, syllables, first letter of the words, and alphabet. The words in the collection are specifically the 1000 most frequently used words. And used 1000 different colored index cards for each word. The words paper colors were organized by part of speech, background shape by syllables, placement by how frequently they are used, pattern by part of speech, and the pen color by first letter in word.
In her work, “Writing without words,” Stefanie visually showcased text in order to highlight the similarities and differences in writing styles when comparing different authors. She wanted to create a data visualization that was straight forward and one with a subject that was emotionally connecting to humans. To create this, she focused on a book called “On the Road,” by Jack Kerouac and its themes. She did not want to use expressive typography or imagery but rather a subjective representation of information. She wanted the graphics to be quantifiable. She gathered data related to the english language structure.She wanted to visualize the novel as a living element full of energy and thus the novel is split into chapters, paragraphs, sentences, and words like a plant structure. Shorter sentences mean a choppy text and stiff writing style while longer sentences mean they are more free and leisurely. She gathered all data by hand and used math and a calculator to find final sums. Finally she used a computer graphics program instead of a data information one to watch the data generate bit by bit.

Sources:

http://www.stefanieposavec.com/work

LO-06 Randomness

Random generation in music/synthesis has always confused me a bit, because part of the point of music (at least, what Western music theory says), is that music wants to fit into a pattern that is pleasing for the human ear, and that’s how tunes get stuck in our head and how we end up attached to a certain song. Randomness doesn’t often lean in the acoustically pleasing direction, because our ears are so attuned to patterns and tones. Even someone with little musical training or ability can guess if a note is incorrect, and will often have a visceral reaction to a wrong note played in a familiar melody. I was intrigued by this tutorial because it showed how to use randomness along with other elements within the Ableton software (confining notes to a certain scale, randomizing the note value within a number of choices, etc) to create something that, however randomly generated, still sounds pleasing to our ear.

P-06 Abstract Clock

sketch
// Bridget Doherty
// bpdohert@andrew.cmu.edu 
// 104 Section C


function setup() {
    createCanvas(480, 480);
    frameRate(5);
    angleMode(DEGREES);
}

function draw() {
    background(0); // black background
    translate(width/2, height/2); // center-based coordinates

    let s = second();
    let m = minute();
    let h = hour();

    drawStars(h);
    drawEarth(s);
    drawSun(h);
    
}

function drawSun(h){
    if (h == 0) { // eclipse every night from 00:00 - 00:59
        fill('black');
        strokeWeight(2);
        stroke('white');
        circle(0, 0, 100);
    } else {
        fill('yellow'); // the sun!
        noStroke();
        circle(0, 0, 100);
    }
}

function drawEarth(s){ // the earth completes a rotation every minute
    noStroke(); // and moves every second
    push();
    rotate(s*6);
    fill('blue');
    circle(150, 0, 70);

    // triangles to approximate land on earth 
    fill('green');
    triangle(170, 0, 120, 0, 150, 20);
    triangle(170, 10, 130, 10, 120, 20);
    triangle(175, -10, 130, -20, 120, 10);

    // ellipse to approximate Antarctica
    fill(220);
    ellipse(150, -30, 30, 10);
    pop();
}

function drawStars(h){ // the amount of stars increases every hour
    for (var i = 0; i<(h*10); i++){ // there are no stars between 00:00 and 00:59
        stroke('white');
        point(random(-width/2,width/2), random(-width/2, width/2));
    }
}

This is obviously based on Earth’s rotation around the sun, but condensed so it makes one revolution every minute. The number of stars increase with every hour passed. Every night from 00:00-00:59 there is a solar eclipse which is so naturally impossible with how I’ve set up the scene but looks cool nonetheless.

06-Looking Outward

The piece I selected is the song/composition named Hausmusik by Harmonia. The piece is made up of seemingly random notes and sounds. We hear the randomness most in the variation of tempos in the piece. The ever changing tempo feels quite random and haphazard. I do not know anything about the process of writing the piece or if there was an algorithm used or not but it seems like there was an effort made to make the piece feel generative as opposed to highly planned and choreographed. I quite admire this as it in a way makes electronic music feel much more natural. Electronic music has a tendency to feel cold and often sharp and this piece in contrast feels sort of warm because of the way it randomly undulates. If I am speculating on the artist’s intention when creating this work, I assume that he intended for the piece to feel quite generative.

Project 05 – Wallpaper

I wanted to make a wallpaper that looked like a stitched flower quilt pattern.

sketch

//SRISHTY BHAVSAR
//15-104 PROJECT 05 
//SECTION C


// COLORS
var w = 255 // white
var lbrown = (196, 164, 132); // light brown

// lengths

var s = 50 //sqare


function setup() {
    createCanvas(200, 20);
    background(194,197,201);
    text("p5.js vers 0.9.0 test.", 10, 15);
}

function draw() {
    createCanvas(600,600);
    background(194,197,201); //light blue


    // RED DIAMOND LOOP
    push();
    translate(300,-300);
    rotate(radians(45)); // rotates squares to be diamonds
    for( var x = 0; x < 1200; x+= s/2) {
        for( var y = 0; y < 1200; y+= s/2){
            reddiamonds(x,y);
        } 
    }

    // FLOWER DIAMOND LOOP
    pop();
    push();
    translate(265,-300);
    rotate(radians(45));
    noFill();
    for( var i = 0; i < 2000; i+= s) {
        for( var j = 0; j < 2000; j+=s) {
            flowerdiamonds(i,j);
            //square(i,j,s);
        } 
    }

    pop();

}

function reddiamonds(x,y) {
    translate(x,y); // origin moves along row
    push();
    stroke(183, 113, 121, 70); // light red
    strokeWeight(2);
    noFill();
    square(x,y,50);
    pop();
    translate(-x,-y); // origin moves along row
}

function flowerdiamonds(i,j) {
    // lacy white dot rim of elipses that trace the diamond
    noFill();
    stroke(w);
    strokeWeight(1);
    translate(i,j);
    // create 4 lacy rims that create a square
    push();
    for (var x = 0; x < 60; x +=10) {
        for(var y = 0; y <10; y += 10) {
            ellipse(x,y, 6, 4);
        }
    }
    rotate(radians(90));
    for (var x = 0; x < 60; x +=10) {
        for(var y = 0; y <10; y += 10) {
            ellipse(x,y, 6, 4);
        }
    }

    translate(0, -50);
    for (var x = 0; x < 60; x +=10) {
        for(var y = 0; y <10; y += 10) {
            ellipse(x,y, 6, 4);
        }
    }
    translate(50,50);
    rotate(radians(-90));
    for (var x = 0; x < 60; x +=10) {
        for(var y = 0; y <10; y += 10) {
            ellipse(x,y, 6, 4);
        }
    }

    pop();

    //FLOWER STEM
    push()
    translate(-4,-30);
    rotate(radians(-40))
    noFill();
    stroke(w);
    strokeWeight(1)
    curve(6, 30, 59, 50, 60, 80, 40, 40);
    pop()


    //FLOWER PETALS
    push()
    strokeWeight(1);
    fill(196, 164, 132); // dark blue
    translate(6,6);
    ellipse(10,18,13,9);
    rotate(radians(72));
    translate(6,-30);
    ellipse(10,18,13,9);
    translate(-1,-67);
    rotate(radians(72));
    ellipse(10,18,13,9);
    rotate(radians(72));
    translate(-23,-71);
    ellipse(10,18,13,9);
    rotate(radians(72));
    translate(-8,-77);
    ellipse(10,18,13,9);
    pop()
    translate(-i,-j);

}
P-05 Wallpaper

Took inspiration from a tile pattern for this project.

sketch
// Bridget Doherty, bpdohert, 104 Section C


// global color variables
var greyValue = 150;
var bckg = 240;
var lineCol = 0;

function setup() {
    createCanvas(550, 380);
    background(bckg);
}

function draw() {
    for (var i=50; i<=height; i+=93) {
        for (var j=50; j<=width; j+=93){
            clover(j, i);
        }
    }
    for (var i=3; i<=width+50; i+=93){
        for (var j=3; j<=height+50; j+=93){
            innerCircle(i, j);
        } 
    }
    noLoop();
}

function clover(x, y){
    var diam1 = 40;
    var diam2 = 31;
    var spacer = 26;

    // clover outer grey section
    strokeWeight(1);
    stroke(lineCol);
    fill(greyValue);
    circle(x, y-spacer, diam1);
    circle(x, y+spacer, diam1);
    circle(x-spacer, y, diam1);
    circle(x+spacer, y, diam1);

    // clover inner white section
    fill(bckg);
    circle(x, y-spacer, diam2);
    circle(x, y+spacer, diam2);
    circle(x-spacer, y, diam2);
    circle(x+spacer, y, diam2);
    noStroke();
    circle(x, y, 41);

    // petals outline
    stroke(lineCol);
    strokeWeight(7);
    line(x-15, y-7, x-7, y-15);
    line(x+15, y-7, x+7, y-15);
    line(x-15, y+7, x-7, y+15);
    line(x+7, y+15, x+15, y+7);

    // lines to complete the clover inner points
    stroke(greyValue);
    strokeWeight(8);
    line(x-12, y-12, x-15, y-15);
    line(x+12, y-12, x+15, y-15);
    line(x-12, y+12, x-15, y+15);
    line(x+12, y+12, x+15, y+15);

    // circles outline
    noStroke();
    fill(lineCol);
    circle(x-7, y-7, 12);
    circle(x+7, y-7, 12);
    circle(x-7, y+7, 12);
    circle(x+7, y+7, 12);

    // grey petals inside clover
    stroke(greyValue);
    strokeWeight(4);
    line(x-15, y-7, x-7, y-15);
    line(x+15, y-7, x+7, y-15);
    line(x-15, y+7, x-7, y+15);
    line(x+7, y+15, x+15, y+7);

    strokeWeight(1);
    fill(greyValue);
    circle(x-7, y-7, 8);
    circle(x+7, y-7, 8);
    circle(x-7, y+7, 8);
    circle(x+7, y+7, 8);
    
}

function innerCircle(x,y){
    var cross = 6;

    // circles in between the clovers
    strokeWeight(1);
    stroke(lineCol);
    fill(greyValue);
    circle(x, y, 61);
    fill(bckg);
    circle(x, y, 50);

    // plus sign in the middle of the circles
    strokeWeight(7);
    stroke(lineCol);
    line(x+cross, y, x-cross, y);
    line(x, y-cross, x, y+cross);
    strokeWeight(4);
    stroke(greyValue);
    line(x+cross, y, x-cross, y);
    line(x, y-cross, x, y+cross);
}

LO-05

I’ve always been a little obsessed with the MIT Media Lab and how they manage to make a circle out of the venn diagram that is ‘things I like’ and ‘things you can learn.’ This article is written by a student in the process of using javascript as a CAD replacement. They start out with the statement that ‘a design is just a bunch of numbers’ which I find particularly interesting, even if I don’t always agree with it. I’ve always been more drawn to code that produces an output that I can physically sense, not just on a computer screen. Code makes a lot more sense to me when I can hear what it’s doing, or if it interfaces with microcontrollers and physical circuits. But seeing these examples of javascript directly correlating to CAD drawings, 3D prints, or similar physical outcomes inspires me to see what else is possible with this language, especially in 3 dimensions. I know how to “bit bang” 3D models to a certain extent, but automating & scripting them would certainly improve a workflow and allow for further experimentation and innovation.

https://www.media.mit.edu/projects/from-cad-to-jad-javascript-aided-design/overview/

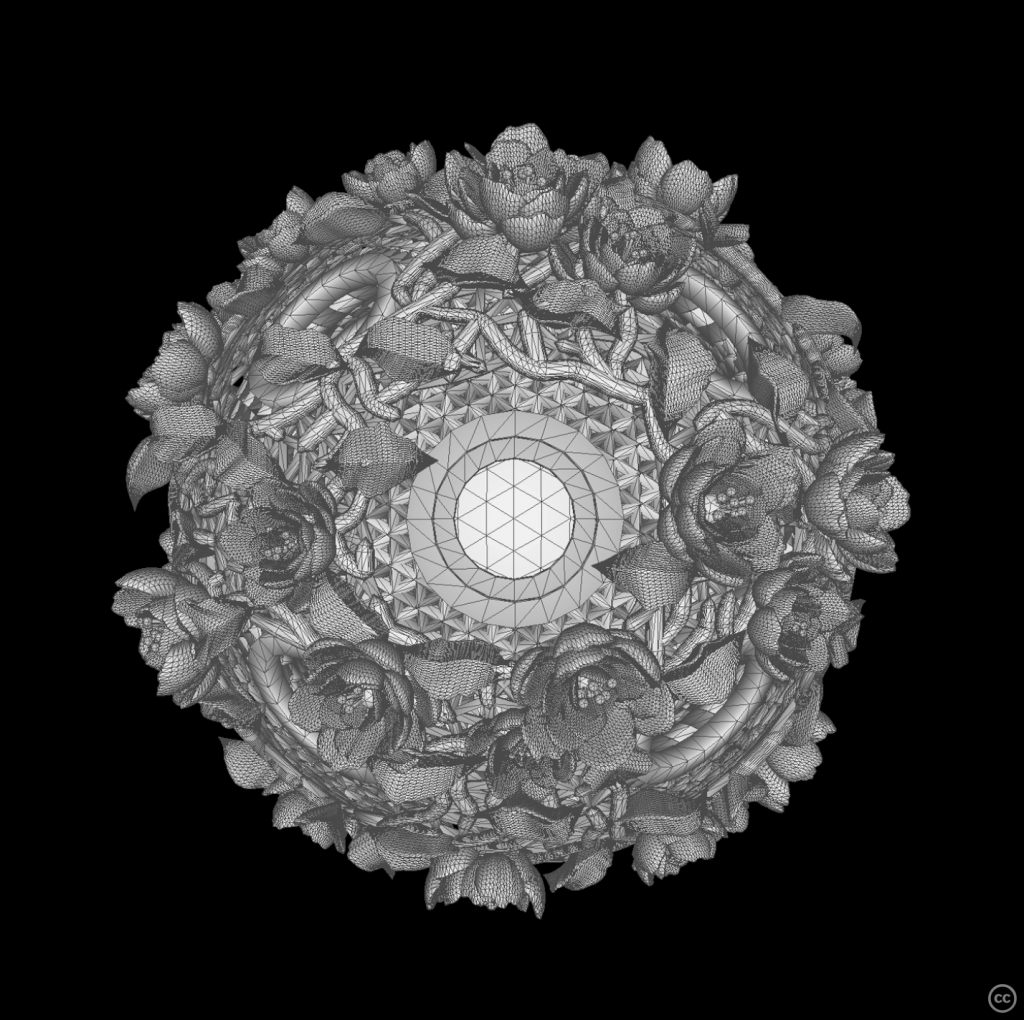
LookingOutwards – 05 Thanos’s Creation. 3D Computer Graphics in Marvel.

Thanos, Created by Studio: Digital Domain

Over the last 12 years of MCU movies being created, Marvel worked with many VFX studios such as Weta Digital, Framestore, and industrial light and magic. Almost every 3D Computer Graphics was used in the films. They used Maya, 3ds Max Modo, in addition to Zbrush and Mudbox for sculpting. To create textured painting works, Mari and Substance Painter. Nuke is used with after effects for compositing 3D projections. 

To create Thanos, Digital Domain worked with Marvel Studios to create effects shots using Masquerade. 513 shots were created by over 340 Digital Domain artists. Masquerade is a facial capture application that is based on computer machine learning algorithms. The system was worked on for 3 to 4 months before filming to develop and test. Masquerade has the ability to capture a high resolution image of an actor’s face at a rate of 40-50 frames per second. 

The actor Josh Brolin who played Thanos. For Digital Domain, it was important for Thanos’s movements to be very organic and realistic. Thus, Mocap cameras were used. The actor Josh wore a Mocap suit and helmet with cameras that had motion capture dots to capture his movements. Digital Domain’s factual capture identified the smallest details such as wrinkles and curvatures of Josh’s face. From here, the animation team could enhance features of the face like eyes, until Josh’s face was transformed into Thanos’s purple face.

This project and artwork interests me because I had no idea that so many programs and machine learning algorithms are used in movies that contain real humans to create fake characters. Rather than going through the struggle of using prosthetics or other costumes to create a villain like Thanos, they were able to create an animated character that can be then utilized throughout the film.

Sources:

https://digitaldomain.com/case-studies/avengers-infinity-war/

https://inspirationtuts.com/what-3d-software-does-marvel-use/