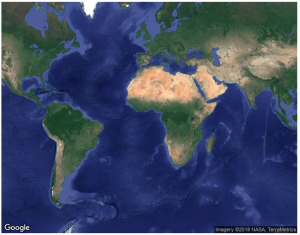
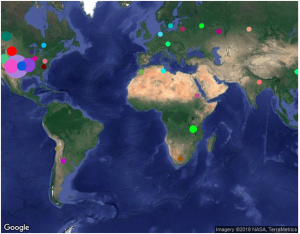
I worked with Mappa.js to visualize a dataset on Google Maps. I found Mappa.js useful for quickly getting interactive online maps running. I tweaked one of the example code so that the objects get updated by the user’s mouse click.
I used NASA’s open data portal and took the meteorite dataset as input. Each row is the history of meteorite landings with latitude/longitude information. Every time the user clicks, it reads the new row and visualizes on Google Maps where it landed. It calls Google Maps API to map latitude/longitude to a city and creates an object for each city. If data with the previously appeared city is observed, it increments the size of the circle. Since there are cases where the city is not included in the API response, I used try/catch to ignore unidentifiable data.

