Assignment 6: Mouse motion based on wire protocol

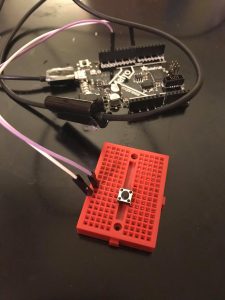
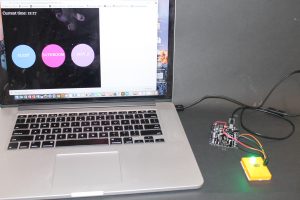
Move an object based on accelerometer movement. I used an ADXL362 and the wire protocol to move an object on the screen. The accelerometer sends the raw XYZ values and a state of a button, the P5Js scripts map the raw acceleration values to areas on the screen.

Todo: Need to update the p5js script and improve documentation and add photos.

A6_v0


Assignment6 – spatial sensor viz experiment

This is a preliminary experiment for my project which aims to visualize sensor network data of a room/building in three dimensions. For this first test, I took temperature data through I2C and visualized particles on Unity that changes the alpha of color depending on the sensor readings. The demo is a bit unintuitive since only a single sensor is being used,  but the intention is to take temperature data from each part of a room, manually map the reading location on Unity, and visualize for the entire room.

Assign6-Code

Assignment 6

For this assignment, I decided to do another iteration of my assignment 4 light project using Neopixel.

I used the same basic GUI with three settings: Sleep, Bathroom, and Movie. The sleep mode is a green light, the bathroom mode is a red light, and the movie mode is a blue light.

I only got one neopixel to work so far because of some arduino issues / my original neopixel was broken.


Future work:

I want to create the full lighting system idea with neopixels. I also hope to integrate it into an interactive standing desk and make it bluetooth controlled. I also want to work on different light diffusion techniques to create a brighter light display.

Assignment6


Assignment 6: Cornflower Field

For this assignment, I wanted to create a sort of minefield using p5 that you could navigate (as a blue dot with a trail) using a gyroscope. I turned the minefield into a calming blue field of dots that don’t explode when you run over them, mostly because I was having enough difficulty creating the player and chose to ignore adding too much detail to the scene.

My main issues with this assignment arose with my serial, naturally. I tried to make a complex connection, but after spending ages attempting to make it work, I decided that maybe I needed to try making a more basic interaction and work upwards from there. I was still hopeful that my serial control issues were just due to my own oversights. So instead of trying to create a mouse using a gyro, I chose to start with getting data from a photo sensor, which I had used before, and using those numbers to drive the distance that the dot travels every time the player hits the space bar. So essentially, the game would be to be able to manipulate light and shadow on the sensor accurately to ensure that the player doesn’t run into a friendly blue flower (or mine) in their travels from one side of the screen to the other. The player would also be using their arrow keys (up and down) to determine the direction of the player.

Obviously, my problem actually didn’t lie in the complexity of my code, and my use of the photo sensor didn’t work out. Instead, I made/collaged from different random walker codes I found to create a code that would move the player at random speed intervals in quick succession. The game would be to use the up/down/side keys to navigate the board vertically. This took me a very long time to successfully create, and the result is a little disappointing, but kind of weirdly fun to play with.

Be warned, the player moves very fast, even at its slowest.

Here’s the code:

Cornflower_minefield

Assignment 6: complex I/O

Use an input or output that uses a complex serial protocol on the SDA/SLC pins, tied to a p5.js sketch.    Read a sensor and generate a useful or interesting interface in p5.js or use a p5.js interface to control a stepper or series of NeoPixel LEDs.  [Edit: The goal here was to use SDA/SCL, if you didn’t, please use it in a future project.]

Assignment 5

My plan was to use the wind turbines in the united states as my data input, and display their location on a map of the world. I was then going to have the little location dots change colors when clicked (just to get some more object programming in).

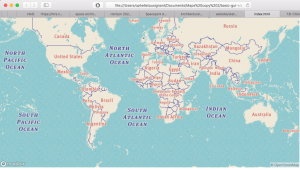
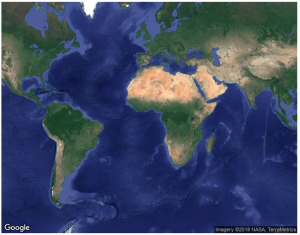
I got the map to appear:

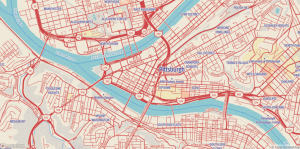
and I can zoom in and out and that’s kind of fun:

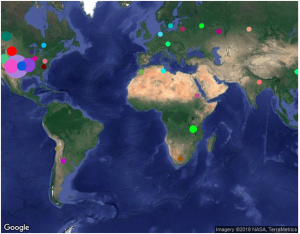
but whenever I try to load data onto the page I get this lovely display:

forever and ever.

So here’s my code.

Maps turbines

Assignment Five

Simple Shapes

For this, I wanted to investigate different Arduino inputs and how that might control elements of my objects in p5. I used two pots and two tact switches. The pots control size and spacing, while the switches can add and subtract a rectangle element. Right now there are two circles, however I’d like to work and see more ways to add an object.
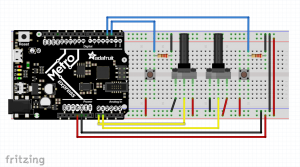
Arduino Code:
//--------NEOPIXEL SETUP --------
#include <Adafruit_NeoPixel.h>
#ifdef __AVR__
#include <avr/power.h>
#endif
static const int PIN = 40;
static const int NUMPIXELS = 1;
Adafruit_NeoPixel pixels = Adafruit_NeoPixel(NUMPIXELS, PIN, NEO_GRBW + NEO_KHZ800);


//--------POT & TACT LEFT--------
static const int potLeft = A0;
int potValLeft;
int mapValLeft;

static const int switchLeft = 2;
int switchStateLeft = 0;
int lastStateL = LOW;

//--------POT & TACT RIGHT--------
static const int potRight = A1;
int potValRight;
int mapValRight;

static const int switchRight = 3;
int switchStateRight = 0;
int lastStateR = LOW;


int count = 2;

const bool isInterrupt = true;

//--------TIME--------
unsigned long lastSampleTime = 0;
unsigned long sampleInterval = 500;

//------------------------------------------------------------------------------------

void setup() {
 // put your setup code here, to run once:
 Serial.begin(115200);

pinMode(switchLeft, INPUT);
 pinMode(potLeft, INPUT);
 pinMode(potRight, INPUT);
 pinMode(switchRight, INPUT);

pixels.begin();
}

void loop() {
 unsigned long now = millis();

potValLeft = analogRead(potLeft);
 potValRight = analogRead(potRight);

switchStateLeft = digitalRead(switchLeft);
 switchStateRight = digitalRead(switchRight);

if (lastSampleTime + sampleInterval < now) {
 lastSampleTime = now;

mapValLeft = map(potValLeft, 0, 1023, 20, 350); // sends offset
 mapValRight = map(potValRight, 0, 1023, 20, 300); // sends size

if (switchStateLeft && switchStateLeft != lastStateL) {
 if (count <= 12 && count > 2) {
 count -= 1;
 } else {
 count = 2;
 }
 } else if (switchStateRight && switchStateRight != lastStateR) {
 if (count < 12) {
 count += 1;
 } else {
 count = 12;
 }
 }
 lastStateL = switchStateLeft;
 lastStateR = switchStateRight;

Serial.print("N,");
 Serial.print(count);
 Serial.print(",O,");
 Serial.print(mapValLeft);
 Serial.print(",S,");
 Serial.print(mapValRight);
 Serial.print("\r\n");
 
 }
}

/* //-----DEBUGGING-----
 Serial.print("count: ");
 Serial.println(count);

Serial.print("Left Pot Send: ");
 Serial.println(mapValLeft);

Serial.print("Right Pot Send: ");
 Serial.println(mapValRight);
*/
p5.js Code:
/*
//-----ATTRIBUTION-----
  Based on "Sea Shell" by Michael Pinn
  https://www.openprocessing.org/sketch/402526
*/

var serial;
var portName = '/dev/cu.usbmodem1411';

var xLen = 1200;
var yLen = 700;

var bubbles;
var bubbles2;

var latestData;
var aNum = 0; // number of squares from arduino
var aOff = 0; // offset number from arduino
var aSize = 0; // size number from arduino

function setup() {
 serial = new p5.SerialPort();
 // now set a number of callback functions for SerialPort
 serial.on('list', printList);
 serial.on('connected', serverConnected);
 serial.on('open', portOpen);
 serial.on('error', serialError);
 serial.on('close', portClose);
// serial.on('data', serialEvent);
 serial.on('data', gotData);

serial.list();
 serial.open(portName);

// set up our drawing environment
 createCanvas(xLen, yLen);
 background(240);
 ellipseMode(CENTER);
 rectMode(CENTER);

bubbles = new Bubble(240,0); // sets the location
 bubbles2 = new Bubble(240,5); // sets the location

}

function draw() {
 background(240);
 bubbles.show(40,100, 8, aOff); // sets up the size, offset, rotational controller (mouse position here
 bubbles2.show(aSize/2, aOff, aNum, mouseX); // sets up the size, offset, rotational controller (mouse position here)
}


class Bubble {
 constructor (l, w){
 this.l = l;
 this.w = w;
 }

show(s, o, n, m){
 this.s = s;
 this.offset = o;
 this.n = n;
 this.m = m;

push();
 translate(width/2, height/2);
 for (var i = 0; i < 360; i += 360/this.n) {
 this.x = sin(radians(i)) * this.offset;
 this.y = cos(radians(i)) * this.offset;
 push();
 translate(this.x, this.y);
 rotate(radians(+i + this.m));
 stroke(this.l);
 strokeWeight(this.w);
 fill(sin(radians(i / 2)) * 255, 50, 100);
 rect(0,0,this.s,this.s,2);
 pop();
 }
 pop();
 }
}


//-----SERIAL FUNCTIONS-----

function printList(portList) {
 for (var i = 0; i < portList.length; i++) {
 print(i + " " + portList[i]);
 }
}

function serverConnected() {
 print('serverConnected');
}

function portOpen() {
 print('portOpen');
}

function gotData() {
 var stringRead = serial.readLine(); // read the incoming string
 trim(stringRead); // remove any trailing whitespace
 if (!stringRead) return; // if the string is empty, do no more
 // console.log(stringRead); // println the string
 latestData = stringRead; // save it for the draw method

var aString = latestData.split(",");
 if (aString.length>5)
 {
 aNum = aString[1];
 aOff = aString[3];
 aSize = aString[5];
 }
 // console.log("aNum: " + aNum + "aOff: " + aOff + "aSize: " + aSize);
}

function serialError(err) {
 print('serialError ' + err);
}

function portClose() {
 print('portClose');
}

Arduino, p5.js, Fritzing files
Sketchbook Color Sliders

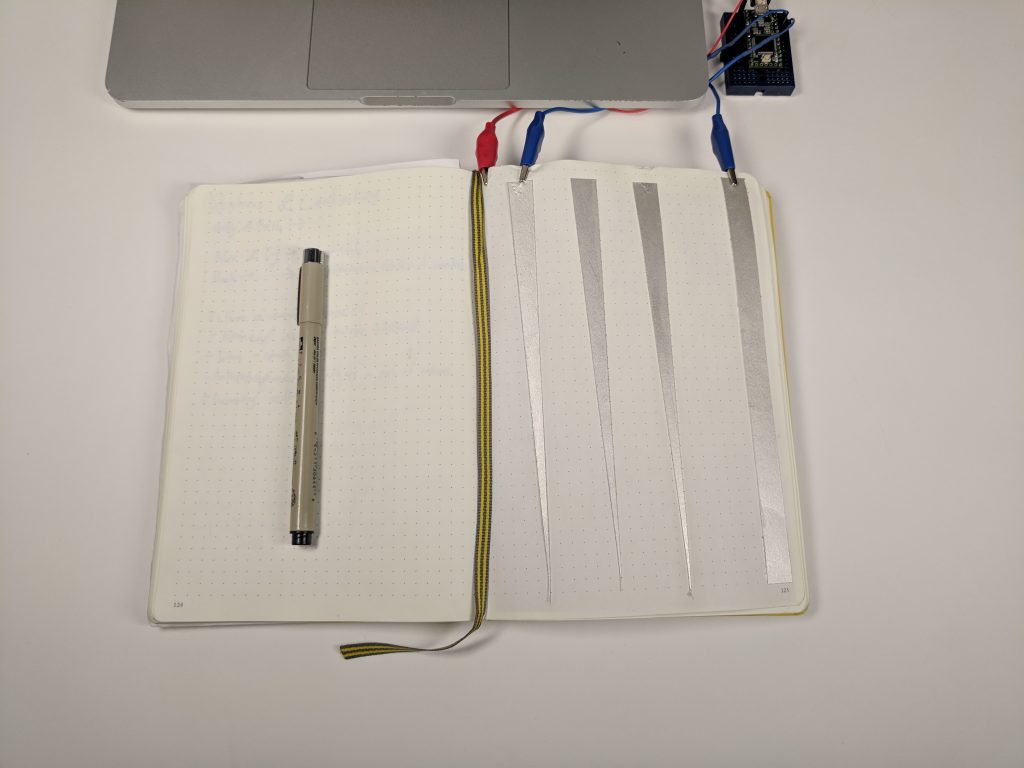
This sketch uses conductive silver ink to create capacitive sliders on paper. Three sliders can control Hue, Saturation, and Value to help a designer tactfully choose colors. The interface features a “tap in/tap out” button, so the user lifting their finger on the slider doesnt affect the color reading.


This interface is a sketch at bringing digital decisions, like RGB color,
into the physical world through tangible interaction.

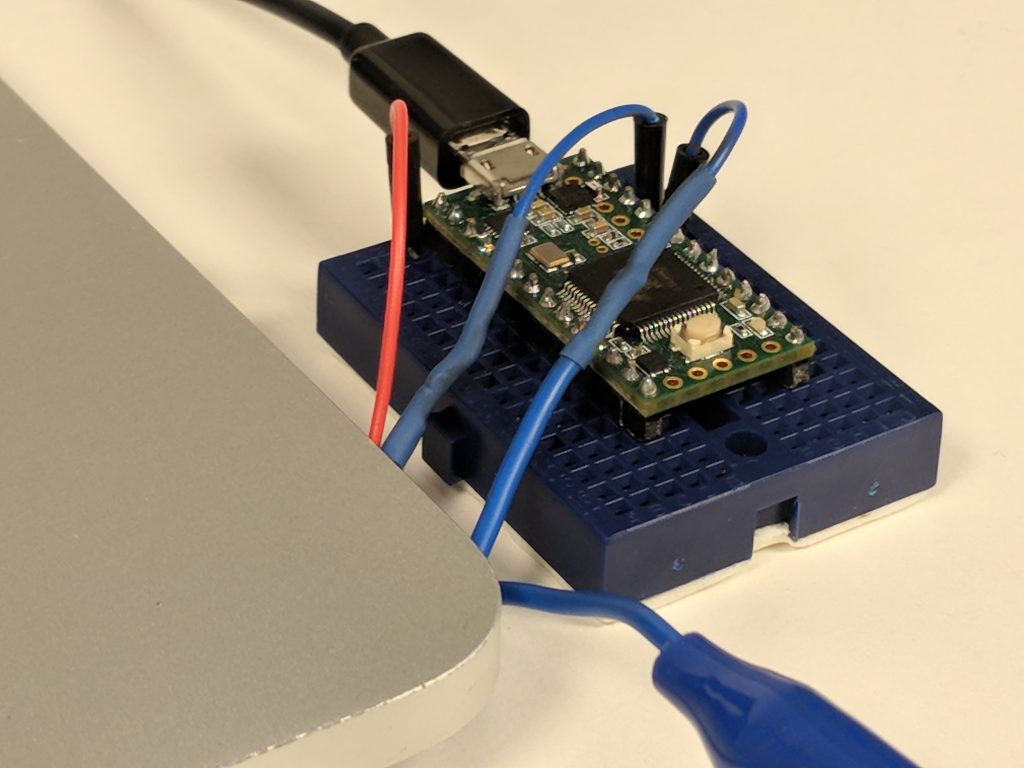
The project features teensy 3.2’s touchRead() function for capacitive input.


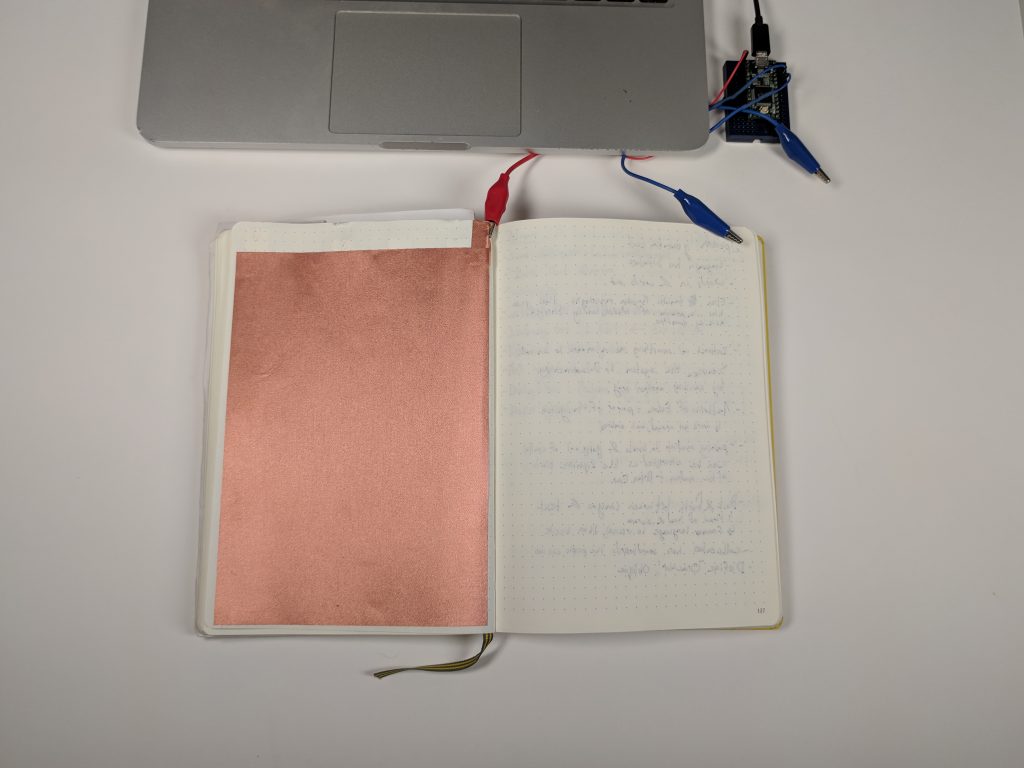
As an attempt to reduce interference noise in the sensor system, a swatch of conductive fabric was added to the opposite side of the page; it was grounded to the the teensy. Sensor signal smoothing still needs works.


Assignment 5

Car Driver

Description: 

For this assignment, I made a car animation. The user can click anywhere on the black background to place a car. The cars start at speed = 0 and add 10 each time the button is pressed.

Basic GUI: 

Breadboard: 

Video demo: 

Code: 

assignment5


**Code/idea is a combination of alterations from class 10 notes and http://coursescript.com/notes/interactivecomputing/objects/index.html  **

Assignment5 – Interactive Map

I worked with Mappa.js to visualize a dataset on Google Maps. I found Mappa.js useful for quickly getting interactive online maps running. I tweaked one of the example code so that the objects get updated by the user’s mouse click.

I used NASA’s open data portal and took the meteorite dataset as input. Each row is the history of meteorite landings with latitude/longitude information. Every time the user clicks, it reads the new row and visualizes on Google Maps where it landed. It calls Google Maps API to map latitude/longitude to a city and creates an object for each city. If data with the previously appeared city is observed, it increments the size of the circle. Since there are cases where the city is not included in the API response, I used try/catch to ignore unidentifiable data.

Code-Assign5