Title: History City
Description: Your browsing history says a lot about you. What if there was a way to visualize it? Take a look at all the pure (and not so pure) things you’ve been up to in a city-like visualization of your history.

What is Your Project: a history visualizer that builds a city based on the type and frequency of sites you visit.
What Makes Your Project Interesting: we’re never used to looking back at our browsing history because of how its portrays a darker, more secret side of us that we wouldn’t show others. Normally we want to forget/clear our history, but instead of running away from our browsing history, we can now visualize it.
Contextualize Your Work: visually I was inspired by the Three.JS app Infinitown (https://demos.littleworkshop.fr/infinitown) that tried to produce a bright, low-poly city that would stretch on forever. Rather than just random building placement, I wanted to use data to help generate the city.

Evaluate Your Work: The resulting work looks visually impressive, although with more time I would like to focus on city diversity (getting more distinct cities when you input more distinct browsing histories).
Documentation:
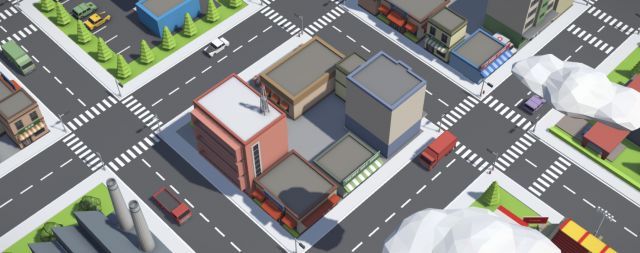
Loading a city with a high pure value.
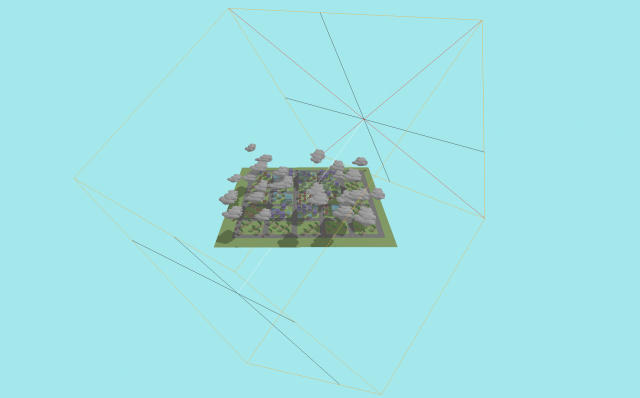
Loading a city with a low pure value.
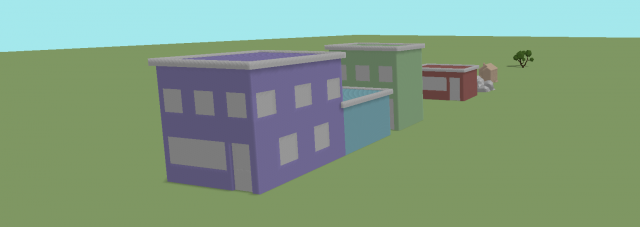
Clicking on assets to view what sites they are backed by.
The Process:
Given a JSON of a person’s browsing history, the parsing script initially cleans up entries by grouping together link for the same domain name and accumulating site frequency. On a second pass, the script tries mapping each url to an asset type [“building”, “house”,”tree”] depending on the contents of the webpage. The script scrapes the inner html and extracts the top K unique words that frequently occur in the site that don’t occur in other sites. Using these words and a synonym dictionary, the script maps the url to an asset type depending on the connotation of these words:
“building” – corporate, shopping, social media
“house” – personal, lifestyle
“tree” – learning, donating
After the mapping is computed, the Three.JS interface loads an instance of each asset. For each url, the corresponding asset is placed, and its size is determined by its frequency. Using Three.JS’s ray-tracer, we can compute the cursor intersection with an asset. On the instance an asset it hovered over, a portion of its material will turn to an orange highlight, and clicking the asset will open a new tab with the url that asset represents.

Roads are generated around 5×5 cell regions. Starting in the center and moving in a spiral motion, each new asset it placed in the initial center 5×5 region while not overlapping with any other asset. If no room exists after a set number of tries, then it moves to the next 5×5 region. This continues to expand the city the more url’s there are to load.
A purity variable captures the ratio of buildings + houses to trees. A more pure city will have no clouds/pollution and no cars on the road polluting. A non-pure city will be dark and have a lot of polluting cars on the road with a lot of dark clouds covering the sky.
