Fireworks

This program was inspired when I was playing around with altering the degree of the function, and noticing that it behaved like a flashing light. I applied this to the mouse, using the mouse to control how the function behaves, and also it’s size, to create “flashes”. I colored them, and they became fireworks. To add another interactive element, I wanted to make something that the user could “explode” themselves, so I added the TNT.

sketch

var nPoints = 100;      //used for loops and mapping
var q = 10;     //used for changing degree
var p = 0;      //used for changing size

function setup() {
    createCanvas(400, 400);
    background(0,0,0)
    frameRate(10);
}


function draw() {
    background(0);  //black
    noStroke(); 

rectMode(CENTER);
fill(255,0,0)   //red
    rect(width/2,height/2,30,50)    //TNT block
fill(255)
    rect(width/2,height/2,30,20)
fill(0)
    text('TNT',width/2-12,height/2+5)

if(mouseIsPressed){
   if(mouseX<(width/2)+15 & mouseX>(width/2)-15 && mouseY<(height/2)+25 && mouseY>(height/2)-25)   //if mouse is inside TNT
        p=p+5       //increse size of explosion curve
    }else{
        p=0     //hide explosion curve
}

push();
translate(mouseX,mouseY-20)
    drawQuad7Curve();       //dynamite fuse
        q=q+1       //change degree of curve
            if(q>60){
                  q=10    //reset degree of curve after 60 changes
}
pop();

push();
    fill(255,0,0);  //red
        rect(mouseX,mouseY,10,20);  //TNT block
pop();

push()
if(mouseX>25 & mouseX<75){
     translate(20,50);  
       drawQuadCurve();     //green firework  
   }
if(mouseX<25){
    fill(0,255,0);      //green
       rect(20,height-mouseX*12,2,20)   //green firework starter
}
pop();

push();
 if(mouseX>50 & mouseX<100){
     translate(100,100);
         drawQuad2Curve();      //red firework
}
pop();

push();
if(mouseX>10 & mouseX<60){
    fill(255,0,0)       //red 
        rect(100,height-mouseX*4.5,2,20);    //red firework starter
}
pop();

push();   
if(mouseX>100 & mouseX<150){ 
    translate(200,300);
        drawQuad3Curve();       //blue firework 
}
pop();

push();
if(mouseX>60 & mouseX<110){
    fill(0,0,255);  //blue
        rect(200,height-mouseX/2,2,20);     //blue firework starter
}
pop();

push(); 
if(mouseX>150 & mouseX<200){
push();
    translate(300,200);
        drawQuad4Curve();   //yellow firework
} 
pop();

push();
 if(mouseX>100 & mouseX<150){
    fill(255,255,0);    //yellow
        rect(300,height-mouseX,2,20);       //yellow firework starter
}
pop();

push();
 if(mouseY>200 & mouseY<250){
    translate(350,100)
        drawQuad8Curve()        //purple firework
 }
pop();

push();
 if(mouseY>100 & mouseY<200){
    translate(150,50)
        drawQuad9Curve()        //light blue firework
 }
pop();

push();
    translate(200,200)
        drawQuad5Curve();       //orange explosion curve
        drawQuad6Curve();       //white explosion curve

 pop();


//--------------------------------------------------
function drawQuadCurve() {
    
var x;
var y;
var r;

    
    var a = map(mouseX,0,50,0,width/5);     //size determined by mouseX within a mapped range
    var n = constrain(mouseX, 0, height/2);     //degree of curve determined by a constrained mouseX

    
    fill(0,255,0);      //green
    beginShape();
    for (var i = 0; i < nPoints; i++) {
        var t = map(i, 0, nPoints, 0, TWO_PI);      //determine angle by mapping
        
        r =  a * sin(n*t)   //radius
           
        x = r * cos(t);     //x of function
        y = r * sin(t);     //y of function
        vertex(x, y);       //plot function
    
    }
    endShape(CLOSE);        //close object to fill


}

function drawQuad2Curve(){
    
var x;
var y;
var r;

    
    var a = map(mouseX,50,100,0,width/9)
    var n = constrain(mouseY/2, 0, height); 

    
    fill(255,0,0)
    beginShape();
    for (var i = 0; i < nPoints; i++) {
        var t = map(i, 0, nPoints, 0, PI*5);
        
        r =  a * sin(n*t) 
           
        x = r * cos(t);
        y = r * sin(t);
        vertex(x, y);
    }
    endShape(CLOSE);


}

function drawQuad3Curve(){
    
var x;
var y;
var r;

    
    var a = map(mouseX,100,150,0,width/7)
    var n = constrain(mouseX, 0, height-mouseY); 

    
    fill(0,0,255);
    beginShape();
    for (var i = 0; i < nPoints; i++) {
        var t = map(i, 0, nPoints, 0, PI*3);
        
        r =  a * sin(n*t)    
        x = r * cos(t);
        y = r * sin(t);
        vertex(x, y);
    }
    endShape(CLOSE);

}

function drawQuad4Curve(){
    
var x;
var y;
var r;

    
    var a = map(mouseX,150,200,0,width/5)
    var n = constrain(mouseX, 0, mouseY); 

    
    fill(255,255,0);
    beginShape();
    for (var i = 0; i < nPoints; i++) {
        var t = map(i, 0, nPoints, 0, TWO_PI);
        
        r =  a * sin(n*t)    
        x = r * cos(t);
        y = r * sin(t);
        vertex(x, y);
    }
    endShape(CLOSE);


}

function drawQuad5Curve(){
    
var x;
var y;
var r;

    
    var a = p*20
    var n = 60; 

    
    fill(247,181,67);
    beginShape();
    for (var i = 0; i < nPoints; i++) {
        var t = map(i, 0, nPoints, 0, TWO_PI);
        
        r =  a * sin(n*t) 
           
        x = r * cos(t);
        y = r * sin(t);
        vertex(x, y);
    }
    endShape(CLOSE);

}

function drawQuad6Curve(){
    
var x;
var y;
var r;

    
    var a = p*5;
    var n = 30; 

    
    fill(255);
    beginShape();
    for (var i = 0; i < nPoints; i++) {
        var t = map(i, 0, nPoints, 0, TWO_PI);
        
        r =  a * sin(n*t) 
           
        x = r * cos(t);
        y = r * sin(t);
        vertex(x, y);
    }
    endShape(CLOSE);

}

function drawQuad7Curve(){
    
var x;
var y;
var r;

    
    var a = 10
    var n = constrain(q, 0, height);        //degree based on the changingvariable q

    
    fill(255,255,0);
    beginShape();
    for (var i = 0; i < nPoints; i++) {
        var t = map(i, 0, nPoints, 0, TWO_PI);
        
        r =  a * sin(n*t) 
           
        x = r * cos(t);
        y = r * sin(t);
        vertex(x, y);
    }
    endShape(CLOSE);

}

}
function drawQuad8Curve(){
    
var x;
var y;
var r;

    
    var a = mouseX/10
    var n = constrain(q, 0, height);  
    
    fill(182,68,249);
    beginShape();
    for (var i = 0; i < nPoints; i++) {
        var t = map(i, 0, nPoints, 0, TWO_PI);
        
        r =  a * sin(n*t) 
           
        x = r * cos(t);
        y = r * sin(t);
        vertex(x, y);
    }
    endShape(CLOSE);

}

function drawQuad9Curve(){
    
var x;
var y;
var r;

    
    var a = map(mouseY,100,200,0,height/20)
    var n = constrain(q*2, 0, height); 

    
    fill(68,237,249);
    beginShape();
    for (var i = 0; i < nPoints; i++) {
        var t = map(i, 0, nPoints, 0, PI);
        
        r =  a * sin(n*t) 
           
        x = r * cos(t);
        y = r * sin(t);
        vertex(x, y);
    }
    endShape(CLOSE);

}

LO – Aaron Koblin

Eamonn Burke

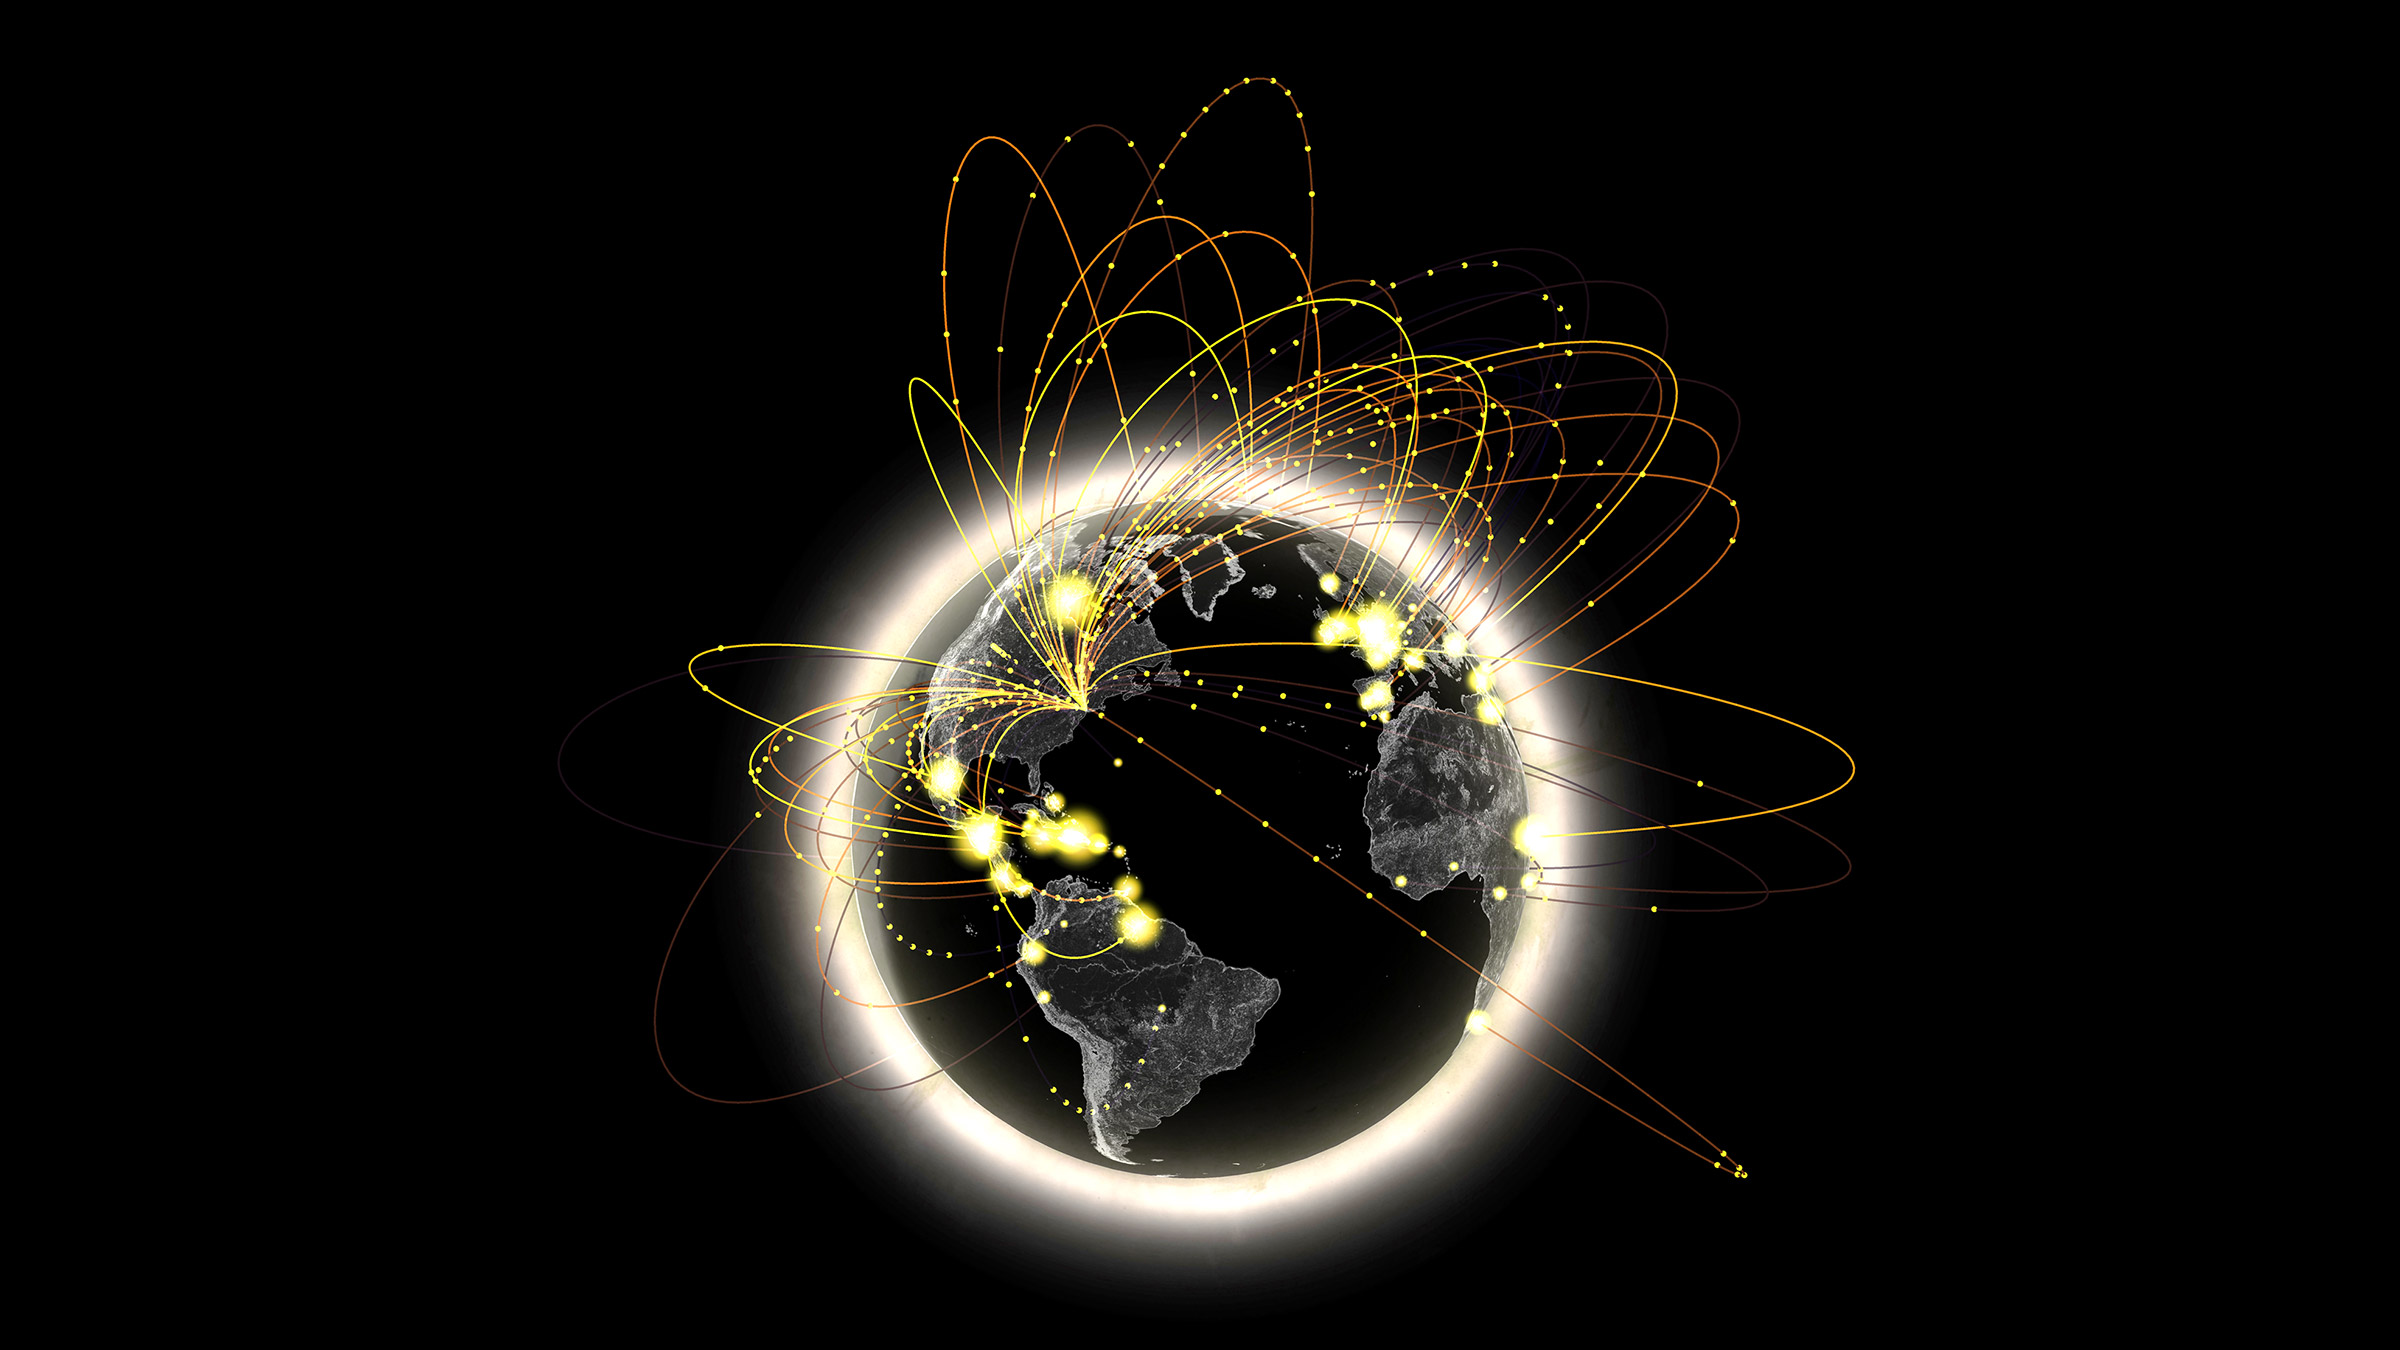
I once again return to the work of Aaron Koblin, because I find his work to be the most interesting subjects and the best representations of the listed designers. Here he visualizes AT&T call traffic in NYC, which is a fascinating way to represent geography and globalization. As with the last Koblin project I used, I love this piece because it’s at the intersection of human behavior and design. It depicts the social phenomenon of urbanization and globalization, as physical distance becomes negligible and we become one mind.

 I think Koblin used his creative sensibilities to convey this idea of a collective brain, by evoking the concept of travelling neurons to suggest connectivity. He also clearly conveys the “hotspots” and distinguishes the different types of calls by using brightness and color. 

I would guess that the software Koblin used here tracks call information including distance and location, and then uses this data to plot functions of curves that are projected onto a 3D world model, with the height of the curve depending on the distance of the call.

Abstract Clock – Oil Tanks

The idea for this project began as portraying time by building – I was going to use a system in which blocks fall into place to cover the entire screen at the end of the day. Realizing I didn’t know how to do this, I pivoted to something involving filling, so I made 24 tanks and had them increase in “Oil’ per minute and have the “drops” moving every second, so that they would all be filled at the end of the day. Then I wanted to add a psychological component. We experience the speed of time very relatively – the years in the beginning of your life are experienced as “slower” because you are comparing them to a smaller amount of previously lived years than say, an 80 year old. And so I applied this concept – the operation increases every second for each minute, and it also increases for every hour of the day. However, the tanks still fill up according to minutes – a reminder that everyone, no matter age, has the same 24 hours each day. This also serves for another metaphor – we put more work and effort into life (more drops, faster drops), as we are older, but it doesn’t change the amount of time we have. And lastly, I wanted to add an environmental undertone by using oil, a precious resource that is running out.

Oil Tanks
var w = [0,12,24,36,48,60,72,84,96,108,120,132,144,156,168,180,192,204,216,228,240,252,264,276];    //the containers filled with oil
var boxX = 1    //oil pipe fill rate start
var dropY = 1   //drip rate start
var ball = [9.5,21.5,33.5,45.5,57.5,69.5,81.5,93.5,105.5,117.5,129.5,141.5,153.5,165.5,177.5,189.5,201.5,213.5,225.5,237.5,249.5,261.5,273.5]   //reference balls
var d = [];   //amount of drops

function setup() {
    createCanvas(286, 60);    //light blue
    
}

function draw() {
  frameRate(second()+1);    //factory speeds up
  background(68-hour()*2,185-hour()*2,243-hour()*3);   //light blue, darkening with hours
  
    fill(189,189,189);  //light brown
        rect(0,4,500,3)   //oil pipe

for (x=0;x<285;x+=12){
    fill(169,136,80)    //light brown
       rect(x,30,9,30)     //oil tanks
}

 for (var i=0; i < w.length; i++) {
      fill(0)   //black
      if (hour()>i){
          rect(w[i],30,8,30)    //draw full oil tank
    }
    if (hour()==i){
      var oilLevel = height-minute()/2    //oil filling
          rect(w[i],oilLevel,8,oilLevel);   //draw oil tank filling
    }
  }
var faucetPos = hour()*11.875+6   //aligning faucet to be above corresponding tank


if(boxX>faucetPos){   //restart oil and drip when oil hits faucet
   boxX=0    //start of canvas
   dropY=5   //faucet spout level
}

boxX=boxX+faucetPos/60;   //travel rate
  rect(0,5,boxX,1)    //oil travelling in pipe
   

fill(0);    //black
ellipseMode(CORNER);


dropY = dropY+hour()/5;   //drop rate

    for (var i=0; i < 24; i++) {
        circle(faucetPos,dropY-d[i],1.3);     //drop tip
        triangle(faucetPos+.25,dropY-d[i],faucetPos+.6,dropY-d[i]-1,faucetPos+1.05,dropY-d[i]); 
           if(hour()>i){
               d.push(4*i*2);    //add a drop
    }
}


fill(255,0,0);    //red
    rect(0,.5,second()*5,2)   //reference bar at top

fill(150,150,150);    //medium gray
rectMode(CENTER);
    rect(faucetPos,5,10,5);   //faucet bottom
    rect(faucetPos,0,5,5);    //faucet top
rectMode(CORNER);


for (var i=0; i < ball.length; i++) {
  fill(0+second()*4.25,0,0)
      circle(ball[i],height/2+second()/2,2)
}
stroke(0)


}


Looking Outwards 6 – Minecraft Map

By Eamonn Burke

https://minecraft.gamepedia.com/File:Map_Zoom_4.png

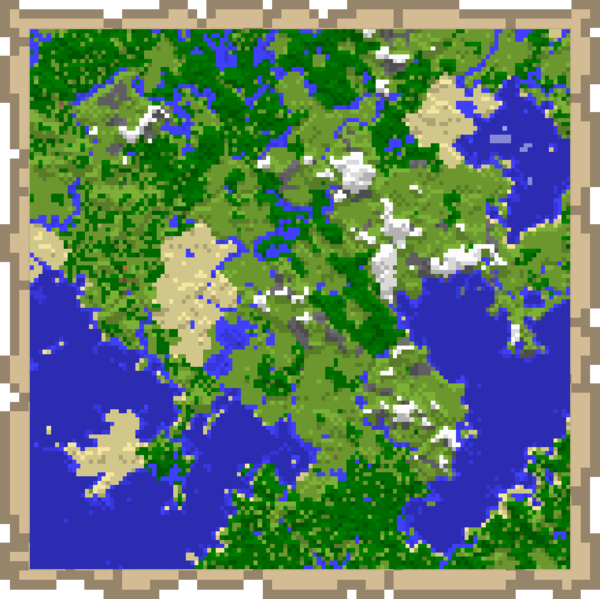
This is a map from the video game Minecraft developed by Markus Persson. Every time a new “world” is started, the map is randomly generated to include a variety of biomes, oceans, and other features. What I admire about this computational art is that it makes the game infinitely engaging and fun. You never know exactly what kind of map scape you’ll get, which lends to never-ending exploration every time you start a new world.

Minecraft worlds are built on a grid, so I would guess that each map has a random amount of “blocks” designated for each biome (including 0) centered around random x and y coordinates. I would also guess that the terrain height has a random range, but are biased in ways so that mountains and caves are created with Perlin noise. As far as non-landscape features, like villages and temples, these are probably plotted randomly as well, with more common features like villages having higher probability distributions.

Persson’s creative sensibilities came in knowing how to bias the randomness -creating realistic landscapes using appropriate ranges and logical conditions. He also was able to create an incredibly immersive game conducive to exploration and creation, despite choosing “outdated” graphics.

Space Wallpaper

For this project I knew I wanted to do something involving layered circles, and I actually accidentally came across a “moon” in another idea I was developing. I switched to space theme and proceeded from there. Using closely aligned circles I created “stars” from negative space and then used the positive space to fill with different space objects.

Outer Space

function setup() {
    createCanvas(800, 560);
    background(220);
    text("p5.js vers 0.9.0 test.", 10, 15);
}

function draw() {
	scale(2);	//zoom in x2
	noStroke();
background(255);


fill(58,37,165);	//dark blue
rectMode(CORNER);		//x an y are corner coordinates
	rect(0,0,width,23);	//blocking out the "stars" at the top and bottom
	rect(0,260,width,23)
 
translate (50,0);		//move 50 right and 0 down
	for (var y = -100; y <= 600; y += 40) {		//start at -100, add 40 to y until y=600
		for (var x = -100; x <= 800; x += 50) {		//start at -100, add 50 to x until x=800
			circle(x, y, 58);
		}
	}
pop();

push();
translate(0,-20)		//move 20 up
	fill(255,239,0);		//yellow
	for (var y3 =0; y3 <= 300; y3 += 80) {		//every other circle
		for (var x3 = 0; x3 <= 800; x3 += 100) {	//every other circle
			circle(x3, y3, 30);		//moon
		}
	}
pop();

push();
translate(-6,-28);		//move 6 left, 28 up
	for (var y4 =0; y4 <= 300; y4 += 80) {		//every other
		for (var x4 = 0; x4 <= 800; x4 += 100) {	//every other
			circle(x4, y4, 30);		//moon "shadow"
		}
	}
pop();

push();
translate(50,100);		//50 right, 100 down
	for (var y5 =0; y5 <= 100; y5 += 80) {	//every other
		for (var x5 = 0; x5 <= 300; x5 += 200) {
			planet(x5,y5);		//run planet function
		}
	}
pop();

push();
translate(100,60);		//100 right, 60 down
	for (var y6 =0; y6 <= 100; y6 += 80) {		//every other, constricted to the middle of the canvas
		for (var x6 = 0; x6 <= 300; x6 += 400) {	//constricted to run only once
			rocket(x6,y6);		//run rocket function
		}
	}
			
pop();

push();
	for (var y7 =0; y7 <= 200; y7 += 80) {		//every one
		for (var x7 = 0; x7 <= 300; x7 += 200) {	//every 4
			hat(x7,y7);		//run hat function
		}
	}	
pop();

push();
translate(0,50)		//move down 50
	for (var y8 =0; y8 <= 150; y8 += 80) {	//every other
		for (var x8 = 0; x8 <= 150; x8 += 100) {	//every other, constrained to left side
			UFO(x8,y8);		//call UFO function
		}
	}	
pop();

push();
translate(0,50)		//move down 50
	for (var y9 =0; y9 <= 150; y9 += 80) {	//every other
		for (var x9 = 0; x9 <= 150; x9 += 100) {	//every other, constrined to right side
			alien(x9,y9);		//call alien function
		}
	}	
}

function hat (x7,y7){

push();

	translate(x7,y7)	//repeat translation
fill(64,234,240);	//light blue
	rotate(radians(-7));	//rotate right
		triangle(0,59,2.5,45,8.5,58);	//hat
fill(255);	//white
	circle(2.5,45,3);	//pom
	quad(0,59,0,61,8.5,60,8.5,58)	//hat base

pop();
}

function planet(x5,y5){
push();

translate(x5,y5)
	rotate (radians(-10));	//rotate right
		fill(250,139,99,150);	//opaque red-orange
			ellipse(0,0,40,10);		//ring
fill(240,128,43);		//orange	
	rotate(radians(10));		//negate rotation
		circle(0,0,25);		//planet

pop();	

}

function rocket(x6,y6){

push();

translate(x6,y6);
	fill(255);	//white
		rotate(radians(-50));	//rotate right
			rect(0,50,10,20);	//rocket body
fill(255,0,0);	//red
	triangle(0,50,10,50,5,45);	//rocket top
	quad(0,70,-3,75,13,75,10,70);	//rocket bottom
fill(255,171,0);	//bright orange
	quad(-2,75,1,80,9,80,12,75);	//outer fire
	triangle(-1,75,5,85,11,75);		//outer fire bottom
fill(255,255,138);	//bright yellow
	triangle(1.5,75,5,82,8.5,75);	//inner fire
fill(139,139,139);	//gray
	circle(5,56,7);		//window frame
fill(2,217,225);	//light blue
	circle(5,56,5);		//window pane

pop();
}

function UFO(x8,y8){

push();

translate(x8,y8)
	fill(152,152,152);	//gray
		ellipse(0,50,40,15);	//ufo body
		quad (-5,52,-15,60,-14,61,-4,53)	//left landing leg
		rect (-2,52,1.5,10)		//middle landing leg
		quad (1,52,11,61,12,60,4,53)	//right landing leg
fill(175,238,170,200);	//opaque green-blue
	ellipse(0,45,25,15);	//window dome
fill(255,0,0);		//red
	circle(-12,52,3);	//left light
	circle(12,52,3);	//right light
fill(255,255,0);	//yellow
	circle(0,54.5,3);	//middle light

pop();
}

function alien(x9,y9){

	push();

translate(x9,y9)
	fill(198,0,191);	//purple-red
		ellipse(200,50,10,20)		//body
		quad(198,44,201,45,191,54,190,53);	//left arm
		quad(202,44,201,47,209,54,210,53);	//right arm
		quad(198,54,201,55,191,64,190,63);	//left leg
		quad(202,54,201,57,209,64,210,63);	//right leg
fill(1,233,1);	//bright green
	ellipse(200,40,15,10);	//head
	circle(190.5,53.5,2);	//left hand
	circle(209.5,53,2);		//right hand
	circle(190.5,63.5,2);	//left foot
	circle(209.5,63.5,2);	//right foot
fill(0);	//black
	ellipse(196,40,3);	//left eye
	ellipse(200,38,3);	//middle eye
	ellipse(204,40,3);	//right eye
	arc(200,42,3,3,0,PI); 	//smile
fill(134,227,246,150);	//opaque light blue
	ellipse(200,40,20,13);	//helmet
fill(199,199,199);	//ligth gray
	rect(195,44,10,2);	//helmet strap

pop();
}

3D Graphic Art

Eamonn Burke

Alex Grey – Fear Innoculum Cover

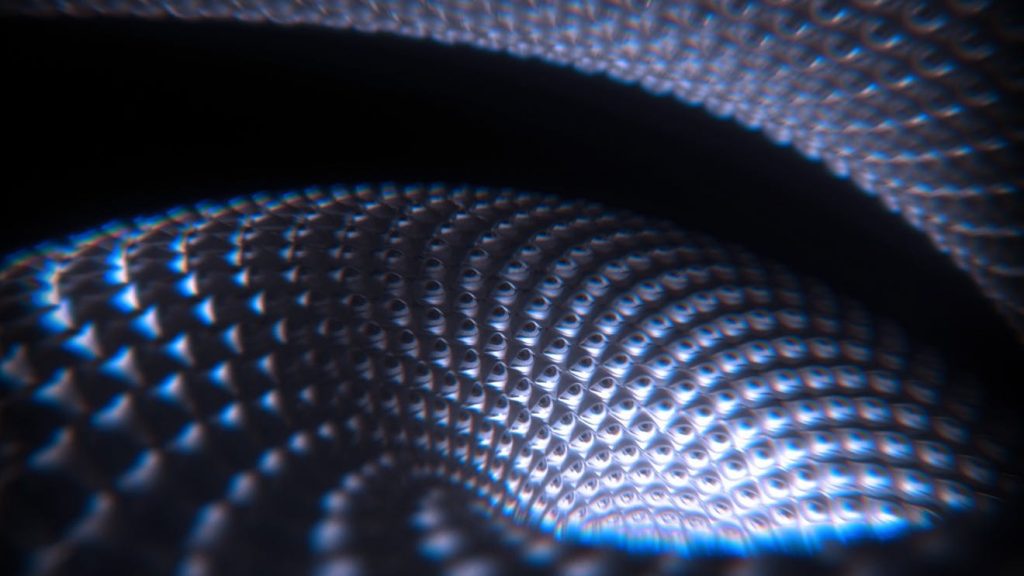
This visual was the cover art for the release of a recent album by one of my favorite bands, TOOL, designed by their artist Alex Grey.
What I really love about this artwork is that it establishes not just a 3D image, but a 3D environment. The piece is very atmospheric in its arrangement, and also has a strong sense of perspective and motion. In order to achieve this,
Grey used his artistic sensibility. Specifically, the behavior of the top and bottom borders of the image really reinforce this sense of immersion, as does the emanating light which generates ominous highlights on the eyes and contributes to the image’s tone of mysticism.
His contrasting use of blur and definition enhance the sense of movement.

I could not find the software that Alex Grey used, but I would guess it is Rhino or a similar one.
I also guess that this is a more complex version of our classwork now: using one coded element (a 3D eye),
using nested loops to repeat that component and guide it along a warped path, adding a light source with something like V-ray,
and taking a perspective angle view.

Shark Eggs

This piece came about from taking one component, the “V” shaped lines that guide the curved net, and putting combining them. It started with rotating them and putting 3 next to each other in alternating order, and then naturally mirroring that vertically, and connecting the sides together to create a strange shape that reminded me of an egg sac that had been opened. Naturally, I wanted to fit something inside the space, and create a distance as if one is passing through this hole to the other side. This idea naturally led to the development of the outside walls, to give a sense that the viewer is currently passing through one of these shapes.

Eamonn Burke Shark Eggs

var numLines = 40;

function setup() {
    createCanvas(600,600);
    background(200);
push();
    translate(100,100);     //translate object 100 x, 100 y
stroke(255)
strokeWeight(3)         //white guide lines 
    line(100,100,300,100);      //top horizontal
    line(100,300,300,300);      //bottom horizontal
    line(200,0,200,100);        //top vertical
    line(200,400,200,300);      //bottom vertical
    line(100,200,51,200);       //left horizontal
    line(300,200,349,200);      //right horizontal
    line(100,100,100,300);      //left vertical
    line(300,100,300,300);      //right vertical
         //
stroke(0)
strokeWeight(2)     //lines for middle sac
    line(200,0,100,200);        //top middle (1)
    line(300,200,200,0);        //top middle (2)
    line(200,400,100,200);      //bottom middle (3)
    line(300,200,200,400);      //bottom middle (4)
    line(300,200,200,0);        //top right (5)
    line(400,0,300,200);        //top right (6)
    line(100,200,200,0);        //top left (7)
    line(0,0,100,200);          //top left (8)
    line(300,200,200,400);      //bottom right (9)
    line(400,400,300,200);      //bottom right (10)
    line(100,200,200,400);      //bottom left (11)
    line(0,400,100,200);        //bottom left (12)  
    line(300,200,400,0);        //right side (13)
    line(400,400,300,200);      //right side (14)
    line(100,200,0,0);          //left side (15)
    line(0,400,100,200);        //left side (16)
strokeWeight(1.5)       //lines for furthest sac
    line(200,175,200,225);      //vertical sac line   
    line(175,200,225,200);      //horizontal sac line
    line(200,200,145,130);      //top (19)
    line(255,130,200,200);      //top (20)
    line(200,200,145,130);      //left side (21)
    line(145,270,200,200);      //left side (22)
    line(200,200,255,130);      //right side (23)
    line(255,270,200,200);      //right side (24)
    line(200,200,145,270);      //bottom (25)
    line(255,270,200,200);      //bottom (26) 


strokeWeight(2)
    
pop();
translate(-150,-300)
strokeWeight(5)     //lines for closest sac
    line(450,0,100,600);        //top middle (27)
    line(800,600,450,0);        //top middle (28)
    line(450,1200,100,600);     //bottom middle(29)
    line(800,600,450,1200);     //bottom middle(30)
    line(800,600,450,0);        //top right (31)
    line(1150,0,800,600);       //top right (32)
    line(100,600,-250,0);       //top left (33)
    line(450,0,100,600);        //top left (34)
    line(800,600,450,1200);     //bottom right (35)
    line(1150,1200,800,600);    //bottom right (36)
    line(100,600,-250,1200);    //bottom left (37)
    line(450,1200,100,600);     //bottom left (38)
    strokeWeight(1)
      
                                //spaces between lines
    dx1 = (100-200)/numLines;
    dy1 = (200-0)/numLines;
    dx2 = (200-300)/numLines;
    dy2 = (0-200)/numLines;
    dx3 = (100-200)/numLines;
    dy3 = (200-400)/numLines;
    dx4 = (200-300)/numLines;
    dy4 = (400-200)/numLines;
    dx5 = (200-300)/numLines;
    dy5 = (0-200)/numLines;
    dx6 = (300-400)/numLines;
    dy6 = (200-0)/numLines;
    dx7 = (200-100)/numLines;
    dy7 = (0-200)/numLines;
    dx8 = (100-0)/numLines;
    dy8 = (200-0)/numLines;
    dx9 = (200-300)/numLines;
    dy9 = (400-200)/numLines;
    dx10 = (300-400)/numLines;
    dy10 = (200-400)/numLines;
    dx11 = (200-100)/numLines;
    dy11 = (400-200)/numLines;
    dx12 = (100-0)/numLines;
    dy12 = (200-400)/numLines;
    dx13 = (400-300)/numLines;
    dy13 = (0-200)/numLines;
    dx14 = (300-400)/numLines;
    dy14 = (200-400)/numLines;
    dx15 = (0-100)/numLines;
    dy15 = (0-200)/numLines;
    dx16 = (100-0)/numLines;
    dy16 = (200-400)/numLines;
    dx17 = (100-100)/numLines;
    dy17 = (300-100)/numLines;
    dx18 = (300-300)/numLines;
    dy18 = (300-100)/numLines;
    dx19 = (145-200)/numLines;
    dy19 = (130-200)/numLines;
    dx20 = (200-255)/numLines;
    dy20 = (200-130)/numLines;
    dx21 = (145-200)/numLines;
    dy21 = (130-200)/numLines;
    dx22 = (200-145)/numLines;
    dy22 = (200-270)/numLines;
    dx23 = (255-200)/numLines;
    dy23 = (130-200)/numLines;
    dx24 = (200-255)/numLines;
    dy24 = (200-270)/numLines;
    dx25 = (145-200)/numLines;
    dy25 = (270-200)/numLines;
    dx26 = (200-255)/numLines;
    dy26 = (200-270)/numLines;
    dx27 = (100-450)/numLines;
    dy27 = (600-0)/numLines;
    dx28 = (450-800)/numLines;
    dy28 = (0-600)/numLines;
    dx29 = (100-450)/numLines;
    dy29 = (600-1200)/numLines;
    dx30 = (450-800)/numLines;
    dy30 = (1200-600)/numLines;
    dx31 = (450-800)/numLines;
    dy31 = (0-600)/numLines;
    dx32 = (800-1150)/numLines;
    dy32 = (600-0)/numLines;
    dx33 = ((-250)-100)/numLines;
    dy33 = (0-600)/numLines;
    dx34 = (100-450)/numLines;
    dy34 = (600-0)/numLines;
    dx35 = (450-800)/numLines;
    dy35 = (1200-600)/numLines;
    dx36 = (800-1150)/numLines;
    dy36 = (600-1200)/numLines;
    dx37 = ((-250)-100)/numLines;
    dy37 = (1200-600)/numLines;
    dx38 = (100-450)/numLines;
    dy38 = (600-1200)/numLines;
   
}

function draw() {
translate(100,100);
    var x1 = 200;       //first x and y values of each line
    var y1 = 0;
    var x2 = 300;
    var y2 = 200;
    var x3 = 200;
    var y3 = 400;
    var x4 = 300;
    var y4 = 200;
    var x5 = 300;
    var y5 = 200;
    var x6 = 400;
    var y6 = 0;
    var x7 = 100;
    var y7 = 200;
    var x8 = 0;
    var y8 = 0;
    var x9 = 300;
    var y9 = 200;
    var x10 = 400;
    var y10 = 400;
    var x11 = 100;
    var y11 = 200;
    var x12 = 0;
    var y12 = 400;
    var x13 = 300;
    var y13 = 200;
    var x14 = 400;
    var y14 = 400;
    var x15 = 100;
    var y15 = 200;
    var x16 = 0;
    var y16 = 400;
    var x17 = 100;
    var y17 = 100;
    var x18 = 300;
    var y18 = 100;
    var x19 = 200;
    var y19 = 200;
    var x20 = 255;
    var y20 = 130;
    var x21 = 200;
    var y21 = 200;
    var x22 = 145;
    var y22 = 270;
    var x23 = 200;
    var y23 = 200;
    var x24 = 255;
    var y24 = 270;
    var x25 = 200;
    var y25 = 200;
    var x26 = 255;
    var y26 = 270;
pop();
    var x27 = 450;
    var y27 = 0;
    var x28 = 800;
    var y28 = 600;
    var x29 = 450;
    var y29 = 1200;
    var x30 = 800;
    var y30 = 600;
    var x31 = 800;
    var y31 = 600;
    var x32 = 1150;
    var y32 = 0;
    var x33 = 100;
    var y33 = 600;
    var x34 = 450;
    var y34 = 0;
    var x35 = 800;
    var y35 = 600;
    var x36 = 1150;
    var y36 = 1200;
    var x37 = 100;
    var y37 = 600;
    var x38 = 450;
    var y38 = 1200;
    var x39 = -100;
    var y39 = -100;
    var x40 = 600;
    var y40 = -100;


    for (var i = 0; i <= numLines; i += 1) {        //when variable i is less than the variable
                                                    //numLines, run this loop
stroke(255,50);     //opaque white
       line(x17,y17,x18,y18);       //"screen"
            x17 += dx17         //add spacing to current x and repeat
            y17 += dy17     //add spacing to current y and repeat
            x18 += dx18
            y18 += dy18

stroke(50)      //medium dark gray
        line(x1, y1, x2, y2);       //top middle flap
            x1 += dx1;
            y1 += dy1;
            x2 += dx2;
            y2 += dy2;

        line(x3,y3,x4,y4);      //bottom middle flap
            x3 += dx3;
            y3 += dy3;
            x4 += dx4;
            y4 += dy4;

        line(x5,y5,x6,y6);      //top right flap
            x5 += dx5;
            y5 += dy5;
            x6 += dx6;
            y6 += dy6;

        line(x7,y7,x8,y8);      //top left flap
            x7 += dx7;
            y7 += dy7;
            x8 += dx8;
            y8 += dy8;

        line(x9,y9,x10,y10);        //bottom left flap
            x9 += dx9;
            y9 += dy9;
            x10 += dx10;
            y10 += dy10;

        line(x11,y11,x12,y12);      //bottom right flap
            x11 += dx11;
            y11 += dy11;
            x12 += dx12;
            y12 += dy12;

        line(x13,y13,x14,y14);      //right side flap
            x13 += dx13
            y13 += dy13
            x14 += dx14
            y14 += dy14

        line(x15,y15,x16,y16);      //left side flap
            x15 += dx15
            y15 += dy15
            x16 += dx16
            y16 += dy16
stroke(100);        //light gray            //flaps for furthest sac
         line(x19,y19,x20,y20);     //top flap
            x19 += dx19
            y19 += dy19
            x20 += dx20
            y20 += dy20

         line(x21,y21,x22,y22);     //left side flap
            x21 += dx19
            y21 += dy19
            x22 += dx22
            y22 += dy22

        line(x23,y23,x24,y24);      //right side flap
            x23 += dx23
            y23 += dy23
            x24 += dx24
            y24 += dy24

        line(x25,y25,x26,y26);      //bottom flap
            x25 += dx25
            y25 += dy25
            x26 += dx26
            y26 += dy26


stroke(0)       //black         //flaps for closest sac
        push();
        strokeWeight(2);
        translate(-250,-400);
          line(x27,y27,x28,y28);        //top flap
            x27 += dx27
            y27 += dy27
            x28 += dx28
            y28 += dy28

        line(x29,y29,x30,y30);      //bottom flap
            x29 += dx29
            y29 += dy29
            x30 += dx30
            y30 += dy30

        line(x31,y31,x32,y32);      //top right flap
            x31 += dx31
            y31 += dy31
            x32 += dx32
            y32 += dy32 

        line(x33,y33,x34,y34);      //top left flap
            x33 += dx33
            y33 += dy33
            x34 += dx34
            y34 += dy34 

        line(x35,y35,x36,y36);      //bottom right slap
            x35 += dx35
            y35 += dy35
            x36 += dx36
            y36 += dy36

        line(x37,y37,x38,y38);      //bottom left flap
            x37 += dx37
            y37 += dy37
            x38 += dx38
            y38 += dy38

        pop();
   
       
    }

    noLoop();
}

Sound Computational Art – “Sorting”

Eamonn Burke

My favorite hobby is drumming. As a drummer, a good sense of math is necessary for rhythm, but only at a basic level. However, being the CMU student that I am, I like to push the limits and find complex time signatures generated by complex algorithms. This is why I admire this project, “Sorting” because it’s taking a mathematical approach to sound and applies algorithms to it in an exploratory way. 

The software, Processing, uses data information and seven different algorithms to sort the data, visualize it, and convert it to sound. Beyond that it is honestly hard to tell exactly how the program works, but there seems to be a “ticker” that processes the numbers procedurally, creating radian ranges as it works and sorts the data into these radian ranges based on data information. 

The artistic sensibilities come across in the use of color and motion, which both serve to show how the data is being processed. The pairing of different sounds with the motion and color indicate what is happening, whether a confirmative ticking (with sparks) or a rejecting “thud” (with red flash).The varying line weights create a really beautiful and mesmerizing hierarchy of systems.

My Dynamic Factory

This code simulates a dynamic factory environment, with variable elements including functionality of the factory, speed of the factory, the background factories, and the time of day. The idea for gears came from another class of mine in which we used squares to create interesting compositions. One of mine was created by overlaying two squares to create a “gear” so I knew I wanted to visualize it in motion for this project. I coded the gears to that they appear to work together, and appear to create an output when doing so. The rest stemmed from this “factory” theme.

painting
var angle = 0;		//gear turn
var t = 34;		//gear translate
var eSize = 10;		//ball sizes, center gear
var ballY = 409;		//front ball Y position
var recX = 7*t; 		//top piston X translation
var RecX = 7*t;			//bottom piston X tranlation 
var recY=10.5*t;		//pistons Y translation
var dir = 1; 		//top piston direction
var direction = 1;		//bottom piston direction
var speed = 2;			//piston speed
var recSize =  18;		//piston length
var BallY = 125;		//middle ball Y position
var windowSize = 25;	//window size
var Bally = 300;	//furthest ball start
var bright = 0;


function setup() {
    createCanvas(500, 409);
    background(220);
    text("p5.js vers 0.9.0 test.", 10, 15);
}

function draw() {
	background (210,146, 6);		//orange brown
	push();
	if(mouseIsPressed){
		if(mouseButton == RIGHT){		//if the right button is pressed
			background(210-mouseY/2, 146 -mouseY/2, 6- mouseY/2);		//gets darker with higher Y
				if(mouseY>height/2){		//if the mouse Y is greater half the height
			fill(255);		//stars
				ellipse (100,200,1,1);
				ellipse (200,100,5,5);
				ellipse (300,100,3,3);
				ellipse (300,200,5,5);
				ellipse (300,300,3,3);
				ellipse (150,50,5,5);
				ellipse (420,120,2,2);
				ellipse (200,100,5,5);
				ellipse (150,150,5,5);
				ellipse (180,220,2,2);
				ellipse (300,200,1.5,1.5);
				ellipse (300,250,1,1);
				ellipse (450,100,2,2);
				ellipse (100,289,5,5);
				ellipse(50,70,2.5,2.5);
				ellipse (190,120,2.4,2.4);
				ellipse (100,289,5,5);
				ellipse(50,70,2.5,2.5);
				ellipse (200,60,1.2,1.2);
				ellipse(90,90,2,2);
				ellipse (230,200,2.4,2.4);
				ellipse (460,60,5,5);
				ellipse(440,100,2.7,2.7);
				ellipse (250,250,2.4,2.4);
				ellipse (260,200,3,3);
				ellipse(240,220,2.1,2.1);
				ellipse(300,110,1.7,1.7);
				ellipse (280,190,2.3,2.3);
				ellipse (290,140,3.1,3.1);
				ellipse(215,210,2,2);
				ellipse (400,90,2.3,2.3);
				ellipse (410,120,1.5,1.5);
				ellipse(420,50,2,2);
			}
			if(mouseY<height/2){ 		//if mouse Y is lower than the height
				fill(255,255,117);
				ellipse(0,mouseY,60,60);		//sun
			}
		}
	}
pop();
push();
				fill(0,0,0,200);
rectMode(CORNER);
	var m = max(min(mouseX, 250), 0);
	var size = m * 350.0 / 400.0;
				fill(0,0,0,height-mouseY);
	rect(10,height/2-recSize*1.5,75,500);		//left chimney
	rect(0,height/2,size,500);		//left building
size = 350-size;
				fill(0,0,0,mouseY+50);
	rect(110+m*190/400,height/2-recSize*2,size,500);		//back building
		var ballWidth = max(min(mouseY, 100), 0);
	rect(110+m*190/400,height/2-recSize*4,ballWidth,37);		//back chimney
	
	if(BallY<0){		//if ball goes past 0
		BallY=height/2-recSize*4;		//reappear at height of back chimney
}

	BallY = BallY-1;	//move up by 1 point 
		ellipse(110+m*190/400+ballWidth/2,BallY,ballWidth,-ballWidth);		//middle ball

	if(Bally<0){		//if ball goes past 0
		Bally=250;		//reset ball height to 250
}

	Bally = Bally-2	;	//move up by 2 points
			fill(0,0,0,mouseX);		//opacity changes with mouseX
			if(mouseY>200){			//if mouse Y is greater than half the height
				fill(210,146, 6);		//fill changes to background (disappears)
			}

		ellipse(380,Bally,height/4 - ballWidth,height/4 - ballWidth);	//right ball
			fill(0,0,0);


rectMode(CENTER);		//rectangles oriented by center point

			fill(150);
rect(recX,recY+5,3.2*recSize,1/2*recSize);		//top piston still
rect(RecX,recY+25,3.5*recSize,1/2*recSize);		//bottom piston still

if(mouseX<1.5*t & mouseY<1.5*t){		//if mouse is in the top left corner
	if(recX>width-220 || recX

Looking Outwards – Jason Salavon

By Eamonn Burke

I found myself fascinated and inexplicably compelled to Jason Salavon’s Glassware Still Life. What initially grabbed my attention was how tangible the glass appeared with only manipulated light, and how texturally satisfying it seems. His artistic sensibility certainly came in for this, as well as so elegantly showing how the glasses morph into one another, and create recognizable intermediary glass designs in the process. 

On a deeper level, Salavon’s piece attracted me because it’s relatable – unlike many other generative pieces that depict complex and unfamiliar  systems. This piece shows how simple objects in our lives are simply variations of one another following a generative “code”. I admire that he was able to dissect one of these everyday systems and show it so clearly. 

I know that Salavon used custom software, but I would guess that the basic code involves stretching of parameters bounded by “if ” statements. These dictate when a glass stretches (ex. Height=height+1, If height=x -> width =width+1), by how much, and in what direction, while holding certain other dimensions constant. Again, his sensibility comes in knowing when to change which parameters to create interesting intermediary designs.